2018 Sebago Lake Assessment
|
|
|
- Gerald Lewis
- 5 years ago
- Views:
Transcription

1 2018 Sebago Lake Assessment
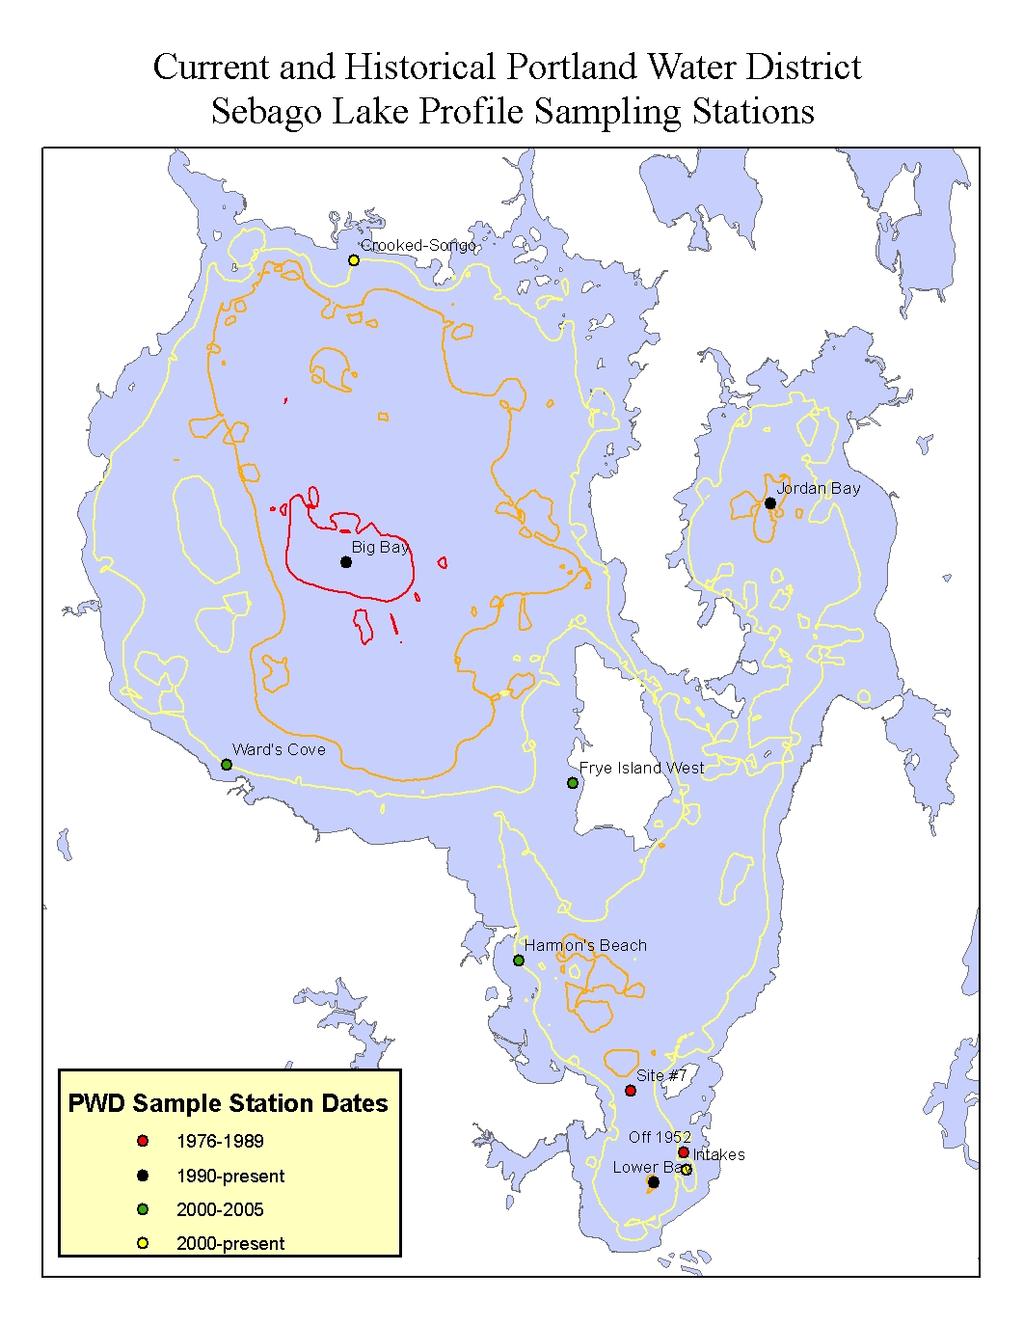
2 Portland Water District Sebago Lake Watershed Monitoring Programs Lake Monitoring Presenting data from 1976 to 2018 Nathan Whalen Introduction Sebago Lake is the primary drinking water supply for nearly 200,000 people in 11 Greater Portland communities. Lake water was first delivered to Portland in 1869, from an intake located in the southernmost part of the lake, referred to as Lower Bay. In 1908, the Portland Water District was chartered by the Maine Legislature to provide water services to the cities of Portland and South Portland. The water system has gradually expanded to include 11 cities and towns in Greater Portland. Since its inception, the District has been actively monitoring and working to protect Sebago Lake. In 1993, the District was granted a waiver to the filtration requirements of the federal Safe Drinking Water Act (SDWA) based in part on the purity of the water and the effectiveness of watershed protection efforts. This waiver agreement requires ongoing monitoring of lake water quality. The District maintains more than 10 monitoring and surveillance programs throughout the watershed and lake. In general, as one moves closer to the intakes, more samples are collected and tested for more parameters. This report summarizes results of the Lake Monitoring Program Methods Lake profile sampling events occur once a month from May to November. Three deep stations of maximum depth in Lower Bay, Big Bay and Jordan Bay are monitored for total phosphorus, chlorophyll a, Secchi disk transparency and dissolved oxygen/temperature profiles. Epilimnetic core samples are analyzed for chlorophyll a and total phosphorous concentrations. Secchi disk transparency is measured and dissolved oxygen and temperatures are recorded every meter from the lake surface to the bottom. Data from the Lower Bay deep basin station are used in this assessment. The Lower Bay data set represents the longest time period of monitoring data available for Sebago Lake. Secchi Disk (SD) Secchi disk transparency measurements are one of the easiest, cheapest and most recognizable lake water quality parameters. The disk represents a measure of water clarity or transparency. Things that interfere with transparency are; algae, silt, detritus and color. Sebago Lake has essentially no color and has enough water volume in the deep basins that Secchi transparency can be considered a surrogate for algae productivity. Larger values represent greater water transparency thus better water quality. Total Phosphorus (TP) Phosphorus is the least abundant nutrient in freshwater systems and is considered the limiting factor of biological productivity in Maine lakes. Phosphorous has numerous chemicals forms, some of which are readily available to freshwater biota and some are not. Simple dissolved phosphorus is quickly absorbed into the aquatic ecosystem base by algae, while complex colloidal organic bound phosphorus typical sinks to the bottom of a lake and becomes bound in the sediment, under oxygen saturated conditions. Total phosphorus is a measure of all molecular forms of phosphorus. 2
3 Chlorophyll a (CHL) Chlorophyll a is the photosynthetic pigment found in algae. Measuring this green pigment is a surrogate measure to estimate the total algal biomass in a lake. There are numerous methods to quantify the greenness of a lake. The Portland Water District takes an epilimnetic core sample down to, but not including, the thermocline as determined by the temperature/dissolved oxygen profile. The sample is filtered through a 0.45 um glass fiber filter, preserved with MgCO3 and frozen. Samples are ground with a Teflon glass tissue homogenizer and seeped in acetone for 4 hours. Samples are analyzed on a spectrophotometer using the trichromatic method. Results and Discussion There are numerous way to asses and analyze trends in lake water quality data over time. Each way sheds a new and different light on the lake system. This season, the decision was made to analyze Lower Bay by itself. The Lower Bay has the longest record of data. We are also including some different statistical methods of analyzing the data. Percent Annual Change The percent annual change (PAC) represents how much the key variables are changing, if at all, per year. PAC = (slope/mean value of variable) * 100. The slope is (x) for the best fit regression line (y = mx+b) of the data. The mean value of the variable is simply the average of the entire data set. If the slope (x) of the line is not significant, the PAC becomes 0. Trophic State Index Trophic State Index (TSI), a measure of relative productivity of a lake, are calculated based on Secchi disk, total phosphorus and chlorophyll a measurements. The three TSI values are plotted on one graph (y axis is the three individual TSI values) and (x axis is the year) and a trend line is calculated for the TSI s values, giving the rate of TSI change per year. Three independent water quality parameters plotted on one graph provide a higher degree of accuracy than one individual parameter alone. A p-value is calculated for the regression line fitted to the data. The p value indicates the significance level of the regression line. A low p-value means that there is a low probability that the line is attributed to random chance (example; if p = 0.05 then there is a 5% chance the trend is due to random chance). 3
. This indicates no water quality change in the Lower Bay from 1976-2018. Lower Bay Transparency The average Secchi Disk Transparency in Lower Bay since 1976 is 10.")
4 Lower Bay Percent Annual Change and Trophic State Index The SD, TP, CHL and HVOD show an average percent annual change of 0.0 % per year (p= 1.00) and a TSI change of 0.01 TSI units +/- 0.4 TSI units per year (p= 0.75). This indicates no water quality change in the Lower Bay from Lower Bay Transparency The average Secchi Disk Transparency in Lower Bay since 1976 is 10.5 meters. The linear regression trend since 1976 shows no statistical change. Sebago Lake is consistently one of the clearest lakes in Maine. 4

5 Lower Bay Chla The average chlorophyll a in Lower Bay since 1979 is 1.5 ug/l. The linear regression trend since 1979 shows no statistical change. The blue dot on the chart represents the yearly average. Lower Bay Total Phosphorus The average Total Phosphorus in Lower Bay since 1979 is 4.4 ug/l. The linear regression trend since 1979 is flat. The red dot on the chart represents the yearly average. 5
6 Correlations A statistical correlation test was preformed on the data. This test measures how two sets of numbers are related to each other. The results are given as a correlation coefficient. This correlation coefficient is a number between -1 and 1. The sign +/- of the correlation indicates if the pair of data are directly proportional or inversely proportional, + being direct and being inverse. A value of -1 signifies a perfect inverse relationship, a value of 0 signifies no relationship, and a value +1 signifies a perfect direct relationship. Onesided significance is the probability of significance (p) of the correlation. For example, matching the row January to July rain with the Total P column, there is a > 99 % chance these data are directly related. In other words, as the May-October rainfall increases, the Total P in the lake increases. Same is true for Chla. As rainfall increases, the chlorophyll a increase. The correlation coefficient for May to October Rain and Secchi Disk is negative (-). Therefore, these data are inversely related. When it rains, the Secchi Disk numbers get lower. Relationships in bold red are statistically related to each other. Results show that Secchi Disk transparency, Chlorophyll a values and Total P values have not changed from All of the water quality parameters are related to the amount of rain from January to July. Only the proportion and directionality of the relationships are different. Kendall's tau Secchi Disk Total P Chla HVOD Year Correlation coefficient Valid cases One-sided significance January to July Rainfall Correlation coefficient Valid cases One-sided significance
7 Oxygen Depletion Rate (mg/m 3 /day) Hypolimnetic Dissolved Oxygen Depletion Rate Hypolimnetic oxygen depletion occurs when organic matter, dead algae cells, leaves, zooplankton, etc sink to the bottom of the lake and are consumed through bacterial decomposition. This loss of oxygen is empirically related to primary productivity of algae, phosphorous concentrations, and mean summer water temperatures and inversely related to secchi disk transparency. This hypolimnetic oxygen loss assumes that the organic matter of the photic zone is reflected in the oxygen consumption that occurs in the hypolimnion. There are many other factors such as hypolimnetic thickness, with-in season variation in depletion rates, phytoplankton composition and temperature that effect dissolved oxygen loss rates. If done properly, HVOD (mg/m 3 /day) can be used to compare primary productivity in a lake over time. Results show that the hypolimnetic dissolved oxygen depletion rate (HVOD) may be decreasing over time. The p value at standardized temperature is In the simplest terms, there is an 88% chance that the dissolved oxygen concentration at the bottom of the lake is remaining higher for a longer period of time. We can conclude that the Lower Bay is not losing oxygen at a faster pace over the past 25 years. 7
8 Conclusion 2018 was an better than average year for Sebago Lake water quality. The trophic state of Sebago Lake (based on the Lower Bay sampling station) has been stable since We focused on the Lower Bay data set because this is the longest dataset available. There are cyclical changes through the data set. However, the long term trend is stable. With cyclical data, linear regression analysis can sometimes give misleading results. This is because the slope of the linear line depends on the time period of the analysis. If data collection begins at a high point in a cycle and ends in a low point of the cycle, linear regression will have a negative slope. The opposite is also true; if data collection begins in a trough and ends in a peak, the slope will be positive. This may lead to false conclusions (Foster 2011). Linear regression becomes more valuable to determine if successive peaks are getting higher and the successive valleys are getting lower with a large data set encompassing numerous periods of peaks and valleys. It can also be useful to analyze water quality data with different statistical methods. Often different statistical analysis can yield a greater insight into the data (Whalen 2011). Fortunately hypolimnetic oxygen levels appear to be nearly saturated and stable over time. This phenomenon only occurs in the clearest, most biologically unproductive lakes. Monitoring and understanding the hypolimnetic dissolved oxygen depletion rate is one of the key elements to assess lake water quality. The oxygen/sediment interface plays an important role in internal recycling of phosphorous and ultimately lake primary productivity Sebago Lake water quality has been better than average for the past three of the last four years. Some of this can be can be attributed to the lower than average precipitation for the past four years. References Burns, N.M., J.C. Rutherford and J.S. Clayton A monitoring and classification system for New Zealand lakes and reservoirs. Lake and Reserv. Manage. 15 (4): Whalen, Nathan S Characterization of Sebago Lake Lower Bay Trophic State Since 1976 Foster, Grant Sebago Lake Water Quality 8
9 9