Enhanced Air Pollution Health Effects Studies Using Source-oriented Chemical Transport Models
|
|
|
- Ethelbert Bradley
- 5 years ago
- Views:
Transcription


1 Enhanced Air Pollution Health Effects Studies Using Source-oriented Chemical Transport Models Jianlin Hu, Nanjing University of Information Science & Technology Michael J. Kleeman, Bart Ostro, University of California, Davis The 1 st Regional GEOS-Chem Asia Meeting May 21 st 23 rd, 2015 Nanjing, China
2 Motivation Figure Source: DOCKERY DW, et al., Epidemiological and toxicological studies have shown positive associations between exposure to atmospheric particulate matter and adverse health effects Can we target a specific set of sources / components / size fractions for less cost than the current PM2.5 control program? Fewer sites provide detailed PM chemical component measurements than total PM 2.5 mass Are central monitors providing poor exposure estimates that are masking the more detailed associations?
 PWC = ii CC ii PP ii ii PP ii PM 2.5 Nitrate PM 0.1 EC Population Reference: Ostro et al.")
3 Population Exposure Strong spatial heterogeneity in concentrations and population Use one or a few monitor sites to represent an entire county/air basin could lead to exposure misclassification Population weighted concentrations (PWC) PWC = ii CC ii PP ii ii PP ii PM 2.5 Nitrate PM 0.1 EC Population Reference: Ostro et al., EHP,
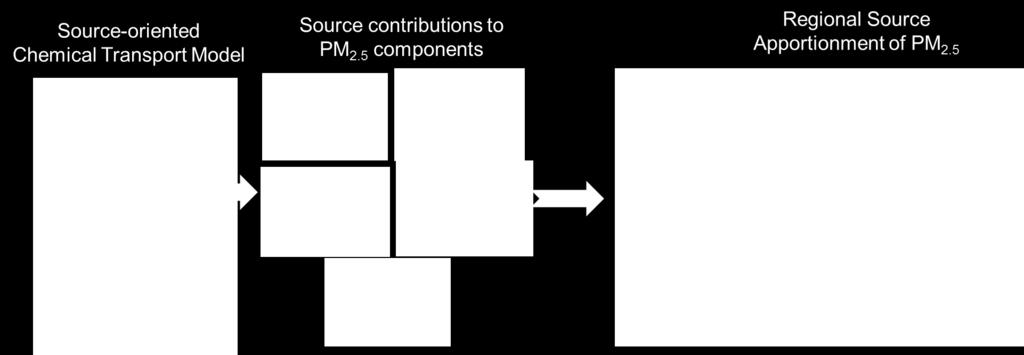
4 Source-Oriented Air Quality Models Tag precursors from different sources Track the sources directly through all atmospheric processes Need to expand the gas and aerosol mechanisms 6
5 Central Site Concentrations vs. Population Weighted Concentrations of Total EC and Mass Concentrations Reference: Hu et al., Environmental Science & Technology, 2014
6 95% CIs when Choosing Different Spatial Representativeness of Central Monitors
7 95% CIs for PM 2.5 Components with a 12 km buffer


8 95% CIs for PM 2.5 Components in Warm (Apr-Sept) vs. Cold (Oct-Mar) Seasons
9 PWC/CMC ratios for Primary PM 2.5 Sources Reference: Hu et al., ES&T, 2014.


10 One Year Simulation in China
11 Summary Strong spatial heterogeneity in concentrations in PM 2.5 components, sources and in different seasons. Population weighted concentrations of PM emitted from various sources calculated using the model spatial information differed from the central monitor estimates. CTMs provide more detailed information to help improve exposure assessment for health effect studies.
, it has not been subjected to any EPA review and therefore does not necessarily reflect the views of the Agency, and no official")
12 Acknowledgements R Disclaimer: Although the research described in the article has been funded wholly or in part by the U.S. Environmental Protection Agency's STAR program through grant (number), it has not been subjected to any EPA review and therefore does not necessarily reflect the views of the Agency, and no official endorsement should be inferred. Data Availability:
13 Supporting Slides


14 95% CIs for PM 2.5 Mass at Different Locations CI of PWC/CMC ratio
15 95% CIs of PWC/CMC ratios for PM 2.5 vs. PM 0.1 Calculation is based on the distance from monitors of 8km PM 0.1 shows greater spatial variations of CIs than PM 2.5
16 Chemical Transport Model (CTM): UCD/CIT Observation Data Model Gridded Data Emissions Inventory Biogenic Emissions Wildfire Emissions Terrestrial Data Meteorological Modeling by WRF Emissions Modeling UCD Source Profiles from Emission Tests UCD/CIT Air Quality Model Gas Pollutants (O 3,NO, NO 2, NH 3, SO 2, CO, HCHO, PAN, ISOP, etc.) Particulate Matter (EC, OC, SO 4 2-, NO 3-, NH 4+, Cl -, Na +, Ca 2+, Fe, Cu, Mn, etc.) Particulate Size Distributions (PM 0.1, PM 2.5, PM 10 ) Source Apportionment Information 16


17 Predicted Regional Distribution of PM 2.5 Sources on-road mobile sources off-road mobile sources wood burning sources shipping sources Reference: Hu et al., Identifying Primary PM2.5 and PM0.1 Sources for Epidemiological Studies in California. ES&T, 2014.
 by 50% (Mass CF, 2010) Emissions Emissions inventory from California Air Resources Board EMFAC2007 for mobile emissions")
18 Model Configuration for California Meteorology WRFv3.1 with FDDA Hourly average outputs Increased surface friction velocity (u*) by 50% (Mass CF, 2010) Emissions Emissions inventory from California Air Resources Board EMFAC2007 for mobile emissions 1kmX1km satellite wildfire emissions ( Wiedinmyer C. et al., Geosci. Model Dev. Discuss., 3, , 2010 ) UC-Davis_Primary (UCD_P) ~900 sources of primary PM UCD/CIT gaseous pollutants, Reference: Hu et al., Long-term Particulate Matter Modeling for Health Effects Studies in California Part I: Model Performance on Temporal and Spatial Variations. ACP, secondary inorganic aerosols (nitrate, sulfate, ammonium, etc.) secondary organic aerosol from 10 sources onroad/offroad gasoline, onroad/offroad diesel, wood burning, meat cooking, high sulfur content fuel combustion, other anthropogenic sources, biogenic sources, and IC/BCs
19 Predicted vs. Measured O 3 and PM 2.5 Reference: Hu et al., Long-term Particulate Matter Modeling for Health Effects Studies in California Part I: Model Performance on Temporal and Spatial Variations. ACP, 2015.
20 Predicted vs. Measured Nitrate and Total Organic Compounds Reference: Hu et al., Long-term Particulate Matter Modeling for Health Effects Studies in California Part I: Model Performance on Temporal and Spatial Variations. ACP, 2015.

21 Mean Fractional Bias Reference: Hu et al., Long-term Particulate Matter Modeling for Health Effects Studies in California Part I: Model Performance on Temporal and Spatial Variations. ACP, 2015.

22 Mean Fractional Error Reference: Hu et al., Long-term Particulate Matter Modeling for Health Effects Studies in California Part I: Model Performance on Temporal and Spatial Variations. ACP, 2015.
23 Model Evaluation Statistics Reference: Hu et al., Long-term Particulate Matter Modeling for Health Effects Studies in California Part I: Model Performance on Temporal and Spatial Variations. ACP, 2015.

24 Model Evaluation: MFB(numbers) and R (colors) of Monthly Average EC and Trace Elements at Individual Sites Reference: Hu et al., Predicting Primary PM2.5 and PM0.1 Trace Composition for Epidemiological Studies in California. ES&T, 2014.

, EC (b), OC (c), nitrate (d), sulfate (e), and ammonium (f) Reference: Hu et al.")
25 Predicted Regional Distribution of PM 2.5 Components Model performance provides confidence in CTM predictions at locations with no measurement 1 - Predicted 2 - measured 9-year average concentrations of PM2.5 total mass (a), EC (b), OC (c), nitrate (d), sulfate (e), and ammonium (f) Reference: Hu et al., Long-term Particulate Matter Modeling for Health Effects Studies in California Part I: Model Performance on Temporal and Spatial Variations. ACP, 2015.