Prepared By: Aqua-Air Environmental Engineers P. Ltd. 403, Centre Point, Nr. Kadiwala School, Ring Road, Surat (Guj.) Pre Monsoon, 2017
|
|
|
- Evelyn Moody
- 5 years ago
- Views:
Transcription


1 M/S. PRAFFUL OVERSEAS PVT. LTD. PLOT NO. 9C, GIDC ESTATE, PANOLI, ANKLESHWAR, DIST: BHARUCH, GUJARAT ENVIRONMENTAL IMPACT & RISK ASSESMENT REPORT FOR PROPOSED EXPANSION OF MANUFACTURING OF NYLONE YARN & POLYMER CHIPS IN EXSITIG UNIT. Pre Monsoon, 2017 Prepared By: NABL Accredited Testing Laboratory ISO 9001:2008 Certified Company Aqua-Air Environmental Engineers P. Ltd. 403, Centre Point, Nr. Kadiwala School, Ring Road, Surat (Guj.)
2 ENVIRONMENTAL IMPACT & RISK ASSESSMENT REPORT CLIENT : M/S. PRAFFUL OVERSEAS PVT. LTD. PLOT NO. 9C, GIDC ESTATE, PANOLI, ANKLESWAR DIST: BHARUCH (GUJ.) PROJECT TITLE : ENVIRONMENTAL IMPACT & RISK ASSESMENT REPORT FOR PROPOSED EXPANSION OF MANUFACTURING OF NYLON YARN & POLYMER CHIPS IN EXISTING UNIT. PROJECT NO. : Prepared By: NABL Accredited Testing Laboratory ISO 9001:2008 Certified Company Aqua-Air Environmental Engineers P. Ltd. 403, Centre Point, Nr. Kadiwala School, Ring Road, Surat
3 INDEX SR. NO. TITLE PAGE NO. INDEX 3 LIST OF TABLES 9 LIST OF FIGURE 11 TOR LETTER 12 COMPLIANCE OF TOR 19 UNDERTAKING BY PROJECT PROPONENT 36 DECLARATION BY EXPERTS CONTRIBUTING TO THE EIA REPORT 37 DECLARATION BY HEAD OF THE ORGANIZATION 41 1 CHAPTER 1: INTRODUCTION 1.1 BACKGROUND JUSTIFICATION PROMOTERS AND THEIR BACK GROUND REGULATORY FRAMEWORK PROJECT SETTING KEY INFRASTRUCTURAL FEATURES AND SETTLEMENTS PURPOSE OF EIA OBJECTIVES OF EIA METHODOLOGY FOR EIA BASE LINE ENVIRONMENTAL CONDITION IDENTIFICATION OF POLLUTION SOURCE EVALUATION OF POLLUTION CONTROL AND ENVIRONMENTAL 54 MANAGEMENT SYSTEM EVALUATION OF IMPACT PREPARATION OF ENVIRONMENTAL MANAGEMENT PLAN STRUCTURE OF REPORT 55 Prepared By: Aqua-Air Environmental Engineers Pvt. Ltd., Surat 3
4 2 CHAPTER 2: PROJECT DESCRIPTION AND INFRASTRUCTURAL FACILITIES 2.1 BACKGROUND MANUFACTURING ACTIVITIES INFRASTRUCTURE FACILITIES LAND TRANSPORTATION FACILITIES WATER AND WASTEWATER AIR POLLUTION AND CONTROL SYSTEM NOISE LEVEL AND CONTROL SYSTEM HAZARDOUS AND SOILD WASTE GENERATIONS AND DISPOSAL SYSTEM DETAILS OF UTILITIES ELECTRICITY REQUIREMENT & FUEL REQUIREMENT LIST OF MACHINERY AND EQUIPMENT PHASE WISE PROJECT IMPLEMENTATION SCHEDULE WITH BAR CHART AND TIME FRAME, IN TERMS OF SITE DEVELOPMENT, INFRASTRUCTURE PROVISION, EMS IMPLEMENTATION ETC. 2.8 PLANS FOR MANAGEMENT, COLLECTION AND DISPOSAL OF WASTE STREAMS TO BE GENERATED FROM SPILLAGE, LEAKAGES,ETC. MEASURES PROPOSED FOR PREVENTING EFFLUENT DISCHARGE DURING UNFORESEEN CIRCUMSTANCES CHAPTER 3: BASELINE ENVIRONMENTAL STATUS 3.1 MICRO-METEOROLOGY OF THE AREA TEMPERATURE DETAILS RELATIVE HUMIDITY (RH) RAINFALL WIND SPEED AIR ENVIRONMENT DESIGN OF NETWORK FOR AMBIENT AIR QUALITY MONITORING 85 LOCATIONS METHODOLOGY FOR AMBIENT AIR QUALITY MONITORING SUMMARY NOISE ENVIRONMENT 90 Prepared By: Aqua-Air Environmental Engineers Pvt. Ltd., Surat 4
5 3.3.1 METHODOLOGY FOR NOISE MONITORING WATER ENVIRONMENT RECONNAISSANCE METHODOLOGY FOR WATER QUALITY MONITORING SUMMARY LAND ENVIRONMENT METHODOLOGY FOR SOIL MONITORING SUMMARY SOIL CLASSIFICATIONS GEOLOGICAL DATA METHOD OF PREPARATION DESCRIPTION OF GEOLOGICAL CLASSIFICATION AND AREA UNDER 107 DIFFERENT FORMATIONS GEOLOGICAL MAP LAND USE PATTERN METHOD OF DATA PREPARATION ECOLOGICAL INFORMATION INTRODUCTION PHYSIOGRAPHY FOREST FLORA FAUNA SOCIO-ECONOMIC ENVIRONMENT SETTLEMENTS AND DEMOGRAPHIC PATTERN OCCUPATIONAL STRUCTURE AMENITIES GROUND WATER HYDROLOGY DRAINAGE PATTERN CHAPTER 4: ANTICIPATED ENVIRONMENTAL IMPACTS & MITIGATION MEASURES 4.1 IDENTIFICATION OF IMPACTS 134 Prepared By: Aqua-Air Environmental Engineers Pvt. Ltd., Surat 5
6 4.2 PREDICTIONS AND EVALUATION OF IMPACTS WATER ENVIRONMENT AIR ENVIRONMENT NOISE ENVIRONMENT LAND USE AND SOIL QUALITY INFRASTRUCTURE AND SERVICES ENVIRONMENTAL HAZARDS HOUSING ECOLOGY MATRIX REPRESENTATION CUMULATIVE IMPACT CHART CHAPTER 5: ANALYSIS OF ALTERNATIVES 5.1 ANALYSIS OF ALTERNATIVES ENVIRONMENTAL MONITORING PROGRAM 6.1 PROJECT ENVIRONMENT MONITORING PLAN LABORATORY FACILITIES DOCUMETATION & RECORDS POST PROJECT MONITORING PLAN MONITORING METHODOLOGIES ENVIRONMENT POLICY ENVIRONMENTAL MANAGEMENT CELL COMPANY HAS A SYSTEM OF REPORTING OF NON COMPLIANCES / VIOLATIONS OF ENVIRONMENTAL NORMS TO THE BOARD OF DIRECTORS OF THE COMPANY AND / OR SHAREHOLDERS OR STAKEHOLDERS AT LARGE. 6.7 SYSTEM OF REPORTING OF NON COMPLIANCES / VIOLATIONS OF ENVIRONMENTAL NORMS TO THE BOARD OF DIRECTORS OF THE COMPANY AND / OR SHAREHOLDERS OR STAKEHOLDERS AT LARGE CHAPTER 7: RISK ASSESSMENT & DMP Prepared By: Aqua-Air Environmental Engineers Pvt. Ltd., Surat 6
7 7.1 RISK ASSESSMENT INTRODUCTION APPROACH TO THE STUDY METHODOLOGY HAZARD IDENTIFICATION SAFETY PRECAUTIONS PRECAUTIONS DURING STORAGE AND TRANSPORTATION OF 188 HAZARDOUS CHEMICALS LIQUIDS 7.4 HAZARD IDENTIFICATION CONSEQUENCE ANALYSIS ON SITE EMMERGENCY PLAN DETAILS OF THE SEPARATE ISOLATED STORAGE AREA FOR FLAMMABLE 232 CHEMICALS 7.8 OCCUPATIONAL HEALTH AND HAZARD AND SAFETY MEASURES LEAK DETECTION AND REPAIR PROGRAM DO S & DON TS OF PREVENTIVE MAINTENANCE, STRENGTHENING OF 260 HSE, MANUFACTURING UTILITY STAFF FOR SAFETY RELATED MEASURES 7.11 DETAILS ON VARIOUS SOP TO BE PREPARED PROCESS SAFETY DETAILS ON WORKERS TRAINING BEFORE ENGAGING WORK, PERIODICAL, IN-HOUSE, OUTSIDE ETC CHAPTER 8: PROJECT BENIFIT 8.1 BACKGROUND ENVIRONMENT EXPORT EMPLOYMENT GENERATION SOCIO-ECONOMIC DEVELOPMENT ACTIVITIES CHAPTER 9: ENVIRONMENTAL COST BENIFIT 9.1 ENVIRONMENTAL COST BENEFIT ANALYSIS 273 Prepared By: Aqua-Air Environmental Engineers Pvt. Ltd., Surat 7
8 10 CHAPTER 10: ENVIRONMENTAL MANAGEMENT PLAN 10.1 BACKGROUND OBJECTIVES OF ENVIRONMENTAL MANAGEMENT PLAN ENVIRONMENTAL MANAGEMENT CELL ENVIRONMENTAL MANAGEMENT PLAN WATER ENVIRONMENT AIR ENVIRONMENT NOISE ENVIRONMENT LAND ENVIRONMENT IDENTIFICATION OF RECYCLE/REUSE, CLEANER PRODUCTION AND CO- 291 PROCESSING OPTION OF HAZARDOUS WASTE 10.6 GREEN BELT DEVELOPMENT MEASURES FOR CONSERVATION OF ENERGY SKILLED AND TRAINED MANPOWER CAPITAL COST FOR ENVIRONMENTAL MANGEMENT CHAPTER 11: EXECUTIVE SUMMARY OF PROJECT 11.1 PROJECT DESCRIPTION/ BACKGROUND PRODUCT AND CAPACITY DESCRIPTION OF THE ENVIRONMENT WATER REQUIREMENT, WASTE WATER GENERATION AND TREATMENT AIR POLLUTION SOURCE AND CONTROL MANAGEMENT HAZARDOUS WASTE GREEN BELT POWER REQUIREMENTS & FUEL REQUIREMENT DETAILS OF HAZARDOUS CHEMICALS STORAGE CAPITAL AND RECURRING COST EARMARKED FOR ENVIRONMENTAL 300 PROTECTION MEASURES CONCLUSION CHAPTER 12: DISCLOSURE OF CONSULTANTS ENGAGED 302 Prepared By: Aqua-Air Environmental Engineers Pvt. Ltd., Surat 8
9 LIST OF TABLES TABLE NO. TITLE PAGE NO. 1.1 BREAK UP OF PROJECT COST LAND BREAKUP LIST OF PRODUCTS ALONGWITH PRODUCTION CAPACITY LIST OF RAW MATERIAL & ITS CONSUMPTION DISTANCE OF NEAREST KEY INFRASTRUCTURE FEATURES FROM 51 PROJECT SITE 2.1 WATER CONSUMPTION & WASTE WATER GENERATION HAZARDOUS & SOILD WASTE GENERATION QUANTITY, PHYSICAL 74 CHARACTERISTICS AND MODE OF DISPOSAL 2.3 LIST OF MACHINERY AND EQUIPMENT TEMPERATURE DETAILS RELATIVE HUMIDITY DETAILS RAINFALL DETAILS WIND SPEED DETAILS SITE SPECIFIC METEOROLOGICAL DATA DETAILS OF AMBIENT AIR QUALITY MONITORING LOCATIONS AMBIENT AIR QUALITY STATUS DETAILS OF AMBIENT NOISE QUALITY MONITORING LOCATIONS BACKGROUND NOISE LEVELS NOISE LEVELS DUE TO TRANSPORTATION INDUSTRIAL NOISE LEVELS SAMPLING LOCATIONS FOR MONITORING SURFACE WATER AND 94 GROUND WATER QUALITY 3.13 WATER QUALITY- PHYSICAL PARAMETERS SAMPLING LOCATIONS: SOIL QUALITY PHYSICO-CHEMICAL CHARACTERISTICS OF SOIL SOIL CHARACTERISTICS UNDER PROJECT AREA GEOLOGICAL FEATURES AREAS UNDER DIFFERENT LANDUSE 111 Prepared By: Aqua-Air Environmental Engineers Pvt. Ltd., Surat 9
10 3.19 FLORA COMMON FLORA IN BHARUCH AREA FAUNA DEMOGRAPHIC DATA POPULATION DENSITY LITERACY RATE OCCUPATIONAL STRUCTURE DETAILS OF AMENITIES AVAILABLE IN THE STUDY AREA ABBREVIATIONS DETAILS OF EMISSION FROM STACKS SUMMARY OF ISCST3 MODEL OUTPUT PREDICTED AMBIENT AIR QUALITY IMPACT IDENTIFICATION MATRIX CONSTRUCTION & OPERATION STAGE POTENTIAL IMPACTS & 163 MITIGATIVE MEASURES 4.6 ENVIRONMENTAL IMPACT MATRIX CUMULATIVE IMPACT CHART PROJECT ENVIRONMENT MONITORING PLAN STORAGE AND HANDLING DETAILS OF HAZARDOUS CHEMICALS OTHER HAZARDS AND CONTROL ENVIRONMENT MANAGEMENT PLAN LIST OF PRODUCT ALONG WITH PRODUCTION CAPACITY 296 Prepared By: Aqua-Air Environmental Engineers Pvt. Ltd., Surat 10
11 LIST OF FIGURES FIGURE TITLE PAGE NO. NO. 1.1 LOCATION OF THE PROJECT SITE PLANT LAYOUT TOPOSHEET PHOTOGRAPHS OF PLANT KEY INFRASTRUCTURE FEATURES AND SETTLEMENTS ACTIVITIES, SOURCES OF INFORMATION AND CONTENTS OF EIA 56 REPORT 3.1 WIND ROSE DIAGRAM STABILITY CLASS DISTRIBUTION LOCATION OF AMBIENT AIR QUALITY MONITORING STATIONS LOCATION OF NOISE LEVEL MONITORING STATIONS LOCATIONS OF WATER SAMPLING STATIONS LOCATIONS OF SOIL SAMPLING STATIONS SOIL CHARACTERISTICS MAP MAJOR GEOLOGICAL FEATURES LAND USE/ LAND COVER LANDUSE / LANDCOVER WITH VILLAGE LOCATIONS POPULATION DENSITY LITERACY DATA DRAINAGE PATTERN IMPACT NETWORK ISOPLETHS ORGANOGRAM OF ENVIRONMENT MANAGEMENT CELL QRA METHODOLOGY FLOW CHART FOR QUANTITATIVE RISK ASSESSMENT HAZARDOUS CHEMICAL STORAGE AREA ORGANOGRAM OF ENVIRONMENT MANAGEMENT CELL 277 Prepared By: Aqua-Air Environmental Engineers Pvt. Ltd., Surat 11
12 COPY OF TORs FROM MoEFCC, NEW DELHI Prepared By: Aqua-Air Environmental Engineers Pvt. Ltd., Surat 12

13 Prepared By: Aqua-Air Environmental Engineers Pvt. Ltd., Surat 13

14 Prepared By: Aqua-Air Environmental Engineers Pvt. Ltd., Surat 14

15 Prepared By: Aqua-Air Environmental Engineers Pvt. Ltd., Surat 15

16 Prepared By: Aqua-Air Environmental Engineers Pvt. Ltd., Surat 16

17 Prepared By: Aqua-Air Environmental Engineers Pvt. Ltd., Surat 17

18 Prepared By: Aqua-Air Environmental Engineers Pvt. Ltd., Surat 18
19 Sr. No. COMPLIANCE OF TERMS OF REFERENCES (TORs) SEAC, GANDHINAGAR TOR Point Compliance Status 1 A tabular chart with index for point-wise compliance of below mentioned TORs. 2 Executive summary of the project giving a prima facie idea of the objectives of the proposal, use of resources, justification, etc. In addition, it should provide a compilation of EIA report, including EMP and the post-project monitoring plan in brief. 3 Justification for selecting the proposed product and unit size. 4 Land requirement for the project including its break up for various purposes, its availability and optimization. 5 Land possession documents. Copy of NA order showing permission to use the project land for industrial purpose. If located in GIDC, copy of plot holding certificate obtained from GIDC Authority. 6 Location of the project site and nearest habitats with distances from the project site to be demarcated on a toposheet (1: scale). Given below Please refer Chapter-11 in EIA Report. Justification of project is referred as Section-1.1.1, Chapter-1 in EIA Report (Page No. 42) Land requirement for the project including its break up for various purposes is referred as Table-1.2, Section- 1.1, Chapter-2 in EIA Report (Page No. 43). Land possession documents. Copy of NA order showing permission to use the project land for industrial purpose. If located in GIDC, copy of plot holding certificate obtained from GIDC Authority is referred as Annexure 6 in EIA Report (Page No. 345). Location of the project site and plant layout is referred as Figure-1.1, Section- 1.1, Chapter-1 in EIA Report (Page No. 44). Prepared By: Aqua-Air Environmental Engineers Pvt. Ltd., Surat 19
20 7 Topography details of the project area. Topography details is referred as Section , Chapter-3 in EIA Report (Page No. 113). 8 Geological features and geo-hydrological status of the study area. 9 In case of project located outside notified area: Legal Undertaking stating that unit is complying the three conditions [i.e. water consumption less than 25 M3/day; Fuel consumption less than 25 TPD; and not covered in the category of MAH units as per the Management, Storage, Import of Hazardous Chemical Rules (MSIHC Rules), 1989] as per the amendment to EIA Notification, 2006 vide SO 1599 (E) dated 25/06/ Present land use pattern of the study area shall be given based on satellite imagery. 11 Layout plan of the factory premises clearly demarcating various units within the plant. Provision of separate entry & exit and adequate margin all-round the periphery for unobstructed easy movement of the emergency vehicle / fire tenders without reversing back. Mark the same in the plant layout. 12 Technical details of the plant/s along with details on best available technologies (BAT), proposed technology and reasons for selecting the same. Geological features is referred as Section- 3.6 and geo-hydrological status is referred as Section-3.9.4, Chapter-3 in EIA Report (Page No. 106 & 129). Proposed Project is located in notified industrial area of GIDC Panoli. Land use pattern of the study area is referred as Section-3.7, Chapter-3 in EIA Report (Page No.109). Layout plan of the factory premises is referred as Figure-1.2, Section-1.1, Chapter-1 in EIA Report (Page No. 45). Technical details of the plant/s is referred as Section 2.6,Chapter-2 (Page No 76) along with details on best available technologies (BAT) is referred as Chapter- Prepared By: Aqua-Air Environmental Engineers Pvt. Ltd., Surat 20
21 5 in EIA Report (Page No. 167). 13 Product spectrum (Proposed products along with production Capacity) and processes. 14 Chemical name of each proposed product to be manufactured. Details on end use of each product. (Provide CAS number of all the products & raw materials. In case of Dyes, CI number). 15 Details on raw materials, source and storage within the premises. 16 Details of complete manufacturing process / operations of each product along with chemical reactions, process flow diagram describing each unit processes and unit operations along with material balance, consumption of raw materials etc. 17 Details on strategy for the implementation of cleaner production activities. 18 Assessment of source of the water supply with adequacy of the same to meet with the requirements for the project. Permission obtained from the concern authority for supply of raw water. 19 Undertaking stating that no bore well shall be dug within the premises (If project is located within the Industrial estate). Product spectrum is referred as Section- 1.1, Table 1.3 Chapter-1 in EIA Report (Page No. 49). Chemical name of each proposed product to be manufactured and details on end use of each product is referred as Section- 1.1, Chapter-1 in EIA Report (Page No. 49). Details on raw materials is referred as Section-1.1, Chapter-1 in EIA Report (Page No. 49). Manufacturing process / operations of each product is referred as Section-2.2, Chapter-2 in EIA Report (Page No. 57 to 66). Details on strategy for the implementation of cleaner production activities is referred as Section-10.5, Chapter-10 in EIA Report (Page No. 240). Source GIDC Water Supply Permission obtained from the concern authority for supply of raw water is referred as Annexure 14 in EIA Report (Page No. 345). Undertaking stating that no bore well shall be dug within the premises is referred as Annexure 12 in EIA Report Prepared By: Aqua-Air Environmental Engineers Pvt. Ltd., Surat 21
22 (Page No. 61). 20 Details on water balance including quantity of effluent generated, recycled & reused. Details of methods to be adopted for the water conservation. 21 Explore the possibilities for Zero Liquid Discharge (ZLD) or Efforts to minimize effluent discharge and to maintain quality of receiving water body. 22 Segregation of waste streams, characterization and quality with specific treatment and disposal of each stream including action plan for maximum recycle of treated waste water and minimum discharge for effluent. 23 Capacity of ETP in KL/day. Details of ETP including dimensions of each unit along with schematic flow diagram. Inlet, transitional and treated effluent qualities with specific efficiency of each treatment unit in reduction in respect of all concerned/regulated environmental parameters. Inlet effluent quality should be based on worst case scenario considering production of most polluting products that can be manufactured in the plant concurrently. Water Balance Diagram is referred in Section-2.3.3, Chapter-2 in EIA Report (Page No. 69). Total water requirement will be 968 Kl/day which is met through GIDC water supply. The waste water generations will 75KL/day. The 75KL/day effluent will be treated in ETP consists of primary treatment then it will be sent land irrigation or cooling tower. Domestic Waste water (15 KLD) will be disposed by septic tank & soak pit system Segregation of waste streams is referred in Section-2.3.3, Chapter-2 in EIA Report (Page No. 69). Capacity of ETP is referred as Section , Chapter-2 in EIA Report (Page No. 70). Prepared By: Aqua-Air Environmental Engineers Pvt. Ltd., Surat 22
23 24 In case of discharge into GIDC drainage / Pipeline: III. Copy of permission letter with quantity (KL/day) from the concern authority of drainage network / pipeline with confirmation for spare capacity available to take additional effluent. IV. Characteristics of the combined effluent and treated water to be sent to Common pipeline with reference to the MoEFCC/CPCB/GPCB discharge norms. 25 In case of waste water sent to Common Facilities (CF) like CETP, MEE, Spray Dryer etc. Details of Common facilities including (1) Total capacity of the CF Company will not discharge the effluent into pipeline/cetp, so it is not Applicable. Company will sent the treated effluent for land irrigation or cooling tower. Not Applicable (2) Copy of CC&A of the CF. (3) Actual load at present (Qualitative and Quantitative KL per day) (4) Booked quantity & Spare capacity of CF (5) Copies of XGN generated Inspection reports with analysis reports of the water/air/hazardous Prepared By: Aqua-Air Environmental Engineers Pvt. Ltd., Surat 23
24 samples collected by GPCB (Last 2 year). Copies of instructions issued by GPCB in last 2 years and point wise compliance thereof. (6) Copies of Show- cause notices, closure notices etc. served by the GPCB and its compliance (7) Recommendations and suggestions of the last two Environment Audit reports of CETP and its compliance report. (8) Common Facility Up gradation scheme, if any. 26 In case of Zero Liquid Discharge (ZLD) : i. Action plan for Zero discharge of effluent shall be included. Notarized undertaking for assuring that underground drainage connection will not be taken in the unit ii. Economical and technical viability of the effluent treatment system to achieve Zero Liquid Discharge (ZLD). iii. Certification of adequacy of proposed ZLD scheme through credible institutes of National repute. iv. To estimate & monitor ground water quality & its contamination status, piezometer wells, one on up gradient of the groundwater flow and other three on the down gradient side of the ground water flow of the proposed project at different depth based on available ground water depth shall be established and all the parameters mentioned in IS 10:500 for potable water standard shall be monitored. Action plan for Zero discharge of effluent is referred in Section-2.3.3, Chapter-2 in EIA Report (Page No. 67). Economical and technical viability of the effluent treatment system to achieve Zero Liquid Discharge Company will sent the treated effluent for land irrigation or cooling tower. Ground water quality is referred in Table- 3.13, Chapter-3 in EIA Report (Page No. 96). Prepared By: Aqua-Air Environmental Engineers Pvt. Ltd., Surat 24
25 27 In case of in-house MEE/Spray dryer for waste water treatment: Capacity of MEE/Spray dryer in KL/hr. Technical details of MEE including evaporation capacity, steam required for evaporation, adequacy of the proposed boiler to supply steam for evaporation in addition to the steam required for the process etc. Technoeconomical viability of the evaporation system. Control measures proposed for the evaporation system in order to avoid/reduce gaseous emission/voc from evaporation of industrial effluent containing solvents & other chemicals. 28 Technical details of ATFD/Crystallizer/ spray Dryer, RO/NF system etc. (If any). 29 Undertaking stating that a separate electric meter will be provided for the waste water treatment system viz. ETP, RO, MEE, Spray dryer etc. (Whichever is applicable) 30 Economical and technical viability of the effluent treatment system. 31 Plans for management, collection and disposal of waste streams to be generated from spillage, leakages, vessel washing, used container washing etc. Measures proposed for preventing effluent discharge during unforeseen circumstances. In case of in-house MEE/Spray dryer for waste water treatment: Capacity of MEE/Spray dryer in KL/hr. Technical details of MEE including evaporation capacity, steam required for evaporation, adequacy of the proposed boiler to supply steam for evaporation in addition to the steam required for the process etc. Techno-economical viability of the evaporation system is referred as Section , Chapter-2 in EIA Report (Page No. 73). Not Applicable. Undertaking stating that a separate electric meter will be provided for the waste water treatment system is referred in Annexure 13 in EIA Report (Page No. 344). Economical and technical viability of treatment of effluent is referred as Section , Chapter-2 in EIA Report (Page No. 73). Plans for management, collection and disposal of waste streams to be generated from spillage, leakages, vessel washing, used container washing etc. is referred as Section-2.8, Chapter-2 in EIA Report (Page No. 76). 32 Action plan for reuse of liquid waste streams like Not Applicable Prepared By: Aqua-Air Environmental Engineers Pvt. Ltd., Surat 25
26 Spent acids, Poly Aluminium Chloride etc. within premises to convert into valuable products instead of sending outside to actual end-users. 33 One season Site-specific micro-meteorological data using temperature, relative humidity, hourly wind speed and direction and rainfall should be incorporated. 34 Anticipated environmental impacts due to the proposed project/production may be evaluated for significance and based on corresponding likely impacts VECs (Valued Environmental Components) may be identified. Baseline studies may be conducted within the study area for all the concerned/identified VECs and likely impacts will have to be assessed for their magnitude in order to identify mitigation measures. 35 One complete season base line ambient air quality data (except monsoon season) to be given along with the dates of monitoring. The parameters to be covered shall be in accordance with the revised National Ambient Air Quality Standards (NAAQS) as well as project specific parameters like NH3, HCl, CL2, HBr, VOC etc. Locations of the monitoring stations should be so decided so as to take into consideration the predominant downwind direction, population zone and sensitive receptors. There should be at least one monitoring station in the upwind direction. There should be at least one monitoring station in Site-specific micro-meteorological data is referred as Table-3.5, Chapter-3 in EIA Report (Page No. 82). Anticipated environmental impacts due to the proposed project/production evaluated for significance and based on corresponding likely impacts VECs (Valued Environmental Components) is referred in Table-4.5, Section-4.3.1, Chapter-4 in EIA Report (Page No. 163). Ambient air quality data is referred in Table-3.7, Section-3.2.2, Chapter-3 in EIA Report (Page No. 87). Prepared By: Aqua-Air Environmental Engineers Pvt. Ltd., Surat 26
27 the pre-dominant downwind direction at a location where maximum ground level concentration is likely to occur. 36 Modeling indicating the likely impact on ambient air quality due to proposed activities. The details of model used, and input parameters used for modeling should be provided. The air quality contours may be shown on location map clearly indicating the location of sensitive receptors, if any, and the habitation. The wind rose showing pre-dominant wind direction should also be indicated on the map. Impact due to vehicular movement shall also be included into the prediction using suitable model. Results of Air dispersion modeling should be superimposed on satellite Image / geographical area map. 37 Base line status of the noise environment, impact of noise on present environment due to the project and proposed measures for noise reduction including engineering controls. 38 Specific details of i) Process gas emission from each unit process with its quantification. ii) Air pollution Control Measures (APCM) proposed for process gas emission. Adequacy of the air pollution control measures (APCM) for process gas emission measures to achieve the GPCB norms. iii) Details of the utilities required. iv) Type and quantity (MT/hr & MT/Day) of fuel to Details of the model used and the input data used for modeling is referred in Section and air quality contours plotted on a location map showing the location of project site, habitation nearby, is referred in Figure-4.2, Chapter-4 in EIA Report (Page No. 134 to 166). Base line status of the noise environment is referred as Section-3.3, Chapter-3 in EIA Report (Page No. 90). Refer Section-2.3.4, Chapter 2 (Page No. 73) Refer Section-2.3.4, Chapter 2 (Page No. 73) -- Refer Section-2.4, Chapter 2 (Page No. 75) Refer Section-2.3.4, Chapter 2 (Page No. Prepared By: Aqua-Air Environmental Engineers Pvt. Ltd., Surat 27
28 be used for each utility. v) Flue gas emission rate emission from each utility. vi) Air Pollution Control Measures (APCM) proposed to each of the utility along with its adequacy vii) List the project specific sources of fugitive emission along with its quantification and proposed measures to control it. viii) Details on tail gas treatment. (If any) 73) Refer Section-2.3.4, Chapter 2 (Page No. 73) Refer Section-2.3.4, Chapter 2 (Page No. 73) -- Refer Section-2.3.4, Chapter 2 (Page No. 73) Not Applicable 39 Action plan for Odour control to be submitted. Not Applicable 40 Management plan for solid/hazardous waste including storage, handling, utilization and safe disposal as per the Hazardous and Other Wastes (Management and Transboundary Movement) Rules CPCB guidelines in respect of specific treatment, such as solar evaporation, incineration, etc., need to be followed. How the manual handling of the hazardous wastes will be minimized. Methodology of de-contamination and disposal of discarded containers and its record keeping. 41 Membership of Common Environmental Infrastructure like TSDF, Common Incineration Facility (CHWIF), MEE, Spray dryer etc. 42 Name and quantity of each type of solvents to be used for proposed production. Details of in-house Management plan for solid/hazardous waste including storage, handling, utilization and safe disposal as per the Hazardous and Other Wastes (Management and Transboundary Movement) Rules 2016 and Methodology of de-contamination and disposal of discarded containers and its record keeping is referred as Section and Section , Chapter- 10 in EIA Report (Page No. 288 to 290). Membership of Common Environmental Infrastructure like TSDF, Common Incineration Facility (CHWIF), Spray dryer is referred as Annexure 9 in EIA Report (Page No. 330). Not Applicable Prepared By: Aqua-Air Environmental Engineers Pvt. Ltd., Surat 28
29 solvent recovery system including mass balance, solvent loss, recovery efficiency (% recovery), feasibility of reusing the recovered solvents etc. for each type of solvent. 43 Appropriate monitoring network has to be designed and proposed, to assess the possible residual impacts on VECs. 44 A detailed EMP including the protection and mitigation measures for impact on human health and environment as well as detailed monitoring plan and environmental management cell proposed for implementation and monitoring of EMP. The EMP should also include the concept of waste-minimization, recycle/reuse/recover techniques, energy conservation, and natural resource conservation. Total capital cost and recurring cost/annum earmarked for environment pollution control measures. 45 Details of in-house monitoring capabilities and the recognized agencies if proposed for conducting monitoring. 46 Permission from PESO, Nagpur for storage of solvents, other toxic chemicals, if any. 47 Occupational health impacts on the workers and mitigation measures proposed to avoid the human health hazards along with the personal protective equipment to be provided. Provision of industrial hygienist and monitoring of the occupational injury to workers as well as impact on the workers. Plan for periodic medical checkup Appropriate monitoring network is referred in Table-6.1, Section-6.3, Chapter-6 in EIA Report (Page No. 170) Detailed EMP is referred as Table-10.1, Chapter-10 in EIA Report (Page No. 278) and detailed monitoring plan is referred as Table-6.1, Section-6.3, Chapter-6 in EIA Report (Page No. 170). Energy conservation is referred as Section-10.7, total capital cost and recurring cost/annum earmarked for environment pollution control measures is referred as Section-10.9, Chapter-10 in EIA Report (Page No.295). Details of in-house monitoring is referred as Table-6.1, Section-6.3, Chapter-6 in EIA Report (Page No. 170). Not applicable Occupational health and safety is referred as Section-7.8, Chapter-7 in EIA Report (Page No. 235 to 256). Prepared By: Aqua-Air Environmental Engineers Pvt. Ltd., Surat 29
30 of the workers exposed. Details of work place ambient air quality monitoring plan as per Gujarat Factories Rules. 48 Details on volatile organic compounds (VOCs) from the plant operations and occupational safety and health protection measures. Proposal for Leak Detection and Repair (LDAR) program as per the CPCB guidelines. 49 Risk assessment including prediction of the worstcase scenario and maximum credible accident scenarios should be carried out. The worst-case scenario should take into account the maximum inventory of storage at site at any point of time. The risk contours should be plotted on the plant layout map clearly showing which of the facilities would be affected in case of an accident taking place. Based on the same, proposed safeguard measures including On- Site / Off-Site Emergency Plan should be provided. Leak Detection and Repair (LDAR) program is referred as Section-7.9, Chapter-7 in EIA Report (Page No. 257). Risk assessment including prediction of the worst-case scenario and maximum credible accident scenarios is referred as Section , Chapter-7 in EIA Report (Page No. 200 ). 50 MSDS of all the products and raw materials. Not applicable 51 Details of hazardous characteristics and toxicity of raw materials and products to be handled. This shall include the details of Antidotes also. 52 Details of quantity of each hazardous chemical (including solvents) to be stored, Material of Construction (MoC) of major hazardous chemical storage tanks, dyke details, threshold storage quantity as per schedules of the Manufacture, Details of hazardous characteristics and toxicity of raw materials and products is referred as Table-7.3, Section , Chapter-7 in EIA Report (Page No. 166). Details of quantity of each hazardous chemical (including solvents) to be stored is referred in Table-7.1, Section , Chapter-7 in EIA Report (Page No. 183). Prepared By: Aqua-Air Environmental Engineers Pvt. Ltd., Surat 30
31 Storage & Import of Hazardous Chemicals Rules of major hazardous chemicals, size of the biggest storage tank to be provided for each raw material & product etc. How the manual handling of the hazardous chemicals will be minimized? 53 Details of the separate isolated storage area for flammable chemicals. Details of flame proof electrical fittings, DCP extinguishers and other safety measures proposed. Detailed fire control plan for flammable substances and processes showing hydrant pipeline network, provision of DG Sets, fire pumps, jockey pump, toxic gas detectors etc. 54 Submit checklist in the form of Do s & Don ts of preventive maintenance, strengthening of HSE, manufacturing utility staff for safety related measures. 55 Detailed five-year greenbelt development program including annual budget, planning schedule, species, width of plantations, number of trees to be planted, area under green belt development [with map], budgetary outlay etc. along with commitment of the management to carry out the tree plantation activities outside the premises at appropriate places in the nearby areas and elsewhere. 56 Action plan for the greenbelt development species, width of plantations, planning schedule, etc., in accordance to CPCB published guidelines. Fire control arrangement is referred as Section-7.7, Chapter-7 in EIA Report (Page No. 232). Do s & Don ts is referred as Section-7.10, Chapter-7 in EIA Report (Page No. 260). Greenbelt development program is referred as Section-10.6, Chapter-10 in EIA Report (Page No. 291 to 293) Greenbelt development is referred as Section-10.6, Chapter-10 in EIA Report (Page No. 291 to 293) 57 Detailed socio-economic development measures Socio-economic development measures is Prepared By: Aqua-Air Environmental Engineers Pvt. Ltd., Surat 31
32 including community welfare program most useful in the project area for the overall improvement of the environment. Submit a detailed plan for social corporate responsibilities, with appropriate budgetary provisions for the next five years and activities proposed to be carried out; specific to the current demographic status of the area. 58 (a) Does the company have a well laid down Environment Policy approved by its Board of Directors? If so, it may be detailed in the EIA report. (b). Does the Environment Policy prescribe for standard operating process / procedures to bring into focus any infringement / deviation / violation of the environmental or forest norms / conditions? If so, it may be detailed in the EIA. 59 What is the hierarchical system or administrative order of the company to deal with the environmental issues and for ensuring compliance with the EC conditions? Details of this system may be given. 60 Does the company have a system of reporting of non-compliances / violations of environmental norms to the Board of Directors of the company and / or shareholders or stakeholders at large? This reporting mechanism should be detailed in the EIA Report. 61 Phase wise project implementation schedule with bar chart and time frame, in terms of site referred as Section-8.5, Chapter-8 in EIA Report (Page No ) Environment Policy is referred as Section- 6.4, Chapter-6 in EIA Report (Page No. 172) Environment Policy is referred as Section- 6.4, Chapter-6 in EIA Report (Page No. 172) Hierarchical system of the company to deal with the environmental issues is referred in Figure-6.1, Section-6.5, Chapter-6 in EIA Report (Page No. 174) System of reporting of non compliances / violations of environmental norms to the Board of Directors is referred as Section- 6.7, Chapter-6 in EIA Report (Page No. 177) Phase wise project implementation schedule is referred as Section-2.7, Prepared By: Aqua-Air Environmental Engineers Pvt. Ltd., Surat 32
33 development, infrastructure provision, EMS implementation etc. 62 Certificate of accreditation issued by the NABET, QCI to the environmental consultant should be incorporated in the EIA Report. 63 An undertaking by the Project Proponent on the ownership of the EIA report as per the MoEF&CC OM dated 05/10/2011 and an undertaking by the Consultant regarding the prescribed TORs have been complied with and the data submitted is factually correct as per the MoEF&CC OM dated 04/08/ In case of Expansion of the project 1. Need for the proposed expansion should be justified in detail. 2. Adequacy of existing EMS (Environmental Management System). 3. Records of any legal breach of Environmental laws i.e. details of show- cause notices, closure notices etc. served by the GPCB to the existing unit in last five years and actions taken then after Chapter-2 in EIA Report (Page No. 76) Refer Annexure 11 in EIA Report Refer Index, Page 36 to This is expansion project and expansion will be done in existing premise, however the demand for products intended to be manufacture is increasing for local as well as Global market. By expanding this unit, M/s. Prafful Overseas Pvt. Ltd will be able to meet the demand of various products. The project will generate forex through exporting products. This will also generate direct and indirect employment opportunity for various levels of people. 2 Refer Annexure 16(Pg no 356) 3. No show- cause notices, closure notices etc. served by the GPCB to the existing unit in last five years. Prepared By: Aqua-Air Environmental Engineers Pvt. Ltd., Surat 33
34 for prevention of pollution. 4. Copies of Environmental Clearances obtained for the existing plant, its point wise compliance report. 5. Environmental audit reports for last 3 years and compliance of its recommendations/suggestions. (Include latest audit report and its compliance.) 6. Copy of Consent to Operate (CC&A) obtained along with point wise compliance status of all the conditions stipulated therein. 7. Compliance of MoEFCC circulars vide No: J /618/2010-IAII (I) dated 30/05/2012 and J /41/2006-IA-II(I) dated 20/10/ Copies of XGN generated Inspection reports with analysis reports of the water/air/hazardous samples collected by GPCB (Last 2 year). Copies of instructions issued by GPCB in last 2 year and point wise compliance thereof. 65 In case of project is located in Ankleshwar-Panoli, Vatva-Narol & Vapi GIDC. (C) Compliance of MOEFCC s OM no. J /5/2010-IA II (I) dated 25/11/2016 regarding lifting of moratorium on the consideration of projects for environmental clearance. (D) Compliance of direction under section 18 (1) (b) of the Water (Prevention and Control of Pollution) act, 1974 issued by CPCB dated 31/03/2016 regarding compliance of CETP. k) Action initiated by GPCB, if any, against 4. Unit does not have previous environment clearance Refer Annexure 15 (Pg no 346) 7. Unit does not have previous environment clearance. 8. Not received. Project is located in GIDC Panoli Prepared By: Aqua-Air Environmental Engineers Pvt. Ltd., Surat 34
35 proposed unit regarding non-compliance of prescribed standards under the various environmental laws. l) Performance of CETP with respect to current hydraulic load & prescribed standards with No Objection Certificate of CETP regarding incorporation of the proposed unit for acceptance of waste water. m) Performance of TSDF site with respect to current load & prescribed standards with No Objection Certificate of TSDF site regarding incorporation of the proposed unit for acceptance of hazardous waste to the common infrastructure. n) Copies of quarterly action report taken for the above points submitted to the CPCB. o) Report of GPCB which have conducted monitoring as per the said direction by CPCB dated 31/03/2016. Since the proposed effluent will be sent to common MEE Facility, this condition is not applicable. TSDF Site: BEIL-Ankleshwar Prepared By: Aqua-Air Environmental Engineers Pvt. Ltd., Surat 35
36 UNDERTAKING BY PROJECT PROPONENT September 5, 2018 UNDERTAKING We M/s. Prafful Overseas Pvt. Ltd., own this EIA Report for Proposed Manmade fibres Manufacturing unit at Plot No. 9C, GIDC Estate, Panoli , Ankleshwar, Dist: Bharuch, Gujarat. Prepared By: Aqua-Air Environmental Engineers Pvt. Ltd., Surat 36

37 Declaration by Experts Contributing to the EIA Report of M/s. Prafful Overseas Pvt. Ltd. Plot No. 9C, GIDC Estate, Panoli, Tal: Ankleshwar, District: Bharuch , Gujarat. EIA COORDINATOR Name Signature Mr. Chetan R. Kabariya Prepared By: Aqua-Air Environmental Engineers Pvt. Ltd., Surat 37

38 Prepared By: Aqua-Air Environmental Engineers Pvt. Ltd., Surat 38

39 Prepared By: Aqua-Air Environmental Engineers Pvt. Ltd., Surat 39

40 Prepared By: Aqua-Air Environmental Engineers Pvt. Ltd., Surat 40

41 Declaration by Head of the Organization I, Jayesh Patel hereby confirm that the above-mentioned team members were involved in preparation of EIA Report of M/s. Prafful Overseas Pvt. Ltd.I also confirm that I shall be fully accountable for any misleading information mentioned in this statement. Prepared By: Aqua-Air Environmental Engineers Pvt. Ltd., Surat 41
42 1.1 BACKGROUND CHAPTER 1 INTRODUCTION M/s. Prafful Overseas Pvt. Ltd. proposes expansion of manufacturing of Nylon yarn & Polymer Chips at Plot No. 9C, GIDC Estate, Panoli, Tal: Ankleshwar, District: Bharuch , Gujarat JUSTIFICATION OF PROJECT The demand for products intended to be manufacture is increasing in the country. M/s. Prafful Overseas Pvt. Ltd. will be able to meet the demand of various products locally. The project will save forex as certain products import will be reduced. This will also generate direct and indirect employment opportunity for various levels of people PROMOTERS AND THEIR BACK GROUND M/s. Prafful Overseas Pvt. Ltd. is a Private Limited company, having Four Directors. The detail of project proponent is as below: Sr. No. Name of Partners Resi. Address Phone No. 1. Mr. Shree Narain 601 & 701, Dharam Palace-II, (0261) Aggrawal Athawalines, Surat Phone. 2. Mr. Raveesh Aggrawal 601 & 701, Dharam Palace-II, (0261) Athawalines, Surat Phone. 3. Mr. Jai Narain Aggrawal 201 & 301, Dharam Palace-II, (0261) Athawalines, Surat Phone. 4. Mr. Shiv Narain Aggrawal 401 & 501, Dharam Palace-II, (0261) Athawalines, Surat Phone. Prepared By: Aqua-Air Environmental Engineers Pvt. Ltd., Surat 42
43 1.1.3 REGULATORY FRAMEWORK For proposed project; following assumptions has been considered: a. Capacity of Plant 45 MT/Day (Yarn) b. Total working days in a year 325 c. Raw material storage facility for 20 days d. Finished product storage for 20 days e. Solvent Storage facility for 20 days TABLE 1.1 BREAK UP OF PROJECT COST Total capital investment for the proposed project is Rs. 600 crores. Capital cost of air & water pollution control system and environmental monitoring equipments will be Rs. 70 Lakhs. Sr. Particulars Amount (Rs. In Crore) 1 Total Cost of Project Capital cost of air & water pollution control system 6.0 and environmental monitoring equipments 3 Recurring Cost for EMS 45.0 Lakh/Year TABLE 1.2 BREAK UP OF DIFFERENT LAND USE OF FACTORY Sr.No. Land Use Proposed area (Sq. Mt.) 1 Production Plants Parking Security Building Effluent Treatment plant Raw Material and Finished Products Storage Tank Farm Area Green Belt Road Total Prepared By: Aqua-Air Environmental Engineers Pvt. Ltd., Surat 43


44 FIGURE LOCATION OF THE PROJECT SITE PROJECT SITE Location of the project site Prepared By: Aqua-Air Environmental Engineers Pvt. Ltd., Surat 44

45 FIGURE LAYOUT OF THE PLANT Prepared By: Aqua-Air Environmental Engineers Pvt. Ltd., Surat 45

46 FIGURE-1.3 TOPOSHEET Prepared By: Aqua-Air Environmental Engineers Pvt. Ltd., Surat 46


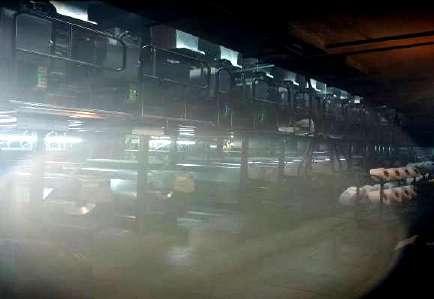


47 FIGURE EXISTING PLANT PHOTOGRAPHS Prepared By: Aqua-Air Environmental Engineers Pvt. Ltd., Surat 47


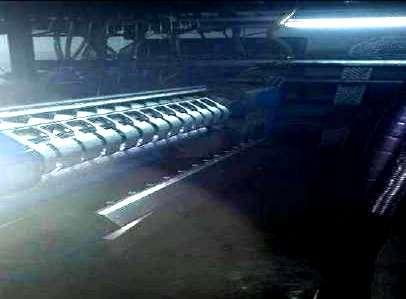


48 Prepared By: Aqua-Air Environmental Engineers Pvt. Ltd., Surat 48
49 TABLE 1.3 LIST OF PRODUCTS ALONG WITH PRODUCTION CAPACITY SR. NO. NAME OF PRODUCTS 1 Woven Grey Cloth 2 Knitted Grey Cloth 3 Captive Power Plant Existing Quality 4,80,000 Meter/Month Total PROPOSED QUANTITY (MT/Month) 4,80,000 Meter/Month End Use To be sold to traders as per existing trade practice To be sold to traders as per existing trade practice 2.83 MW 2.83 MW As stand by emergency use only 4 Yarn To be sold to weavers and knitters via dealers 5 Nylon Chips Captive consumption and balance to be sold to existing spinners TABLE 1.4 List of Raw Material & its consumption Sr. No. Product name Raw Materials 1.2 PROJECT SETTING M/s. Prafful Overseas pvt. ltd. located at longitude 73 0'15.77"E and latitude 21 32'55.43"N. Detailed Layout map of the plant is shown in Figure 1.2. Co-ordinates of Plot: Qty. MT/Month 1 Yarn Nylon Chips 90 2 Nylon Chips Caprolactam 123 Catalyst 0.27 Corner 1: latitude 21 32'53.28"N longitude 73 0'25.46"E Corner 2: latitude 21 32'59.14"N longitude 73 0'26.04"E Corner 3: latitude 21 33'0.74"N longitude 73 0'14.08"E Corner 4: latitude 21 32'54.33"N longitude 73 0'13.04"E Project site, where M/s. Prafful Overseas pvt. ltd.is located, is near Bharuch, Jhagadia and Ankleshwar which are all important industrial and commercial centers of Gujarat and India. Prepared By: Aqua-Air Environmental Engineers Pvt. Ltd., Surat 49
50 The nearest large city is Bharuch, which is about 17 km away. Water for industrial purpose will be available from GIDC water supply. Development of communication systems is good in the region due to proximity to Bharuch and Surat. Sources of water in the region include cannel, river, and ground water resources. Plant is located about 0.33 km away from national highway number 8 joining Delhi - Mumbai and about 2.58 km away from railway route from Ahmedabad - Mumbai. It is about 4.0 km and 8.5 km respectively away from Panoli & Ankleshwar city and 274 km away from the commercial capital of India, Mumbai. Common TSDF and CHWIF of M/s Bharuch Enviro Infrastructure Ltd. and Common Effluent Treatment Plant (CETP) of M/s. Panoli Enviro Technology Ltd. (PETL), Panoli are about 7.9km and about 2.85 km away respectively from the project site. The salient features of the site are as under: 1. Minimum distances: a) From City : Bharuch (around 17 Km away) b) Town : Panoli (around 4 Km away) (Population 4,779 approx.) c) Railway station : Panoli (around 3.8 Km away) d) Historical Site : None e) Sanctuaries : Ratanpur Reserve Forest (27.35 km-north-east) Shoolpaneshwar Wildlife Sanctuary (60 km-easts) f) Highway : National highway No. 8, State Highway No. 76, 64, 13 g) Sea coast : 40 Km (approx.) h) TSDF (BEIL) site : 8.81 Km (approx.) i) FETP (NCTL) location : 7.9 Km (approx.) 2. Use of forest land : None 3. Use of prime agricultural land: None 4. Planned submergence : None 5. Displacement of population : None KEY INFRASTRUCTURE FEATURES AND SETTLEMENTS METHOD OF DATA PREPARATION Key infrastructure features have been extracted from Survey of India (SoI) topographical maps of 1:50,000 scale. The features have been updated using satellite data and have been verified with ancillary information derived from TTK maps and guide maps. The locations of Prepared By: Aqua-Air Environmental Engineers Pvt. Ltd., Surat 50
51 the settlement have been extracted from Census of India (CoI) maps and verified by using SoI topographical maps and satellite data DISTANCE OF NEAREST KEY INFRASTRUCTURE FEATURES FROM PROJECT SITE The distance of railways and National and State highways are presented in Table 1.4 below. TABLE 1.5 DISTANCE OF NEAREST KEY INFRASTRUCTURE FEATURES FROM PROJECT SITE SR. NEAREST INFRASTRUCTURE DISTANCE FROM PROJECT NO. FEATURE SITE 1. Village: Khorad 0.7 Km 2. Surat City 46 Km 3. Western Railway Main Line 2.58 km 4. National Highway NH km 5. State Highway 9.56 km 6. Mahrshee Laboratories Pvt. Ltd Km 7. Kemphar International 1.42 Km 8. Cheminova Ltd. (FMC) 2.8 Km MAP OF KEY INFRASTRUCTURE FEATURES AND SETTLEMENTS A map depicting administrative boundaries up to Taluka level, showing locations of towns and villages along with National and State highways, major and medium roads and railways is presented as Figure 1.4. The map also shows the water bodies for better understanding of project area. The map marks the area within 10 km with the project site as the center. Prepared By: Aqua-Air Environmental Engineers Pvt. Ltd., Surat 51

52 FIGURE 1.5 KEY INFRASTRUCTURE FEATURES AND SETTLEMENTS 1.3 PURPOSE OF EIA The EIA study is carried out to assess the pollution potential and evaluate the adequacy and efficiency of existing and proposed Pollution Control & Environmental Management System. 1.4 OBJECTIVES OF EIA The main objectives of the study are 1) To assess the background environmental status, 2) To identify potential sources of pollution, 3) To predict and evaluate the impact on environment along with pollution control measures taken and 4) To prepare a comprehensive Environment Management Plan and Disaster Management Plan. 1.5 METHODOLOGIES FOR EIA Taking into consideration proposed project activities and guidelines, an area of 10 km radius from the center of the project has been selected and is designated as the study area for the purpose of EIA studies. Prepared By: Aqua-Air Environmental Engineers Pvt. Ltd., Surat 52
53 1.5.1 Base Line Environmental Condition The samples of ambient air, ground and surface water and soil are collected and analyzed as per the standard methods for establishing the baseline data and to determine the impact of proposed activity on the same Ambient Air Environment The air environment around the plant was studied by setting up eight locations within the study area of 10 km radius from the project site and collection and monitoring the site specific meteorological data, viz. wind speed, wind direction, humidity, rainfall and ambient temperature was carried out. Design of network for ambient air quality monitoring locations is based on guidelines provided by CPCB. The ambient air samples were collected and analyzed for SPM, PM 10, PM 2.5, SO 2, NO X, HCl, Cl 2, O 3, Pb, CO, NH 3, C 6 H 6, Benzo (a) Pyrene (BaP), Arsenic (As), Nickel (Ni) & VOCs for identification, prediction, evaluation and assessment of potential impact on ambient air environment Ground And Surface Water Environment The water required for domestic and industrial use is being made available from surface water. Hence, to assess the physico-chemical quality of the water, a number of water samples were collected and analyzed for pollution parameters viz., ph, TDS, Turbidity, BOD 3, COD, Fluorides, Chlorides, Sulphates, Nitrates, Ammonical Nitrogen, Hardness, Alkalinity, Oil & Grease and some heavy metals in order to find out the contamination, if any Noise Environment Noise pollution survey was conducted in the study zone. The anticipated noise sources were industrial activities, which are likely to be increased due to proposed activity. Noise levels were also recorded in surrounding villages for evaluating general scenario of the study area. Hourly equivalent sound levels (Leq) were also recorded for calculating Day and Night noise levels in the surrounding villages Soil Environment Soil sampling and analysis was carried out to assess physico-chemical characteristics of the soils and delineate existing cropping pattern, existing land use and topography, within the study area. Prepared By: Aqua-Air Environmental Engineers Pvt. Ltd., Surat 53
54 Biological Environment Keeping in view, the importance of biological component of total environment due to the proposed project, biological characterization of terrestrial and aquatic environments, changes in species diversity of flora and fauna in terrestrial as well as aquatic systems were studied for impact analysis due to proposed project activity, if any Socio-economic Environment Demographic and related socio-economic data was collected from census handbook to assess socio-economic status of the study area. Assessment of impact on significant historical, cultural, and archeological sites/places in the area and economic and employment benefit arisen out from the project is given special attention Identification of Pollution Source Detailed study of manufacturing process for proposed scenario is carried out along with input and output of materials, water, and wastewater as well as infrastructure facilities available Evaluation of Pollution Control and Environmental Management System The qualitative and quantitative analysis of various pollution sources as well as evaluation of pollution control system is carried out Evaluation of Impact A comprehensive evaluation of environmental impact with reference to proposed activities is carried out Preparation of Environmental Management Plan A comprehensive Environmental Management Plan has been prepared covering all the aspects of pollution prevention measures, Air and Water Pollution Control measures, Hazardous Waste Management, Environmental Surveillance and Environmental Management Plan. The present report is an EIA conducted during Pre-Monsoon, 2017 (March, 2017 to May, 2017). The baseline environmental conditions have been established through field monitoring and literature survey. The contents of EIA report, details of data collection and source of secondary data are presented in Figure 1.5. Prepared By: Aqua-Air Environmental Engineers Pvt. Ltd., Surat 54
55 1.6 STRUCTURE OF REPORT The objective of the EIA study is preparation of Environment Impact Assessment (EIA) report based on the guidelines of the Ministry of Environment and Forests (MoEF), CPCB and GPCB. It incorporates the following. Chapter 1 is an Introduction to the Industry, their premises and surrounding areas. It also expresses the basic objectives and methodologies for EIA studies and work to be covered under each Environmental component. Chapter 2 presents a Description of Project and Infrastructure facilities including all industrial and environmental aspects of M/s. Prafful Overseas pvt. ltd.as well as manufacturing process details. This chapter also gives information about raw material storage and handling, water and wastewater quantitative details, air pollution and control system, Hazardous Waste generation, storage facility and disposal and utilities for proposed plant capacity. It also provides information about proposed Environmental Management Facilities available at the project site. Chapter 3 covers Baseline Environmental Status including meteorological details, Identification of baseline status of Environmental components of the surrounding area covering air, water and land environment. Also presents a study of land use pattern, Biological Environment & Socio-Economic Environment giving details about District Panchmahal, Taluka Halol and the study area in terms of land use pattern, biological environment, and socio-economic environment. Chapter 4 deals with Anticipated Environmental Impacts & Mitigation Measures, which provides quantification of significant impacts of the proposed activities of plant on various environmental components. Evaluation of the proposed pollution control facilities has been presented. Chapter 5 deals with Environmental Monitoring Plan. Chapter 6 describes Risk assessment and Disaster management plan that shall be adopted by the company. Chapter 7 describes Environment Management Plan (EMP) to be adopted for mitigation of anticipated adverse impacts if any and to ensure acceptable impacts. Chapter 8 describes Executive Summary of the Project. Chapter 9 describes Details of Consultants Engaged. Prepared By: Aqua-Air Environmental Engineers Pvt. Ltd., Surat 55
56 FIGURE 1.6 ACTIVITIES, SOURCES OF INFORMATION AND CONTENTS OF EIA REPORT ACTIVITIES OVERVIEW OF E. I. A. STUDIES SOURCE OF INFORMATION RECONNAISSANCE SURVEY OF PLANT LOCATION INTRODUCTIO N ANNUAL REPORT MARKET ASSESSMENT PROJECT REPORT MONITORING OF AIR, WATER & SOIL QUALITY & NOISE LEVELS DATA ON METEOROLOGY, SOCIO- ECONOMIC STATUS & BASIC AMENITIES SITE VISITS AND INTERVIEWS WITH LOCALS BASELINE ENVIRONME NTAL STATUS SOCIOECONO MIC STATUS & INFRASTRUCT PROPOSED PLANT CENTRAL GROUND WATER BOARD GUJARAT POLLUTION CONTROL BOARD (GPCB) PUBLIC HEALTH ENGINEERING DEPT AGRICULTURE DEPARTMENT FOREST DEPARTMENT IRRIGATION DEPARTMENT EMPLOYMENT EXCHANGE HEALTH CENTER CENSUS OF INDIA INDIAN METEOROLOGICAL DEPT ENVIRONMETAL INFORMATION CENTRE IDENTIFICATION & ASSESSMENT OF IMPACTS EVALUATION OF IMPACTS BY DESCRIPTION OF EFFLUENT TREATMENT PLAN, AIR POLLUTION CONTROL, HAZARDOUS WASTE MANAGEMENT, GREEN BELT DEVELOPMENT MONITORING CONSEQUENCE ANALYSIS PREPARATION OF DISASTER MANAGEMENT PLAN IMPACTS METHODOLO GY OF IMPACT ASSESSMENT ENVIRONME NTAL MANAGEMEN T PLAN RISK ASSESSMENT STUDIES & DISASTER MANAGEMEN T PLAN FACILITY DESCRIPTION SAFETY, HEALTH & ENVIRONMENTAL POLICY GUIDELINES BY DIRECTOR GENERAL OF FACTORY SAFETY, MINISTRY OF LABOR Prepared By: Aqua-Air Environmental Engineers Pvt. Ltd., Surat 56
57 CHAPTER 2 PROJECT DESCRIPTION AND INFRASTRUCTURAL FACILITIES 2.1 BACKGROUND M/s. Prafful Overseas pvt. ltd. proposes expansion of manufacturing of Nylon yarn & Polymer Chips at Plot No. 9C, GIDC Estate, Panoli, Tal: Ankleshwar, District: Bharuch , Gujarat. 2.2 MANUFACTURING ACTIVITIES EXISTING 57

58 58

59 59
60 60
61 PROCESS DESCRIPTION DESCRIPTION OF MANUFACTURING PROCESS: 61

62 62

63 63
64 Mass Balance Capro Lactam (1000 kg) + Water (40 kg) Catalyst (1.0 kg) *(1) 300 gm Lactam remaining in Bags during Charging (2) 50 kg Lactam + Water Coming out through seal pots of prepoly & VK Tube & sampling (3) 10 kg solid polymer waste (4) 5 kg Lactam Recovery waste Total 65.3 kg Nylon Chips kg 64
65 * Remarks (2) Goes to Process Water effluent (3) Sell as Waste (4) Goes to Raw Water Effluent 65
66 Lactam Crusher Over Flow to Recovery Plant Lactam BatchTank Cutter Chips Receiver Chips Extractor Pre Dewatering chut & Centrifuge Chips Dryer Lactam Pre Heater Chip Cutter Pre Poly Column V. K. Tube Effluent To ETP 66
67 2.3 INFRASTRUCTURE FACILITIES LAND Total m 2 land area is available at site; out of this m 2 (i.e. approx % of total area) is developed as greenbelt and other forms of greenery TRANSPORTATION FACILITIES Transportation of all the raw material and products shall be primarily by road only WATER AND WASTEWATER Total water requirement will be 968 Kl/day which is met through GIDC water supply. The waste water generations will 75KL/day. The 75KL/day effluent will be treated in ETP consists of primary treatment then it will be sent to land irrigation or cooling tower. Domestic Waste water (15 KLD) will be disposed by septic tank & soak pit system. Details of water consumption and wastewater generations are given in Table
68 TABLE WATER CONSUMPTION & WASTEWATER GENERATION WATER CONSUMPTION Existing KLD Proposed (Additional) KLD Total after Expansion KLD (A) Domestic (B) Gardening (C) Industrial Process Washing Boiler Cooling Others Industrial Total Grand Total (A+B+C) Remarks WASTEWATER GENERATION Category Existing KLD Proposed (Additional) KLD Total after Expansion KLD (A) Domestic (B) Gardening (C) Industrial Process Washing Boiler Cooling Others Total Industrial waste water Remarks 68
69 WATER BALANCE DIAGRAM Raw Water: KL/Day Dom: 18 KL/Da Ind: KLD Septic Tank / Soak Pit: 15 KL/Day Process KL/Day Cooling KL/Day Boiler: 200 KL/Day 10 KL/Day 55 KL/Day 10 KL/Day ETP 75 KL/Day Land irrigation & Cooling tower 69
70 TREATMENT PROCESS ETP DETAILS Process Description of Effluent Treatment Plant M/s. Praful Overseas Pvt. Ltd. shall have an Effluent treatment plant, which consisting of primary, secondary and tertiary treatment units. The details of ETP are as follows. First effluent from process and washing streams of wastewater shall pass through Screen Chamber (SC-01) where floating material shall be removed with help of Screen (S-01). Then effluent shall be collected in Equalization tank cum Neutralization Tanks (ENTs-01). Here lime solution shall be added from Lime Dosing Tank (LDT-01) to maintain neutral ph of wastewater as per requirement by gravity. Pipe grid is provided at bottom of the ENTs-01 to keep all suspended solids in suspension and to provide proper mixing. 2 nos. of Air Blowers B-01(1 stand-by) shall supply air through pipe grid. Then after, neutralized wastewater shall be pumped to Flash Mixer (FM-01). Ferrous Sulphate and Polyelectrolyte shall be dosed from Flocculants Dosing Tank (FDT-01) and Polyelectrolyte Dosing Tank (PEDT-01) respectively by gravity into FM-01 to carry out coagulation by using a Flash Mixer. Then after, coagulated wastewater shall be settled in Primary Tube Settler (PTS-01). Clear supernatant from PTS-01 shall be passed in AerationTank (AT-01) Here, biodegradation of organic matter of the wastewater shall be carried out by bacteria (suspended growth) in the AT-01and for that oxygen shall be supplied by 2 nos. of air blowers (B-02) through diffusers. Air blowers also keep MLSS in suspension. Then after, wastewater shall go to Secondary Settling Tank (SST-01) from AT-01. Here, the suspended solids shall be settled. Sludge shall be removed from bottom of SCL-01 and pumped to AT-01 to maintain MLSS and excess activated sludge shall be sent to Sludge Sump (SS-01). Clear supernatant from SCL-01 is the collected in of Intermediate Sump (IS- 01) by gravity Thereafter, the wastewater shall be passed through Dual Media Filter (DMF-01) to remove left out TSS and for final effluent polishing. After tertiary treatment, Filter water is collected to Treated Water Sump (TWS-01) & use for land irrigation. Sludge collected in Sludge Sump (SS-01) from PTS-01 and SST-01 shall be send to Filter Press for dewatering. Then dry cake shall be stored in HWSA before final disposal to TSDF. Leachate from Filter Press and back wash from DMF-01 shall be sent back to ENTs-01 for further treatment. 70
71 Details of ETP Units Sr. No. Name of Unit Nos. Size L x B x (LD+FB) MOC 1 Screen Chamber (SC-01) x 1.5 x 0.3 RCC M25 2 Equalization cum Neutralization Tank (ENTs- 01)) x 3.6 x ( ) RCC M25 with A-A Bk. Lining 2 Lime Dosing Tank (LDTs-01) lit HDPE 3 Ferrous Dosing Tank (FDT lit HDPE 01) 4 Poly Dosing Tank (PDT-01) lit HDPE 5 Flash Mixer (FM-01) x 1.2 x ( ) RCC M25 6 Primary Tube Settler (PTS- 01) x 2.5 x (2.0 RCC M HB+0.5) 7 Nutrient Dosing Tank (NDT lit HDPE 01) 8 Aeration Tank (AT-01) x 6.5 x ( ) RCC M25 9 Secondary Settling Tank (SST-01) x 2.5 x (2.5 RCC M HB+0.5) 10 Intermediate Sump (IS-01) x 2.0 x ( ) RCC M25 11 Dual media Filter (DMF-01) 1 4 m3/hr MSEP/FRP 12 Treated Water Sump (TWS x 3.75 x ( ) RCC M25 01) 13 Sludge Sump (SS-01) x 2.0 x ( ) RCC M25 14 Filter Press(FP) 1 25 m3/d MS + PP 71

72 Flow Diagram: EXPECTED CHARACTERISTICS OF WASTEWATER BEFORE & AFTER TREATMENT Sr. Parameter Characteristics (mg/l) No. Untreated Treated 1. ph Oil and Grease, mg/l COD, mg/l BOD 3, mg/l Suspended Solids, mg/l
73 Economical Technical Viability of treatment of effluent The comprehensive effluent treatment and management system for the proposed project will comprises of Primary ETP. The capital cost and recurring cost of the effluent treatment system summarized as under The capital cost of the proposed project is Rs. 600 crore. Total Quantity of waste water generation = 75 KL/Day Total Liters= Liters Total effluent Treatment Cost= * 25 *2.5 = 46, 87, 500/- Min. Cost of Product=1500 Rs. /Kg Total Production =360 MT/Month= kg/month Total turnover of Plant = 54,00,00,000 Rs. /Month The cost of treatment of effluent is 2.6% of Total Turnover. Approx. Min. Profit= 15.0 % of total turnover of the plant= 5,40,00,000/- So, it is viable AIR POLLUTION AND CONTROL SYSTEM DETAILS OF FUELCONSUMPTION SR. EXISTING PROPOSED NAME OF FUEL NO. QUANTITY QUANTITY TOTAL QUANTITY 1 Natural Gas m 3 /Day m 3 /Day m 3 /Day 2 LDO Lit/Hr 100 Lit/Hr 100 Lit/ Hr 3 Coal MT/day 62 MT/day 4 Power 8 MW 8 MW 16.0 MW DETAILS OF PROCESS VENT AND BOILER STACK (FLUE GAS EMISSION THROUGH STACK) Sr. no. Source of emission With Capacity Existing 1. Boiler (0.6 TPH) 2 CPP (2.83 MW) Stack Height (meter) Type of Fuel Natural Gas: Quantity of Fuel MT/Day 10,000 M3/Day Type of emissions i.e. Air Pollutants PM < 150 mg/nm 3 SO X < 100 ppm Air Pollution Control Measures (APCM) Low NOx Burner 73
74 3 DG Set (Stand By) 320 KVA (2 Nos.) & 125 KVA (1 Nos.) Total Proposed 1. Boiler (8 TPH) 2 Boiler (4 TPH) 3 Thermic Fluid Heater 3 Nos. (Each 5000 U) 4 CPP (2.83 MW) 5 DG Set (Stand By) 8 LDO: 36 Coal Coal 36 Coal 20 Natural Gas: Lit/Hr. 18 MT/Day 8 MT/Day 36 MT/Day 10,000 M3/Day NO X < 50 ppm PM < 150 mg/nm 3 SO X < 100 ppm NO X < 50 ppm -- ESP MCS +Bag Filter ESP KVA (2 Nos.) & 125 KVA (1 Nos.) 8 LDO: 100 Lit/Hr NOISE LEVEL AND CONTROL SYSTEM Extensive oiling and lubrication and preventive maintenance shall be carried out to reduce noise generation at source to the permissible limit. However, at place where noise levels can exceed the permissible limit, Earplugs and Earmuffs are provided to those working in such area HAZARDOUS WASTE GENERATIONS AND DISPOSAL SYSTEM TABLE-2.2 DETAILS OF HAZARDOUS WASTE AND ITS MODE OF DISPOSAL Sr. no. 1 2 Type/Name of Hazardous waste Discarded Containers Used Oil/Spent Oil Source of generation Process and Storage and Handling of Material Process machineries Category and Schedule as per HW Rules. Schedule-I 33.1 Schedule-I 5.1 Quantity (MT/ month) Disposal Method 5.0 Collection, Storage, Transportation, Reuse/ Sale to Authorized Vendor. 0.5 KL Collection, Storage, Transportation, Reuse or sale to authorized 74
75 3 ETP Sludge ETP Schedule-I 35.3 reprocessors. 1.0 MT Collection, Storage, Transportation, disposal at nearest TSDF site. DETAILS OF DISPOSAL OF SOLID WASTES Industry is a member of TSDF site and Incineration Facility of M/s. BEIL (Ankleshwar) for disposal of hazardous wastes from time to time. 2.4 DETAILS OF UTILITIES Various utilities required for proper functioning of manufacturing plants. These utilities include steam boiler, Thermic Fluid Heater, cooling plant, Cooling tower, Chilling tower, Air compressor, High Vacuum System, etc. 2.5 ELECTRICITY & FUEL REQUIREMENT Power Requirements: Existing DGVCL is 8.0 MW CPP: 2.83 MW DG Set (Stand By) 320 KVA (2 Nos.) 125 KVA(1 Nos.) Total Proposed: DGVCL will be 16.0 MW CPP: 2.83 MW DG Set (Stand By) 320 KVA (2 Nos.) 125 KVA (1 Nos.) Fuel Requirements: Existing: Natural Gas = m 3 /Day LDO= Lit/Hr Proposed: Natural gas= M 3 /Day 75
76 LDO = 100 Lit/Hr Coal = 62 NT/Day 2.6 LIST OF MACHINERY AND EQUIPMENT TABLE 2.3 Sr. No. Machinery/ Equipment Nos t/d PA6 Polymerization plant 1 2. Chillers 2 3. Air compressors 2 4. Cooling Towers 2 5. Steam generator 2 6. Nitrogen plant Phase wise project implementation schedule with bar chart and time frame, in terms of site development, infrastructure provision, EMS implementation etc. Site Development 8 Month after getting EC/CTE Infrastructure 6 Month after site development EMS Implementation 4 Month after develop infrastructure. 2.8 Plans for management, collection and disposal of waste streams to be generated from spillage, leakages, vessel washing, used container washing etc. Measures proposed for preventing effluent discharge during unforeseen circumstances. - All major chemical handling is done through closed system. - All reaction vessels are connected to scrubber system. - Ammonia Detection System: The gas leakage Alarm gets activated by automatic detection device installed at Ice plants at site. - Smoke & fire detection system installed at ware house. - Spillage of any chemical will be avoided to the maximum extent by closed circuit system i.e. day tanks are provided with an overflow line having bigger diameter than that of inlet of the pipe diameter. Standard operating procedures are available to handle spillage and leakage. 76
77 CHAPTER 3 BASELINE ENVIRONMENTAL STATUS The baseline status of environmental quality in the vicinity of project site serves as the basis for identification, prediction and evaluation of impacts. The baseline environmental quality is assessed through field studies within the impact zone for various components of the environment, viz. air, noise, water, land and socio-economic. The baseline environmental quality has been assessed in the summer season 2017 (March to May, 2017) in accordance with the guidelines for preparation of EIA studies in a study area of 10 km radial distance from the project site. 3.1 MICRO-METEOROLOGY OF THE AREA The climate of Gujarat is varied, as it is moist in the southern districts and dry in the northern region. The Arabian Sea and the Gulf of Cambay in the west and the forest-covered hills in the east soften the rigors of climatic extremes, consequently reducing the temperature and render the climate more pleasant and healthy. Bharuch lies along the southern part of the state and experiences a climate with aridity index of 15 to 20 per cent indicating adequate moisture availability in the soils for most part of the year. (Courtesy: Environmental Information Centre, New Delhi). EIA Report Prepared By Aqua-Air Environmental Engineers Pvt. Ltd., Surat 77
78 3.1.1 TEMPERATURE DETAILS Minimum, Maximum and Average Temperatures for Surat Station of the year 2016 are given in Table 3.1. TABLE 3.1 TEMPERATURE DATA Month (2016) Minimum Temperature ( 0 C) Maximum Temperature ( 0 C) Average Temperature ( 0 C) January February March April May June July August September October November December EIA Report Prepared By Aqua-Air Environmental Engineers Pvt. Ltd., Surat 78
79 3.1.2 RELATIVE HUMIDITY (RH) Minimum, Maximum and Average Monthly Relative Humidity for Surat Station of the year 2016 is given in Table 3.2. TABLE 3.2 RELATIVE HUMIDITY DATA Month (2016) Minimum R.H.% Maximum R.H.% Average R.H.% January February March April May June July August September October November December EIA Report Prepared By Aqua-Air Environmental Engineers Pvt. Ltd., Surat 79
80 3.1.3 RAINFALL Rainfall data for Bharuch Station of the year 2016 is presented in Table 3.3. TABLE 3.3 RAINFALL DATA Month (2016) Monthly Total (mm) Numbers of Rainy Days January 0 0 February 0 0 March 0 0 April 0 0 May 0 0 June 25 7 July August September October November 0 0 December 0 0 Total Total rainfall, during the monsoon period, has been recorded as 496 mm. EIA Report Prepared By Aqua-Air Environmental Engineers Pvt. Ltd., Surat 80
81 3.1.4 WIND SPEED Wind speed for Surat Station of the year 2016 is given in Table 3.4. TABLE 3.4 WIND SPEED DATA Sr. No. Month Average Wind speed (2016) (KMPH) 1. January February March April May June July August September October November December 2.6 Average 3.3 EIA Report Prepared By Aqua-Air Environmental Engineers Pvt. Ltd., Surat 81
82 Site-specific meteorological data is given in Table-3.5. A meteorological station was installed at the project site to know temperature, relative humidity, hourly wind speed, direction, and rainfall at the project site during the study period: TABLE SITE SPECIFIC METEOROLOGICAL DATA (PERIOD MARCH, 2017 TO MAY, 2017) METEOROLOGICAL PARAMETER Temperature ( 0 C) Min. Max. Avg. Relative Humidity (%) Min. Max. Avg. Wind Speed (km/h) Min. Max. Avg. MONTH MARCH, 2017 APRIL, 2017 MAY, There was no rainfall during the study period. Diurnal shift in wind direction was not observed during study period. The wind rose diagram prepared from data collected at site is shown in Figure 3.1, while stability class diagram is shown in Figure 3.2 EIA Report Prepared By Aqua-Air Environmental Engineers Pvt. Ltd., Surat 82
83 FIGURE-3.1 WIND ROSE DIAGRAM EIA Report Prepared By Aqua-Air Environmental Engineers Pvt. Ltd., Surat 83
84 FIGURE-3.2 STABILITY CLASS DISTRIBUTION 70 Wind Class Frequency Distribution % Calms >= Wind Class (m/s) Stability Class Frequency Distribution % A B C D E F G Stability Class 10.8 EIA Report Prepared By Aqua-Air Environmental Engineers Pvt. Ltd., Surat 84
85 3.2 AIR ENVIRONMENT DESIGN OF NETWORK FOR AMBIENT AIR QUALITY MONITORING LOCATIONS The air quality status in the impact zone is assessed through a network of ambient air quality monitoring locations. The tropical climatic conditions mainly control the transport and dispersion of air pollutant emissions during various seasons. The baseline studies for air environment include identification of specific air pollutants prior to implementation of the project. The Environmental Impact Assessment (EIA) study requires monitoring of baseline ambient air quality during one season. Accordingly, ambient air quality monitoring was carried out in the pre-monsoon season from March 1, 2017 to May 31, 2017 was collected. The main sources of air emissions in the study area are industrial operations, vehicular emission, dust from paved and unpaved tracks, fuel burning for domestic purpose, and windblown dust from open land. Nine Ambient Air Quality Monitoring (AAQM) locations were selected based on guidelines of ambient air quality network siting criteria of CPCB. All AAQM locations were selected within the study area of 10 km radial distance from the project site covering all zones i.e. industrial, residential, rural & other area as per NAAQS and keeping in mind local topography and meteorology of the area METHODOLOGY FOR AMBIENT AIR QUALITY MONITORING The ambient air quality monitoring was carried out in accordance with National Ambient Air Quality Standards (NAAQS) of CPCB. Ambient Air Quality Monitoring (AAQM) was carried out at ten locations during the study period. The locations of the different stations with respect to its distance and direction from project site are shown in Table-3.6 and Figure-3.3 respectively. The conventional and project specific parameters such as Suspended Particulate Matter, Respirable Suspended Particulate Matter (RSPM-PM 10 ), Respirable Suspended Particulate Matter (RSPM-PM 2.5 ), Sulphur Dioxide (SO 2 ), Oxides of Nitrogen (NOx), Ozone (O 3 ), Lead (Pb), Carbon Monoxide (CO), Ammonia (NH 3 ), Benzene (C 6 H 6 ), Benzo (a) Pyrene (BaP), Arsenic (AS), Nickel (Ni), Chlorine (Cl 2 ), HCl, HF, NH 3, Br 2 & VOCs were monitored at site. The values for mentioned concentrations of various pollutants at all the monitoring locations were processed for different statistical parameters like arithmetic mean, minimum EIA Report Prepared By Aqua-Air Environmental Engineers Pvt. Ltd., Surat 85
86 concentration, and maximum concentration and percentile values. The existing baselines levels of Suspended Particulate Matter, Respirable Suspended Particulate Matter (RSPM- PM 10 ), Respirable Suspended Particulate Matter (RSPM-PM 2.5 ), Sulphur Dioxide (SO 2 ), Oxides of Nitrogen (NOx), Ozone (O 3 ), Lead (Pb), Carbon Monoxide (CO), Ammonia (NH 3 ), Benzene (C 6 H 6 ), Benzo (a) Pyrene (BaP), Arsenic (AS), Nickel (Ni), Chlorine (Cl 2 ) ), HCl, HF, NH 3, Br 2 & VOCs are expressed in terms of various statistical parameters as given in Tables- 3.7 National ambient air quality standards are enclosed as Annexure-1. TABLE DETAILS OF AMBIENT AIR QUALITY MONITORING LOCATIONS SR. NO. NAME OF VILLAGE BEARING W.R.T. PROJECT SITE APPROXIMATE RADIAL DISTANCE FROM PROJECT SITE (KM) TYPE OF AREA 1 Project-site (A1) Industrial 2 Panoli (A2) WS 4.64 Residential 3 Sanjali (A3) WWS 1.5 Residential 4 Bakrol (A4) NNE 2.53 Residential 5 Kosamdi (A5) NE 5.12 Residential 6 Kharod (A6) E 0.76 Residential 7 Kapodara (A7) NNE 5.24 Residential 8 Kondh (A8) NE 7.48 Residential 9 Umarwada (A9) NW 4.71 Residential EIA Report Prepared By Aqua-Air Environmental Engineers Pvt. Ltd., Surat 86
87 FIGURE LOCATION OF AMBIENT AIR QUALITY MONITORING STATIONS TABLE 3.7 AMBIENT AIR QUALITY STATUS (MARCH, 2017 to MAY, 2017) Unit: µg/m 3 SR. NO. SAMPLING LOCATION SPM PM 10 PM 2.5 SO 2 NOx O 3 AVERAGE 1 Project-site (A1) Panoli (A2) Sanjali (A3) Bakrol (A4) Kosamdi (A5) Kharod (A6) Kapodara (A7) Kondh (A8) Umarwada(A9) Limit EIA Report Prepared By Aqua-Air Environmental Engineers Pvt. Ltd., Surat 87
88 TABLE 3.7 (CONTD.) AMBIENT AIR QUALITY STATUS (MARCH,2017 to MAY, 2017) Unit: µg/m 3 SR. SAMPLING Pb NH 3 CO C 6 H 6 BaP As Ni NO. LOCATION (mg/m 3 ) (ng/m 3 ) (ng/m 3 ) (ng/m 3 ) AVERAGE 1 Project-site (A1) BDL BDL BDL BDL Panoli (A2) BDL BDL BDL BDL Sanjali (A3) BDL BDL BDL BDL Bakrol (A4) BDL BDL BDL BDL Kosamdi (A5) BDL BDL BDL BDL Kharod (A6) BDL BDL BDL BDL Kapodara (A7) BDL BDL BDL BDL Kondh (A8) BDL BDL BDL BDL Umarwada(A9) BDL BDL 1.29 BDL BDL BDL Limit Note: BDL: Below Detectable Limit TABLE 3.7 (CONTD.) AMBIENT AIR QUALITY STATUS (MARCH, 2017 to MAY, 2017) Unit: µg/m 3 SR. NO. SAMPLING LOCATION HCl Cl 2 Br 2 HF HC VOCs (Isobutylene Equivalent) (ppm) AVERAGE 1 Project-site (A1) 6.9 BDL BDL BDL BDL Panoli (A2) BDL BDL BDL BDL Sanjali (A3) 9.28 BDL BDL BDL BDL Bakrol (A4) BDL BDL BDL BDL Kosamdi (A5) BDL BDL BDL BDL Kharod (A6) 8.83 BDL BDL BDL BDL Kapodara (A7) 7.95 BDL BDL BDL BDL Kondh (A8) 9.13 BDL BDL BDL BDL Umarwada(A9) BDL BDL BDL BDL 0.5 NAAQS Note: BDL: Below Detectable Limit Note: PARAMETER TEST METHOD Particulate Matter (PM 10 ) IS 5182 (PART 23):2006 (Cyclonic Flow Technique) Gravimetric Particulate Matter (PM 2.5 ) Gravimetric Sulphur Dioxide (SO 2 ) IS 5182 (PART-2):2001 EIA Report Prepared By Aqua-Air Environmental Engineers Pvt. Ltd., Surat 88
89 Nitrogen Dioxide (NO 2 ) IS 5182 (PART-6):2006 Ozone (O 3 ) IS 5182 (PART-9):1974 ** Lead (Pb) AAS APHA 3030 E Ammonia (NH 3 ) Indophenol Blue Method * Carbon Monoxide (CO) Digital CO Analyzer ** Benzene (C 6 H 6 ) Adsorption extraction followed by GC/GCMS ** Benzo (α) Pyrene (BaP) Solvent extraction followed by GC/GCMS ** Arsenic (As) AAS APHA 3114 B- C ** Nickel (Ni) AAS APHA 3030 E ** Hydro Carbon (HC) Digital Gas Analyzer Hydrogen Sulphide (H 2 S) IS 5182 (PART-7):1973 * Hydrochloric Acid(HCl) Titrametric Method Chlorine (CL 2 ) IS:5182:(PART-19):1982 * Hydrogen Fluoride (HF) IS:5182:(PART-13):1991 Carbon Disulphide (CS 2 ) IS:5182:(PART-20):1982 VOC Aeroqual Series 300 (Sensor 0 25 ppm) Minimum Detectable Limit 0.1 ppm Minimum Detection Limit: Ammonia (NH 3 ) : 1 µg/m 3 ** Nickel (as Ni) : 10 ** Lead (as Pb) : 0.5 µg/m 3 ** Benzene (as C 6 H 6 ) ** Hydrocarbon(HC ng/m 3 ) : 2 µg/m 3 * Carbon Monoxide(as CO) ** Arsenic (as As) : 2 ng/m 3 ** Benzo (α) : 0.5 Pyrene (BaP) ng/m 3 * Not in our NABL Scope, ** Analysed by Sub Contractor (Not in our NABL Scope) : 1 ppm : 1.14 mg/m SUMMARY: The observed ambient air quality concentrations are presented in Table-3.7. They represent the cross sectional distribution of the baseline air quality status of the study region. The maximum concentration of SPM (145.3 µg/m 3 ), PM 10 (95.94 µg/m 3 ), PM 2.5 (57.51 µg/m 3 ), SO 2 (26.72 µg/m 3 ), NOx (28.53 µg/m 3 ), O 3 (11.73 µg/m 3 ), CO (1.3 µg/m 3 ), VOC (0.7 ppm), was recorded in study area. The minimum concentration of SPM (116.8 µg/m 3 ), PM 10 (74.91 µg/m 3 ), PM 2.5 (43.55 µg/m 3 ), SO 2 (15.75 µg/m 3 ), NOx (18.63 µg/m 3 ), O 3 (10.51 µg/m 3 ), CO (1.21 µg/m 3 ), VOC (0.4 ppm), was recorded in study area. The PM 10 and PM 2.5 concentrations at all the AAQM locations were primarily caused by local phenomena including industrial & vehicular activities and natural dust getting air borne due EIA Report Prepared By Aqua-Air Environmental Engineers Pvt. Ltd., Surat 89
90 to manmade activities and blowing wind. PM 10 and PM 2.5 concentrations were observed below stipulated standards of CPCB for Industrial, Residential, Rural and Other Area at all air quality monitoring locations during the monitoring period. 3.3 NOISE ENVIRONMENT The objective of the noise pollution survey around the project site was to identify existing noise sources and to measure background noise levels. Major noise sources in the study area are industries, commercial, and vehicular movements. The noise monitoring locations are given in Table-3.8A and shown in Figure-3.4 while the results of noise monitoring are given in Table 3.8B METHODOLOGY FOR NOISE MONITORING The noise monitoring was carried out at ten locations in day time during (6 am to 9 pm) and at night time (9 pm to 6 am) in the study area covering all the areas i.e. industrial, commercial, residential and silence zones as mentioned in Noise (Pollution and Control) Rules, CPCB Recommendations for community noise exposure are attached as Annexure 3. Hourly Equivalent noise levels Leq (day) and Leq (night) were measured at each monitoring locations. One day monitoring on April 6-10, 2017 during day and night time was carried out at all the locations. Besides, damage risk criteria for hearing loss given by Occupational Safety & Health Administration (OSHA) are enclosed as Annexure - 2. The noise level measured in study area at different locations is given in Table 3.8. The noise sources identified around the site are vehicular traffic, industrial and commercial activities. CPCB recommendation for community noise exposure in different category of area (i.e. residential, commercial, industrial and silence zone) is enclosed as Annexure - 3 while Damage risk criteria for hearing loss given by occupational safety & health administration (OSHA) is enclosed as Annexure - 2. The noise levels were below the stipulated standards of CPCB. Noise levels due to transportation were also measured at three different locations. The equivalent noise level Leq (60 min average) measured at a distance of 10 m and 20 m from the edge of the road at each of the locations are presented in Table 3.9. The communities close to the project site are not exposed to major noise sources. The commercial activities EIA Report Prepared By Aqua-Air Environmental Engineers Pvt. Ltd., Surat 90
91 and transport apart from natural sources contribute to community noise levels. TABLE DETAILS OF AMBIENT NOISE QUALITY MONITORING LOCATIONS DISTANCE WISE SR. NO. NAME OF VILLAGE BEARING W.R.T. PROJECT SITE APPROXIMATE RADIAL DISTANCE FROM PROJECT SITE (KM) 1 Project-site (N1) Panoli (N2) WS Sanjali (N3) WWS Bakrol (N4) NNE Kosamdi (N5) NE Kharod (N6) E Kapodara (N7) NNE Kondh (N8) NE Umarwada (N9) NW 4.71 FIGURE LOCATION OF AMBIENT NOISE LEVEL MONITORING STATIONS EIA Report Prepared By Aqua-Air Environmental Engineers Pvt. Ltd., Surat 91
92 TABLE 3.9 BACKGROUND NOISE LEVELS (SUMMER, 2017) SR. NO. LOCATION NOISE LEVEL IN db(a) 1 Project-site (N1) Panoli (N2) Sanjali (N3) Bakrol (N4) Kosamdi (N5) Kharod (N6) Kapodara (N7) Kondh (N8) Umarwada (N9) TIME Day Night Day Night Day Night Day Night Day Night Day Night Day Night Day Night Day Night TABLE NOISE LEVELS DUE TO TRANSPORTATION SR. NO. SAMPLING LOCATION NOISE LEVEL IN db(a) 1. N1 (T): Near Kharod Patia N2 (T): Near Panoli By-Pass N3 (T): Near Bakrol By-Pass N4 (T): Near Kapodara By-Pass N5 (T): Near Sanjali By-Pass N6 (T): Near Kondh By-Pass TIME Day Night Day Night Day Night Day Night Day Night Day Night EIA Report Prepared By Aqua-Air Environmental Engineers Pvt. Ltd., Surat 92
93 TABLE INDUSTRIAL NOISE LEVELS SR. NO. SAMPLING LOCATION NOISE LEVEL IN db(a) 1. Nr. Swaraj Life Science Nr. Sun Pharma Nr. Gharda Chemicals Ltd Nr. Solvay Specialities India Pvt. Ltd Nr. J.B. Chemicals Nr. Hikal Limited Nr. Aventor Ltd Nr. Hindustan MI-Swaco Nr. Cheminova Pvt. Ltd TIME Day Night Day Night Day Night Day Night Day Night Day Night Day Night Day Night Day Night 3.4 WATER ENVIRONMENT RECONNAISSANCE The average annual rainfall in the region is about 496 mm. The baseline water quality status in the region is established by analyzing surface water and ground water. Water requirement at site would be met through GIDC water supply METHODOLOGY FOR WATER QUALITY MONITORING Nine nos. of ground water and one no. of surface water samples were collected from the study area. These samples were analyzed for physic-chemical parameters to ascertain the baseline status in the existing surface water and ground water bodies. Samples were collected once, on April 6-10, 2017, during the study period and analyzed as per standard methods of water and wastewater analysis (APHA). The Indian standard specification for drinking water IS: and CPCB water use criteria are enclosed as Annexure 5 & 6 EIA Report Prepared By Aqua-Air Environmental Engineers Pvt. Ltd., Surat 93
94 respectively. The details of surface and ground water sampling locations are given in Table And sampling locations of water quality monitoring are shown in Figure 3.5. The Indian standard specification for drinking water is enclosed as Annexure 5. The physico- chemical characteristics of the different water samples are presented in the Tables TABLE 3.12 SAMPLING LOCATIONS FOR MONITORING SURFACE AND GROUND WATER QUALITY SR. NO. SAMPLING LOCATIONS BEARING W.R.T. PROJECT SITE APPROXIMATE RADIAL DISTANCE FROM PROJECT SITE (KM) 1 Project-site (GIDC Water) Panoli (GW1) WS Sanjali (GW2) WWS Bakrol (GW3) NNE Kosamdi (GW4) NE Kharod (GW5) E Kapodara (GW6) NNE Kondh (GW7) NE Umarwada (GW8) NW 4.71 GW= Ground water, SW= Surface water EIA Report Prepared By Aqua-Air Environmental Engineers Pvt. Ltd., Surat 94
95 FIGURE LOCATIONS OF WATER SAMPLING STATIONS EIA Report Prepared By Aqua-Air Environmental Engineers Pvt. Ltd., Surat 95
96 TABLE WATER QUALITY- PHYSICAL PARAMETERS (SUMMER, 2017) SR. NO. SAMPLING LOCATION Ph TEMPERATURE ( 0 C) TURBIDITY (NTU) T.D.S. (mg/l) T.S.S. (mg/l) 1 Project-site (GIDC Water) Panoli (GW2) Sanjali (GW3) Bakrol (GW4) Kosamdi (GW5) Kharod (GW6) Kapodara (GW7) Kondh (GW8) Umarwada (GW9) GW= Ground water, SW= Surface water TABLE (CONT'D.) WATER QUALITY - NUTRIENTS, OXYGEN DEMAND AND ORGANIC PARAMETERS SR. NO. SAMPLING LOCATION AMMONICAL NITROGEN DO COD BOD 3 27 OIL & GREASE (mg/l) 1 Project-site (GIDC Water) BDL BDL BDL 2 Panoli (GW2) BDL BDL BDL 3 Sanjali (GW3) BDL BDL BDL 4 Bakrol (GW4) BDL BDL BDL 5 Kosamdi (GW5) BDL BDL BDL 6 Kharod (GW6) BDL BDL BDL 7 Kapodara (GW7) BDL BDL BDL 8 Kondh (GW8) BDL 7.08 BDL BDL BDL 9 Umarwada (GW9) BDL BDL BDL GW= Ground water, SW= Surface water EIA Report Prepared By Aqua-Air Environmental Engineers Pvt. Ltd., Surat 96
97 TABLE (CONT'D.) WATER QUALITY - INORGANIC PARAMETERS SR. SAMPLING LOCATION TOTAL T.H. C.H. Cl - SO 2 4 Mg NO. ALKALINITY (AS (AS (AS CACO 3 ) CACO 3 ) CACO 3 ) (mg/l) 1 Project-site (GIDC Water) Panoli (GW2) Sanjali (GW3) Bakrol (GW4) Kosamdi (GW5) Kharod (GW6) Kapodara (GW7) Kondh (GW8) Umarwada (GW9) GW= Ground water, SW= Surface water T.H. =Total Hardness, C.H. =Calcium Hardness, BDL= Below Detectable Limit TABLE (CONT'D.) WATER QUALITY - HEAVY METALS SR. SAMPLING LOCATION Na T-Cr +3 Cu Pb Fe Zn K Cd As - NO. (mg/ L) 1 Project-site (GIDC Water) BDL BDL BDL 0.30 BDL 9.05 BDL BDL 2 Panoli (GW2) BDL BDL BDL 0.23 BDL 3.69 BDL BDL 3 Sanjali (GW3) BDL BDL BDL 0.39 BDL BDL BDL 4 Bakrol (GW4) BDL BDL BDL 6.10 BDL BDL BDL 5 Kosamdi (GW5) BDL BDL BDL BDL 9.37 BDL BDL 6 Kharod (GW6) 26.5 BDL BDL BDL BDL 4.26 BDL BDL 7 Kapodara (GW7) BDL BDL BDL 0.29 BDL BDL BDL 8 Kondh (GW8) 19.6 BDL BDL BDL 0.79 BDL 2.43 BDL BDL 9 Umarwada (GW9) BDL BDL BDL 1.34 BDL BDL BDL Minimum Detection Limit: ** Total Chromium (as Cr +3 ) : mg/l Total Iron (as Fe) : 0.01 mg/l Copper (as Cu) : 0.05 mg/l ** Zinc (as Zn) : mg/l Fluoride (as F-) : 0.05 mg/l * Not in our NABL Scope, ** Analysed by Sub Contractor (Not in our NABL Scope) EIA Report Prepared By Aqua-Air Environmental Engineers Pvt. Ltd., Surat 97
98 3.4.3 SUMMARY: BASELINE GRUOND WATER QUALITY ph of ground water samples varied from 7.15 to Turbidity was found 0.10 to 0.86 NTU, Total Dissolved Solids varied in the range of 372 to 3478 mg/l. DO and COD are found in range of 4.6 to 7.08 mg/l, and BDL to mg/l respectively. BOD 3 was found to be BDL. Total Hardness (as CaCO 3 ) varied from to mg/l. Total Alkalinity varied from 125 to mg/l. Chlorides and Sulfates are found in the range of to mg/l and to mg/l respectively. BASELINE SURFACE WATER QUALITY ph of Surface water sample was Turbidity was found 2.7 NTU, Total Dissolved Solids was 1124 mg/l. DO and COD were found 5.42 mg/l and mg/l respectively. BOD 3 was found to be BDL. Total Hardness (as CaCO 3 ) was mg/l. Total Alkalinity was 375 mg/l. Chlorides and Sulfates were found mg/l and mg/l respectively. 3.5 LAND ENVIRONMENT METHODOLOGY FOR SOIL MONITORING Soil samples were collected from nine different locations during study on April 6-10, 2017 in the study area (0-20 cm depth). The locations selected for collection of soil samples are shown in Figure 3.6 and presented in Table The analysis results of soil samples are given in Table EIA Report Prepared By Aqua-Air Environmental Engineers Pvt. Ltd., Surat 98
 WWS 1.5 4 Bakrol (S4) NNE 2.53 5 Kosamdi (S5) NE 5.12 6 Kharod (S6) E 0.76 7 Kapodara (S7) NNE 5.24 8 Kondh (S8) NE 7.48 9 Umarwada (S9) NW 4.71 FIGURE - 3.")
99 TABLE SAMPLING LOCATIONS: SOIL QUALITY DISTANCE WISE SR. NO. SAMPLING LOCATION BEARING W.R.T. PROJECT SITE APPROXIMATE RADIAL DISTANCE FROM PROJECT SITE (KM) 1 Project-site (S1) Panoli (S2) WS Sanjali (S3) WWS Bakrol (S4) NNE Kosamdi (S5) NE Kharod (S6) E Kapodara (S7) NNE Kondh (S8) NE Umarwada (S9) NW 4.71 FIGURE LOCATIONS OF SOIL SAMPLING STATIONS EIA Report Prepared By Aqua-Air Environmental Engineers Pvt. Ltd., Surat 99
100 TABLE Sr. No. PHYSICO-CHEMICALS CHARACTERISTICS OF SOIL (SUMMER, 2017) Parameters Project Site Panoli Sanjali Bakrol Kosamdi Kharod Kapodara Kondh Umarw ada 1 ph Temperature ( 0 C) 3 Moisture (%) SO 4 (mg/kg) Chlorides (mg/kg) 6 Total hardness (mg/kg) 7 Organic Matter (%) 8 Bulk density (g/cm 3 ) 9 Calcium (mg/kg) 10 WHC (%) Porosity (%) Grain Size (%) Gravel Coarse sand Medium sand Fine sand Silt + Clay Na (mg/kg) Cu +2 (mg/kg) BDL BDL BDL BDL BDL BDL BDL BDL BDL 15 Fe +3 (mg/kg) Cd (mg/kg) BDL BDL BDL BDL BDL BDL BDL BDL BDL 17 K (mg/kg) Ni +2 (mg/kg) BDL BDL BDL BDL BDL BDL BDL BDL BDL 19 Pb +2 (mg/kg) 2.05 BDL BDL BDL BDL 1.98 BDL BDL 1.74 Note: Minimum Detectable Limit: Nickel 0.1 mg/kg Copper 0.5 mg/kg Cadmium mg/kg Lead mg/kg EIA Report Prepared By Aqua-Air Environmental Engineers Pvt. Ltd., Surat 100
101 3.5.2 SUMMARY: The porosity of soils varied from % to 56.6 % and can be considered as moderate to good for air and water movement in the soil. The Water Holding Capacity varied from % to %. Bulk Density varied from 1.11 to 1.25 g/cm 3. The moisture content varied from 2.64 to %. ph varied from 7.32 to Calcium varied from to mg/kg. Chlorides varied from 43.9 to mg/kg. Sulphates varied from 29.4 to mg/kg. Sodium was found 438 to 1232 mg/kg. Potassium was found 260 to 1082 mg/kg. Organic matter varied from 3.52 % to 7.43 %. Iron varied from 0.94 to mg/kg SOIL CLASSIFICATIONS METHOD OF PREPARATION The soil classification map has been prepared by extracting the areas under different soil categories from the 1:500,000 scale maps prepared by National Bureau of Soil Survey and Landuse Planning (NBSS & LUP). The project site, towns and village locations have been added for ease of spatial reference. Locations of towns and villages have been extracted from CoI maps, SoI topographical maps and confirmed with satellite data DESCRIPTION OF SOIL CHARACTERISTICS AND AREA UNDER DIFFERENT SOIL TYPES Table 3.16 provides the soil type and area under different soils within a distance of 10 km from the project site SOIL CHARACTERISTICS MAP A map depicting the characteristics of major soil categories in the project area is presented in Figure 3.7. The map also marks the area within 5 km with project site as a centre. Town and village locations are also depicted to facilitate ease of reference. EIA Report Prepared By Aqua-Air Environmental Engineers Pvt. Ltd., Surat 101
102 TABLE 3.16 SOIL CHARACTERISTICS UNDER PROJECT AREA Mapp ing Categ ory B Area in (Sq km) Description Very deep, moderately well drained, fine soils on very gently sloping basalic interfluves with slight erosion; associated with deep well drained, calareous fine soils with slight erosion C 0.12 Very deep, moderately well drained, fine soils on very gently sloping basaltic interfluves with moderate erosion; associated with very deep, well drained, fine soils with moderate erosion Taxonom y1 Fine, montrmo rillonitic, hyperther mic Typic Chromust erts Fine, montmor illonitic, hyperther mic Typic Chromust ers Taxonom y2 Fine, montmor illonitic (calcareo us) hyperther mic Vertic Ustochre pts Fine, montmor illonitic, hyperther mic Vertic Ustochre pts Class Soils of west coast (soils of Gujarat plain) Soils of west coast (soils of Gujarat plain) Sub_Cl ass Soils of interflu ves Soils of interflu ves Soil Unit (Orde r) Vertis ol/ Incept isol Vertis ol/ Incept isol Physio graphy Very Gently sloping Very Gently sloping Depth Erosio n Very Deep- Deep Very Deep Slight Moder ate Draina ge Mod. Well Mod. Well Surfac e Textur e Fine Fine ph Salinity/ Alkalinit y Ne utr al Ne utr al Nil Calca reous ness Calca reous Fertility Medium Nil Nil Medium EIA Report Prepared By Aqua-Air Environmental Engineers Pvt. Ltd., Surat 102
103 D G H Very deep, moderately well drained, fine soils on nearly level alluvial plain with slight erosion and slight salinity; associated with deep, moderately well drained calcareous fine soils with slight erosion and slight salinity Very deep, moderately well drained, fine soils on very gently sloping alluvial plain with moderate erosion; associated with very deep, moderately well drained, fine soils on nearly level lands with slight erosion Very deep, moderately well drained, fine soils on neraly level Fine, montmor illonitic, isohypert hermic Vertic Ustropep ts Fine, montmor illonitic, hyperther mic Typic Chromust ers Fine, montmor illonitic, hyperther Fine, montmor illonitic (calcareo us), isohypert hermic Vertic Ustropep ts Fine, montmor illonitic, hyperther mic Vertic Ustochre pts Fine, montmor illonitic (calcareo Soils of west coast (soils of Gujarat plain) Soils of west coast (soils of Gujarat plain) Soils of west coast (soils of Soils of alluvial plains Soils of alluvial plains Soils of alluvial plains Incept isol Vertis ol Vertis ol Nearly level alluvial Very gently sloping Nearly level aluvial V.Deep -Deep Very Deep Very Deep Slight Sligt- Mod. Slight- Severe Mod. Well Mod. Well Mod. Well Fine Fine Soil Fine Soil Slig htly alka line Slig htly alka line Slig htly alka line Slight Salinity Calca reous Medium Nil Nil Medium Nil Nil Low- Medium EIA Report Prepared By Aqua-Air Environmental Engineers Pvt. Ltd., Surat 103
104 alluvial plain with slight erosion; associated with very deep moderately well drained, calcareous, fine soils on gently sloping lands with severe erosion J 1.36 Very deep, moderately well drained, fine soils on very gently sloping alluvial plain with moderate erosion and moderate salinity; associated with very deep, moderately well drained calcareous, fine soils with moderate erosion K 7.83 Moderately deep, moderately well drained, fine soils on nearly level alluvial plain with mic Typic Chromust erts Fine, montmor illonitic, isohypert hermic Typic Chromust erts Fine, montmor illonitic, isohypert hermic Typic us), hyperther mic Typic Chromust erts Fine, montmor illonitic, (calcareo us), hyperther mic Udic Chromust erts Fine, montmor illonitic, (calcareo us), isohypert Gujarat plain) Soils of west coast (soils of Gujarat plain) Soils of west coast (soils of Gujarat plain) Soils of alluvial plains Soils of alluvial plains Vertis ol Vertis ol Very gently sloping Nearly level Very Deep Mod. Deep- V.Deep Moder ate Slight Erosion Mod. Well Well- Mod. Fine Soil Fine Soils Slig htly alka line Slig htly alka line Moderat e Moderat e Nil Nil Low- Medium Medium EIA Report Prepared By Aqua-Air Environmental Engineers Pvt. Ltd., Surat 104
105 slight erosion and moderate salinity; associated with very deep, moderately well drained, calcareous, fine soils with slight erosion and slight salinity L 1.31 Very deep, moderately well drained, fine soils on nearly level alluvial plain with slight erosion and moderate salinity; associated with very deep, imperfectly drained, calcareous, very fine soils with slight erosion and moderate salinity Chromust erts Fine, montmor illonitic, isohypert hermic Typic Chromust erts hermic Udic Chromust erts Very-fine, montmor illonitic (calcareo us), isohypert hermic Udit Chromust erts Soils of west coast (soils of Gujarat plain) Soils of alluvial plains (Courtesy: Environmental Information Centre, New Delhi) Vertis ol Nearly level Very Deep Slight Erosion Weel Draine d- Fine Soils- V.Fine Soils Slig htly alka line Moderat e Nil Medium EIA Report Prepared By Aqua-Air Environmental Engineers Pvt. Ltd., Surat 105

106 FIGURE-3.7 SOIL CHARACTERISTICS MAP 3.6 GEOLOGICAL DATA METHOD OF PREPARATION The geological classification map has been prepared by extracting the areas under different geological classification from the 1:2 million scale maps prepared by Geological Survey of India (GSI) for the State of Gujarat. The map text has been modified in consultations with the Department of Geology, University of Delhi. The project site, towns and village locations have been added for ease of spatial reference. Locations of towns and villages have been extracted from CoI maps, SoI topographical maps and confirmed with satellite data. EIA Report Prepared By Aqua-Air Environmental Engineers Pvt. Ltd., Surat 106
107 3.6.2 DESCRIPTION OF GEOLOGICAL CLASSIFICATION AND AREA UNDER DIFFERENT FORMATIONS Geologically the area is monotonous with little variations. The alluvial deposits of the area belong to the Quaternary period and have almost the same history of sedimentation, basin characters and environments of deposition. The deposits have marginal variation in their composition and thickness. The alluvium shows ample evidences of neotectonism; the drainage courses are governed by structural dislocation and disturbed by the neotectonic activities. Table 3.17 provides the major geological features and area under different formations GEOLOGICAL MAP A map depicting the major geological features in the project area is presented in Figure 3.8. The map also marks the area within 10 km with project site as a centre. Town and village locations are also depicted to facilitate ease of reference. TABLE 3.17 DESCRIPTION OF GEOLOGICAL CLASSIFICATION AND AREA UNDER DIFFERENT FORMATIONS STRATIGRAPHY AREA (SQ. KM.) Q = Undifferentiated fluvial/ Aeolian/ coastal sediments N1k = Khari Formation Pg3b = Bermoti Formation AGE Holocene in Quaternary period (1 million year to recent) Miocene (23.8 to 5.3 million years) Oligocene (33.7 to 23.8 million years) DESCRIPTION Some gypsum deposits are found in these Quarternary sediments. High potential for yielding significant quantities of ground water. Comprises variegated siltstones, and grey gypseous marls deposited in a quiet epineritic basin. The upper part of this formation has yielded a rich assemblage of Miocene fossils. It unconformably overlies the Bermoti Formation. Poor potential for ground water. Comprises greenish grey marl, and argillaceous limestone succession with a basal bed of bouldery clayey marl. This bouldery bed characterizes the unconformity with the lower Berwali EIA Report Prepared By Aqua-Air Environmental Engineers Pvt. Ltd., Surat 107

108 Formation. Poor potential for ground water. Pg2b = Berwali Formation Eocene (54.8 to 33.7 million years) Comprises gypseous and ochreous clays, lignite, oolitic sandstone and marl. Contains fossils of Foraminifera and Molluscs in the lower part, overlain by dense fossiliferous fragmental limestone. Potential for ground water reserves may vary from poor to good, depending on the rock type encountered. (Courtesy: Environmental Information Centre, New Delhi) FIGURE-3.8 MAJOR GEOLOGICAL FEATURES EIA Report Prepared By Aqua-Air Environmental Engineers Pvt. Ltd., Surat 108
109 3.7 LAND USE PATTERN Land use, in general, reflects the human beings activities on land, whereas the word land cover indicates the vegetation, agricultural and artificial manmade structures covering the land surfaces. Identification and periodic surveillance of land uses and vegetation covers, in the vicinity of any developmental activity is one of the most important components for an environmental impact assessment, which would help determine the impact of the project development activity on the land use pattern METHOD OF DATA PREPARATION The land use / land cover has been presented in the form of a map prepared by using IRS P6 LISS-III and procured from the National Remote Sensing Agency (NRSA), Hyderabad. The satellite data has been processed using ERDAS Imagine software supported with ground checks and ground truth verification. Area and distance calculations have been carried out using GIS software after geo-referencing the interpreted data with the help of Survey of India (SoI) topographical maps of the scale 1:50,000. A map depicting major land use/ land cover classes comprising lands under agriculture, fallow land, open/degraded vegetation; lands falling under water bodies, scrub and lands under inhabitations is presented at Figure 3.9. The map also marks the area within 10 km of the project site as the area of interest. Land use and Land Cover with Towns and Village Locations A map depicting major land use/ land cover classes along with the village locations in the area of coverage is presented at Figure The land use classification within a distance of ten kilometers from the project location and the areas falling under the respective classifications are as per the following: EIA Report Prepared By Aqua-Air Environmental Engineers Pvt. Ltd., Surat 109
110 Process Methodology Procurement of Satellite Imagery Preparation of Base Map using topographical maps Data Preparation - Radiometric correction - Geometric correction Pre field process First Level Classification Preparation of Signature Confusion Matrix Field Verification/Ground Truth Field process Second Level Classification Updated information from field Post field process Map Output Area Estimation Accuracy Estimation EIA Report Prepared By Aqua-Air Environmental Engineers Pvt. Ltd., Surat 110

111 TABLE 3.18 AREAS UNDER DIFFERENT LANDUSE SR. NO. LANDUSE CLASSIFICATION AREA WITHIN 10 KM OF PROJECT LOCATION 1 Agriculture Fallow Land Habitation, Settlement Marshy Land Miscellaneous Land Degraded Vegetation Water Open & Barren Land River Total (Courtesy: Environmental Information Centre, New Delhi) PERCENTAGE OF TOTAL AREA FIGURE 3.9 LANDUSE / LANDCOVER EIA Report Prepared By Aqua-Air Environmental Engineers Pvt. Ltd., Surat 111

112 FIGURE 3.10 LANDUSE / LANDCOVER WITH VILLAGE LOCATIONS 3.8 ECOLOGICAL INFORMATION INTRODUCTION Bharuch is located approximately 70 km from Vadodara, on the banks of river Narmada, and is often referred to as Kanam Pradesh Land of Black Soil, due to its black cotton soil. However, it is this rich quality of this soil that has made Bharuch one of the leading cultivators and exporters of cotton in the country today. This fact also adds up to the ecological diversity of the district. This very old town was mentioned in historical records nearly 2000 years ago. In the 17th century, English and Dutch factories were established here. On the riverbank, outside the city to the east, is the Temple of Bhrigu Rishi, from which probably the city took its name, Bhrigu-ka-chba, later shortened to Bharuch. EIA Report Prepared By Aqua-Air Environmental Engineers Pvt. Ltd., Surat 112
113 Rodgers and Pawan (1988) have classified India based on its biogeography (distribution and affinities of flora and fauna) into 10 distinct bio-geographic zones and further into 26 biotic provinces. According to this, Gujarat has representation of four bio-geographic zones and five biotic provinces. Panoli of Bharuch district falls under Zone 5 - the Western Ghats: Province 5A - Malabar Coast, central alluvial plains of Gujarat mainland PHYSIOGRAPHY The region provides a combination of most of the geo-environmental features for the development of favorable ecosystems. The alluvial sediments and reasonable water resources have provided impetus towards developing human induced ecosystems of agricultural cropping agro-forestry and horticulture. The elevation range of the region is about 20 m showing a very gentle flat gradient of 1:800 to 1:1000. The region shows more or less a flat topography with a series of sections cut by deeply incised channels of rivers flowing across the region. The river banks are generally marked by levee deposits, creating a ridge type banks with higher elevations than the general ground level. The flat topography is dotted by low height sandy mounds of stabilized dunes. Formation of ravine landscape is quite common on most of the river banks due to deep gully erosion. The rivers are prone to heavy floods and land erosion FOREST Bharuch area is characterized by tropical dry deciduous forests. The total forest area of district is sq.km. That accounts for 0.73 % of the total geographical area of the district. The nearest forest patch is Ratanpur Reserve Forest, which is about km from the project area. (Source: Forest Department, Government of Gujarat). EIA Report Prepared By Aqua-Air Environmental Engineers Pvt. Ltd., Surat 113
114 3.8.4 FLORA Some of the flora found in Bharuch area is listed below: TABLE 3.19 LIST OF FLORA RARE FLORA IN BHARUCH AREA NAME FAMILY Ammannia desertorum Lythraceae Astragalus proxilus Fabaceae Indigofera caerulea Papilionaceae Ipomoea kotschyana Convolvulaceae Solanum incannum Solanaceae Tephrosia jamnagarensis Fabaceae (Source: Red Data Book, BSI) (Courtesy: Environmental Information Centre, New Delhi) TABLE: 3.20 COMMON FLORA IN BHARUCH AREA Sr. No. Scientific Name Common Name Family I Trees 1 Acacia Aurriculifarmis Bangali Babool Mimoceae 2 A. Leucopholia Aniar Mimoceae 3 A. Catechu Khair Mimoceae 4 A. Ferrungula Pandhara Khair Mimoceae 5 A. Nilotica Babul Leguminoceae 6 A. Lebbeck Siris Leguminoceae 7 A. Procera Siris Leguminoceae 8 A. Polycantha Garad Mimoceae 9 Adina Cordifolia Hed Rubiaceae 10 Aegle Marmelos Bela Rutaceae 11 Ailanthus Excelsa Maharukh Simaroubaceae 12 Alangium Salvifolium Ankol Alangiaceas 13 Albizia Odoratissimus Siris Leguminoceae 14 Annogeissus Latifolia Dhavda Combritaceae 15 Annona Squamosa Sitafal Annonaceae 16 Azardirachta Indica Nim Moraceae 17 Bahuania Purpurea Kachamar Leguminosae EIA Report Prepared By Aqua-Air Environmental Engineers Pvt. Ltd., Surat 114
115 18 Bombax Ceiba Semal Verbenaceae 19 Bridelia Retusa Asta (Kathmohli) Leguminosae 20 B. Squamosa Asan Leguminoceae 21 Buchanania Lanzan Charoli Anacardiaceas 22 Butea Monospesma Palas Leguminoceae 23 Callistemon Lancealatus Bottlebrush Mytraceas 24 Casuarina Equisetifoier Sura Casuarineae 25 Careya Arborea Kumbh Mytraceae 26 Casearia Elliptica Manjo Symydaceae 27 Caesearia Graveoiens Dedak Manio Samidacea 28 Cassia Fistula Sunari Leguminoceae 29 Cestrum Noctusnum Ralkirani Solana Ceae 30 Cochiospermum Religiosun Ganeri Cochlospermaceds 31 Cocas Nicifera Nariyal Palmeae 32 Cordia Dichotoma Gundi Boranginacea 33 Dalbergia Paniculata Dhobin Leguminoceae 34 D. Latifolia Sisso Leguminoceae 35 Murraya Koenigii Karlilimb Rata Ceae 36 Ixora Parviflora Kara Rubiaceae 37 I. Nigricans Kukeri Rubiaceae 38 Delonix Elala Gulmohar Leguminoceae 39 Diosphyros Melanoxylon Tendu Ebenaceae 40 Dolichandrone Falcate Mallar Sing Bignoniaceae 41 Elaeodendron Roxburghii Alinar Ceiastracea 42 Eucalyptus Globules Safeda Eucalyptaceae 43 Emblica Officinalis Aonla Euphobiaceae 44 Erithina Uliginosa Pungara Leguminoceae 45 Eramphis Uliginosa Almi Rubiaceas 46 Ficus. Religiosa Pipal Moraceae 47 F. Rumphii Pilari Moraceae 48 F. Benghalensis Bara Moraceae 49 Flacourtia Indica Rankdi Bixaceae 50 Garua Pinnata Kakad Burseraceae 51 Griwia Teliaefolia Dhaman Tiliaceae 52 Haidwickia Bipinnata Aniar Caesalpiniacea 53 Holoptelia Intigrifolia Valva Uticaceae 54 Kydia Calycina Bhindi Malvaceae 55 Lagerstroemia Lanceolata Nano Leguminoceae 56 L. Parviflora Sidha Leguminoceae 57 Michellia Champaca Champa Bignoneaceae 58 Lannea Caromadalica Modad Anacardiaceae 59 Madhuca Indica Mahua Sapotaceae 60 Mangifera Indica Amm Anacardiaceae 61 Miliusa Tomentosa Gulambh Annonacea 62 Milligntonia Hortensis Indian Coral Tree Bignoniaceae EIA Report Prepared By Aqua-Air Environmental Engineers Pvt. Ltd., Surat 115
116 63 Mitragyna Parvifolia Kalam Rubiaceae 64 Michelia Champaca Champa Magnoliaceae 65 Moringa Oliefera Shevga Moringaceae 66 Musa Paradisiacea Kela Musaceae 67 Oroxyium Indicum Tetu Bignoniaceae 68 Phoenix Sylvestris Shindi Palminae 69 Prosopis Juliflora Babul Mimoceae 70 P. Cinerarea Babul Mimoceae 71 Pithecelobium Ducle Chisbalai Leguminoceae 72 Pongamia Pinnata Karanja Leguminoceae 73 Pisidium Guajava Guava Mutraceae 74 Pterocarpus Marsupium Bija Leguminoceae 75 Punica Grantalum Anar Pomegrannatae 76 Sapindus Emerginatus Aritha Sapindaceae 77 Soymida Febrifuga Rohan Meliaceae 78 Poleathia Langifolia Ashok Apoctnaceae 79 Saraca Indica Ashok Apoctnaceae 80 Thevetia Neirifolia Pilakanton Apoctnaceae 81 Sterculia Urens Kodaya Sterculiaceae 82 Syzygium Cuminii Jamun Myrtaceae 83 Terminalia Crenulata Sadad Leguminoceae 84 T. Bellirica Behada Combretaceae 85 T. Arjuna Arjun Combretaceae 86 T. Caltapa Jangli Badam Combretaceae 87 Tamarindus Indica Tentuli Leguminoceae 88 Tecoma Stans Nellow Bell Bisgnonia Ceae 89 Tectona Grandis Sag Verbanaceae 90 Trema Orientalis Gol Ulmaceae 91 Wrightia Tinctoria Kudo Apocynacea 92 Zizyphus Xylocarpus Ghatbor Rhamnaceae 93 Z. Mauritiana Bordi Rhamnaceae Shrubs 1 Argemone Mexicana Darudi Papaveraceae 2 Caranthus Resus Sudufuli Apocyanaceae 3 C. Calatropis Mundar Asclepiadaceae 4 Calatopis Gigantean Rui Asclepiadaceae 5 Carrissa Carandas Karvand Apocyaninnae 6 Clerodendrum Multyfolium Multaiforum Verbenaeae 7 Gymnosporia Spinosa Spinosa Rekii Leguminoceae 8 Lantana Camera Ghaneri Verbanaceae 9 Opuntia Dillenii Nivdang Cactacealea 10 Euphorbia Nerifolia Wavding Celastraceae 11 Ocium Gratissium Rantulro Labiateae 12 Helicteries Isora Atai Sterculiaceae 13 Ficus Hispida Tet Umaro Moraceae EIA Report Prepared By Aqua-Air Environmental Engineers Pvt. Ltd., Surat 116
117 14 Datura Fastuasa Dhotara Solanaceae 15 Vitex Negundo Nirgudi Verbaceae 16 Cassia Tora Tarota Leguminoceae 17 Zizyphus Nummularia Beri Rhannaceae 18 Euphorbia Tirucolli Thor Euphorbiaceae Bamboos 1 Dendrocalamus Strictus Manvel Grammineae 2 Abrus Precatorius Gunj Leguminoceae 3 Capparis Sepiraria Lamtjar Cappariaceae 4 Cocculus Hirrutus Asanwel Menispermaceae 5 Combretum Ovalifolium Jal Combratae 6 Cayratia Carnosa Khatumbo Vitaceae Grasses 1 Andropogon Pumilus Kusal Gramineae 2 Cenchrus Setgerus Dhramnu Gramineae 3 Cynodon Dactylon Durva Gramineae 4 Cymbopogen Marinil Rosha Gramineae 5 Heteropogon Contortus Gawat Gramineae 6 Sorghum Halepense Baru Gramineae 7 Themeda Triandra Bhathdu Gramineae Crops 1 Ricinus Communis Arand Euphorbiaceae 2 Saccharum Officinarum Ganna Gramineae 3 Sorghum Vulgae Jowar Gramineae 4 Zea Mays Makea Gramineae 5 Arachis Hypogaea Ground Nut Logumin 6 Oryza Sativa Chawar Gramineae Macrophytes 1 Eichhornia Crassipes Jalkumbhi Pontederiace 2 Ipomea Aqualica Kalmisay Volvulaceae 3 Trapa Latifolia Water Chestnual Volvulaceae 4 Nelumbo Nucifera Lotus Nymphaceae 5 Azolla Pinnata Common Duckweed Lemnaceae Source: Vegetation survey and data from State Forest Dept. Bharuch Gujarat EIA Report Prepared By Aqua-Air Environmental Engineers Pvt. Ltd., Surat 117
118 3.8.5 FAUNA TABLE 3.21 LIST OF FAUNA Sr. No. Scientific Name Common Name Family 1 Acridothers tristis Common myna Sturnidae 2 A. ginginianus Bank myna Sturnidae 3 Athene brama Spotted owlet Striginae 4 Aegithina tiphia Common Lora Lrenidae 5 Ardeola grayee Pond Heron Ardeidae 6 Amaurornis phoenicurus Whitebrested Waterhen Phasinidae 7 Babulcus ibis Cattle Egret Ardeidae 8 Centropus cinensis Crow-phesant Cuculidae 9 Columba livia Blue Rock Pigeon Columidae 10 Corvus splendens House Crow Carvidae 11 Coracious benghalensis Indian Roller Coracidae 12 Dicrurus adsimilis Black Drongo Dieruridae 13 Dinophum benghalense Goldenbacked Woodpecker Picidae 14 Eudynamys scolopacea Koel Cuculidae 15 Fracolinus francollinus Black partiridge Pharianidae 16 Halcyon rustica Whitebrested Kingfisher Aicenidae 17 Hirundo rustica Common swallow Hirundinidae 18 Lanius exubitor Grey Shrike Daniidae 19 Launchura malabarica Whitethroated munia Estrildinae 20 Megalaima rubricapilla Smallgreen barbet Capilonidae 21 M. malabarica Crimsonbrestwd Barbet Capilonidae 22 Merops orientalis Littlegreen Bea-eater Miropidae 23 Milvus migrans Patih Kite Accipitridae 24 Motacilla maderatensis Large pied wagtail Motacillidae 25 Nactarinia asiatica Purplerumpled sunbird Nectarinidae 26 Nectarinia minima Small sunbird Nectarinidae 27 Oriolus oriolus Golden Oriole Oriolidae 28 Orthotomus sutorius Tailor Bird Pachycephaline 29 Passer domesticus House Sparrow Passerinae 30 Psittacula cyanocephala Blossamheaded parakeet Psittacidae 31 Pycnonotus caffer Redvented bulbul Pycnonotidae 32 Ploceus philipinensis Weaver bird Plocidae 33 Sexicoloides fulicate Indian Robin Corvidae 34 Sopsychus saularis Magpie Robin Corvidae 35 Streptopelia chinensis Spotted dove Columbidae 36 S. senegalensis Little brown dove Columbidae 37 Sternus pagodramus Brahiminy myna Sternidae 38 Turdoides caudatus Common Babbler Muscicapidae EIA Report Prepared By Aqua-Air Environmental Engineers Pvt. Ltd., Surat 118
119 39 Upupa epops Hoopoe Upupidae 40 Vanellus indicus Redwattled Lapwing Jacanidae 41 Metopidius indicus Brongewinged jacana Jacanidae 42 Ardea alba Large egrd Ardeidae 43 A. cinerea Grey Heron Ardeidae 44 Falica atra Coot Rallidae 45 Phalacrocorax niger Little cormorant Phalacrocoracidae 46 Muntiacus Muntjak Barking deer Bovidae 47 Falis Chaus Jungle cat Falidae 48 Myaena Hyaena The striped hyana Canidae 49 Presbytis Entellus Hanuman langur colobinae Source: Survey of Avifauna under the study area. 3.9 SOCIO - ECONOMIC ENVIRONMENT An assessment of socio - economic environment forms an integral part of an EIA study. Therefore, baseline information for the same was collected during the study period. The baseline socio - economic data collected for the study region, before the proposed is operational, has been identified for the four major indicators viz. demography, civic amenities, economy and social culture. The baseline status of the above indicators is compiled in forthcoming sections SETTLEMENTS AND DEMOGRAPHIC PATTERN METHOD OF DATA PREPARATION The land use/land cover has been presented in the form of a map prepared by using the IRS- P 6 LISS-III, procured from the National Remote Sensing Agency (NRSA), Hyderabad. The satellite data has been processed using ERDAS Imagine software supported with ground checks and ground truth verification wherever required. Area and distance calculations have been carried out using GIS software after geo-referencing the interpreted data with the help of SoI topographical maps of 1:50,000 scale DEMOGRAPHIC DATA WITHIN THE REGION OF INTEREST Table 4.4 provides the data on inhabitations falling within 10 km distance from the project site. On an average, Taluka: Ankleshwar has population density of about 198 persons per sq. km. (2001 Census data), 238 persons per sq. km. (2011 Census data), compared to the EIA Report Prepared By Aqua-Air Environmental Engineers Pvt. Ltd., Surat 119
120 Bharuch District, which has a population density of about 210 persons per sq. km. (2001 Census data), 238 persons per sq. km. (2011 Census data). Population density within 10 km radius of the site is only 498 persons per sq. km. (2011 Census data), while population density within 5 km radius of site is 293 persons per sq. km. (2011 Census data). The population details (i.e. population distribution and population density) of the Taluka Ankleshwar, District Bharuch and the study area within 10 km radius and 5 km radius are given in Table And their graphical representations are shown in Figure TABLE 3.22 Sr. No. DEMOGRAPHIC DATA Village Name CD Block Name No. of Household Total Population Total Male Total Female Population <06 years Male<06 years Female<06 years 1 Sanjali Ankleshwar Panoli Ankleshwar Kharod Ankleshwar Kapodara Ankleshwar Bhadkodara Ankleshwar Kosamadi Ankleshwar Bakrol Ankleshwar Alonj Ankleshwar Bhadi Ankleshwar Ravidra Ankleshwar Umarwada Ankleshwar Karmali Ankleshwar Bharan Ankleshwar Boidara Ankleshwar Amboli Ankleshwar Piraman (Part) Ankleshwar Nangal Ankleshwar Adol Ankleshwar Hajat Ankleshwar Piludara Ankleshwar Telva Ankleshwar Pardi Idris Ankleshwar Adadara Ankleshwar Utiyadara Ankleshwar Jitali Ankleshwar Dodwada Ankleshwar Siludi Ankleshwar Hathuran Mangrol Dhamdod Mangrol Dinod Mangrol Boridara Mangrol Nandav Mangrol Moti Pardi Mangrol Nana Borsara Mangrol Mahuej Mangrol Ghodadara Hansot Kondh Valia (Courtesy: Census of India 2011) EIA Report Prepared By Aqua-Air Environmental Engineers Pvt. Ltd., Surat 120
121 TABLE 3.22 (CONTD..) Sr. No. DEMOGRAPHIC DATA Village Name CD Block name Population Schedule caste Male Schedule caste Female Schedule caste Population Schedule tribe Male Schedule tribe Female Schedule tribe 1 Sanjali Ankleshwar Panoli Ankleshwar Kharod Ankleshwar Kapodara Ankleshwar Bhadkodara Ankleshwar Kosamadi Ankleshwar Bakrol Ankleshwar Alonj Ankleshwar Bhadi Ankleshwar Ravidra Ankleshwar Umarwada Ankleshwar Karmali Ankleshwar Bharan Ankleshwar Boidara Ankleshwar Amboli Ankleshwar Piraman (Part) Ankleshwar Nangal Ankleshwar Adol Ankleshwar Hajat Ankleshwar Piludara Ankleshwar Telva Ankleshwar Pardi Idris Ankleshwar Adadara Ankleshwar Utiyadara Ankleshwar Jitali Ankleshwar Dodwada Ankleshwar Siludi Ankleshwar Hathuran Mangrol Dhamdod Mangrol Dinod Mangrol Boridara Mangrol Nandav Mangrol Moti Pardi Mangrol Nana Borsara Mangrol Mahuej Mangrol Ghodadara Hansot Kondh Valia (Courtesy: Census of India 2011) EIA Report Prepared By Aqua-Air Environmental Engineers Pvt. Ltd., Surat 121
122 TABLE 3.23 POPULATION DENSITY Name Population (Persons) Population Density (Person / sq. km.) Sex ratio (No. of females per 1000 males) Taluka Ankleshwar (2001) Taluka Ankleshwar (2011) District Bharuch (2001) District Bharuch (2011) Within 5 km Radius (2011) Within 10 km Radius (2011) (Courtesy: Census Dept., GOI) FIGURE-3.11 POPULATION DENSITY Details of Population Density Population Density Within 5 km Radius (2011) Within 10 km Radius (2011) Taluka Ankleshwar (2001) Taluka Ankleshwar (2011) District Bharuch (2001) District Bharuch (2011) Locaiton 930 Details of Sex Ratio Sex Ratio Within 5 km Radius (2011) Within 10 km Radius (2011) Taluka Ankleshwar (2001) Taluka Ankleshwar (2011) District Bharuch (2001) District Bharuch (2011) Location EIA Report Prepared By Aqua-Air Environmental Engineers Pvt. Ltd., Surat 122
123 LITERACY RATE The literacy rate is a major factor, which influences the socio-cultural condition of a particular place. Details of literacy rate in District Bharuch, Taluka Ankleshwar and within 10 km radius and 5 km radius of project site are given in Table 3.21 while their graphical representation is shown in Figure It is observed that the literacy rate in Bharuch District as per 2001 Census data is as percentage of literate population to the total population, with 83.43% among male and 65.42% among female. Literacy rate in Bharuch District, as per 2011 Census data is 72.09%, with 77.33% among male and 66.45% among female. Literacy rate in Taluka Ankleshwar as per 2001 Census data is 79.07% with 86.13% among males and 70.91% among females. Literacy rate in Taluka Ankleshwar as per 2011 Census data is 75.38% with 79.51% among males and 70.69% among females. Within 10 km radius of the study area, the literacy rate is observed 72.02% having 76.57% among males and 67.10% among females, whereas literacy rate within 5 km radius of study area is 71.14% having 75.24% among males and 66.66% among females. TABLE 3.24 LITERACY RATE Name Male Literacy (%) Female Literacy (%) Total Literacy (%) Within 5 km Radius (2011) Within 10 km Radius (2011) Taluka Ankleshwar (2001) Taluka Ankleshwar (2011) District Bharuch (2001) District Bharuch (2011) (Courtesy: Census Dept., GOI) EIA Report Prepared By Aqua-Air Environmental Engineers Pvt. Ltd., Surat 123
124 TABLE 3.24 (CONTD.) Sr. No. LITERACY RATE Village Name CD Block name (Courtesy: Census of India 2011) Population Literate Male Literate Female Literate Population Illiterate Male Illiterate Female Illiterate 1 Sanjali Ankleshwar Panoli Ankleshwar Kharod Ankleshwar Kapodara Ankleshwar Bhadkodara Ankleshwar Kosamadi Ankleshwar Bakrol Ankleshwar Alonj Ankleshwar Bhadi Ankleshwar Ravidra Ankleshwar Umarwada Ankleshwar Karmali Ankleshwar Bharan Ankleshwar Boidara Ankleshwar Amboli Ankleshwar Piraman (Part) Ankleshwar Nangal Ankleshwar Adol Ankleshwar Hajat Ankleshwar Piludara Ankleshwar Telva Ankleshwar Pardi Idris Ankleshwar Adadara Ankleshwar Utiyadara Ankleshwar Jitali Ankleshwar Dodwada Ankleshwar Siludi Ankleshwar Hathuran Mangrol Dhamdod Mangrol Dinod Mangrol Boridara Mangrol Nandav Mangrol Moti Pardi Mangrol Nana Borsara Mangrol Mahuej Mangrol Ghodadara Hansot Kondh Valia EIA Report Prepared By Aqua-Air Environmental Engineers Pvt. Ltd., Surat 124
125 FIGURE-3.12 LITERACY DATA Literacy Rate Literacy Rate (%) Within 5 km Radius (2011) Within 10 km Radius (2011) Taluka Ankleshwar (2001) Taluka Ankleshwar (2011) District Bharuch (2001) District Bharuch (2011) Male Literacy(%) Female Literacy(%) Total Literacy (%) Location OCCUPATIONAL STRUCTURE In economic development of the region its geographical location, natural resources, business and employment, industries and manpower play vital role. Table 3.25 provides the occupational patterns in all villages falling within the area of interest. TABLE 3.25 Sr. No. Village Name OCCUPATIONAL STRUCTURE CD Block name Total Work Population Main worker Population Main Cultivator Population Main Agriculture Population Main Household Population Main Other Population Marginal Worker Population Non Worker Population 1 Sanjali Ankleshwar Panoli Ankleshwar Kharod Ankleshwar Kapodara Ankleshwar Bhadkodara Ankleshwar Kosamadi Ankleshwar Bakrol Ankleshwar Alonj Ankleshwar Bhadi Ankleshwar Ravidra Ankleshwar Umarwada Ankleshwar Karmali Ankleshwar Bharan Ankleshwar Boidara Ankleshwar Amboli Ankleshwar Piraman (Part) Ankleshwar Nangal Ankleshwar Adol Ankleshwar EIA Report Prepared By Aqua-Air Environmental Engineers Pvt. Ltd., Surat 125
126 19 Hajat Ankleshwar Piludara Ankleshwar Telva Ankleshwar Pardi Idris Ankleshwar Adadara Ankleshwar Utiyadara Ankleshwar Jitali Ankleshwar Dodwada Ankleshwar Siludi Ankleshwar Hathuran Mangrol Dhamdod Mangrol Dinod Mangrol Boridara Mangrol Nandav Mangrol Moti Pardi Mangrol Nana Borsara Mangrol Mahuej Mangrol Ghodadara Hansot Kondh Valia (Courtesy: Census of India 2011) AMENITIES Infrastructure resource base of the surveyed villages with reference to education, medical, water resources, post and telegraph, communication, power supply is presented in Table There are 35 villages within study area of 10 km radius of plant site. Significant observations with respect to availability of amenities in study area are as follows. All of the villages have primary schools, 3 villages have both primary and secondary education schools. 8 villages have adult education facility. 20 villages in the impact zone have community health workers, 12 villages have primary health sub centre, 4 villages have registered private practitioners while 5 villages have family planning center, 2 villages have primary health center. One maternity home, four child welfare centers, one nursing home, two dispensaries and one hospital are also available in the impact zone. In the study area drinking water facilities are good as tap water and well water is available almost in all the villages, 4 villages have hand pumps. Tank water is available in 10 villages, 2 villages get water from tube well, 5 from canal and one from Nallah. Post office facility is available in 27 villages while one village has post and telegraph facility. Telephone facility is available in 17 villages. 35 villages are well connected through a network of Pucca road. 30 villages have Kuccha approach road. Bus is the main mode of transportation and is available EIA Report Prepared By Aqua-Air Environmental Engineers Pvt. Ltd., Surat 126
127 in 38 villages, while 4 villages are connected with railways. All the villages get electricity for all purpose i.e. domestic, agriculture and industrial. TABLE 3.26 DETAILS OF AMMENITIES AVAILABLE IN STUDY AREA Taluka Village Educational Medical Drinking Water Post & Telegraph Commu nicatio n Approach to Village Nearest Town Ankleshwar Bharan P(2) CWC, PHS T, W PO BS PR, KR Kosamba- 8 EA Amboli P(2) -(- 5 KMS.) W, TK PO, Phone BS PR, KR Ankleshwar-1 EA Boidara P(2) -(- 5 KMS.) T, W PO, Phone BS PR, KR Ankleshwar-1 EA Nangal P(2) CHW T, W PO, Phone BS PR, KR Ankleshwar-6 EA Hajat P(2), Ac -(- 5 KMS.) T, W PO, Phone BS PR, KR Ankleshwar-12 EA Adol P(2) PHS, FPC, T, W PO BS PR, KR Ankleshwar-11 EA CHW Umarwada P(3), O PHS, RP T, W, HP PO, Phone BS PR, KR Ankleshwar-6 EA Kapodara P(2),O PHS, CHW, T, W PO, Phone BS PR Ankleshwar-7 EA FPC Bhadkodara P(2) CHW T, W PO, Phone -(- 5 KMS.) PR, KR Ankleshwar-7 EA Piraman P(3), Tr, O PHS T, W PO, Phone BS PR, KR Ankleshwar-1 EA Kosamadi P(6), O PHS, RP(3) T, W, HP PO, Phone BS PR, KR Ankleshwar-12 EA Bakrol P(2) CHW T, W, HP -(-5 KMS) BS PR, KR Ankleshwar-8 EA Sanjali P(2), O CHW T, W PO, Phone BS, RS PR, KR Ankleshwar-10 EA Alonj P(2), O CHW T, W, HP PO BS PR, KR Ankleshwar-15 EA Piludara P(2) -(10+ KMS) T, W PO, Phone BS PR Ankleshwar-13 EA Telva P(2), Ac, O CHW T, W -(-5KMS) BS PR Ankleshwar-16 EA Pardi Idris P(2) CHW T, W Po BS PR, KR Ankleshwar-12 EA Adadara P(2) CHW T, W -(-5 KMS.) BS PR Kosamba-7 EA Utiyadara P(2) -(-5 KMS) T, W -(-5 KMS) BS PR Kosamba-3 EA Karmali P(2),O -(-5 KMS) T, W Phone BS PR Ankleshwar-13 EA Ravidra P(2), O PHC, CHW T, W PO, Phone BS PR Ankleshwar-10 EA Panoli P(3), H, O H, MH, CWC, PHS, D, FPC, NH, RP, SMP, CHW T, W PTO, Phone BS, RS PR Ankleshwar-10 EA Kharod P(3), H, O CWC, PHC, T, W PO, Phone BS PR, KR Ankleshwar-10 EA CHW Bhadi P(2), O -(-5 KMS) T, W PO BS PR, KR Ankleshwar-12 EA Jitali P (3), H, AC PHC, RP, T, W, HP PO, PHONE BS PR, KR Ankleshwar-10 EA (4), O SMP, CHW Dodwada P(2) PHS, FPC, T, W PO BS PR, KR Ankleshwar-11 EA CHW Siludi P(2) CHW T, W, HP -(-5 KMS) BS PR, KR Ankleshwar-8 EA Mangrol Hathuran P(3), Ac(3) PHS T, W, TK, PO, Phone BS, RS PR, KR Kosamba-5 EA TW, C Power Supply EIA Report Prepared By Aqua-Air Environmental Engineers Pvt. Ltd., Surat 127
128 (Courtesy: Census Dept., GOI) TABLE : 3.27 ABBREVIATIONS Nana Borsara P, Ac -(5-10 kms) T, W, TK -(-5 KMS.) -(- 5KMS) KR Kosamba-5 EA Dhamdod P, Ac, O CHW T, W, TK PO BS PR, KR Kosamba-5 EA Nandvav P, Ac(2) PHS, CHW T,W, TK, PO BS PR, KR Kosamba-10 EA C, N Moti Pardi P, Ac CWC, CHW T, W, TK, -(5-10 BS PR, KR Kosamba-16 C Kms) Dinod P PHS, FPC, T, W, TK PO BS KR Kosamba-8 EA CHW Boridara P CHW T, W, TK PO BS KR Kosamba-15 EA Mahuej P, Ac(2), O PHS T, W, TW, TK, C PO, Phone BS PR, KR Surat-31 EA Hansot Ghodadara P(2), O CHW T, W, TK, PO BS PR, KR Ankleshwar-8 EA C Valia Kondh P(4), H, O PHS, D, FPC, RP, CHW T, W PO BS PR, KR Ankleshwar-12 EA 1. Education P-Primary Elementary School H-Matriculation or Secondary O-Other Educational Institution PUC-Higher Secondary/Intermediate/pre- University/junior College Ac- Adult Literacy Class Tr-Training School 3. Drinking Water T-Tap Water HP-Hand Pump TK-Tank Water W-Well Water R-River Water C-Canal N - Nallah 2. Medical Facilities RP-Registered Private Practitioner PHS-Primary Health Sub-Centre FPC-Family Planning Centre PHC-Primary Health Centre D- Dispensary CHW - Community Health Worker/Health Worker H - Hospital NH - Nursing Home MH - Maternity Home PHC - Public Health Centre CWC - Child Welfare Centre TB - T.B Clinic O Others 4. Post & Telegraph PO-Post Office PTO-Post & Telegraph Phone-Telephone Communication EIA Report Prepared By Aqua-Air Environmental Engineers Pvt. Ltd., Surat 128
129 S Spring TW- Tube well Water 5. Communication BS-Bus Station NW-Navigable Waterway 7. Power Supply EA-Electricity for all purposes EAG - Electricity for Agriculture ED - Electricity for domestic EO - Electricity for other purpose like Industrial, Commercial etc. 6. Approaches to Village PR-Pucca Road KR-Kuchcha Road GROUND WATER HYDROLOGY Introduction Geology: Geologically the major part of the state is covered by hard rock comprising of gneisses, schists, phyllites, sand stone and basalt. Remaining area in the north and central is occupied by the soft rock including coastal alluvium. District Bharuch is mainly occupied by the soft rocks like alluvium, tertiary in the north but as we move to the south the district is covered with hard rocks and few hilly areas. Hydrology: Hydrologically the areas have soft rock aquifers with dug wells at the depth of 10 to 25m, and tube wells at the depth of 50 to 100m. The level of ground water productivity of this type of rocks are mapped by violet colour, the difference in the discharge is shown through the difference in the intensity of the colour (light colour discharge-ipm) 200 to 300 in dug wells and 400 to 60 ipm in the tube well, and dark shade shows the discharge to 200 to 300 ipm in dug wells and 600 to 1200 ipm in tube wells. The hard rock aquifers dug well are found at the depth of 10 to 25m and bore well at the depth of 100 to 200m. The areas with extensive hard rock aquifers where pores space of rocks have secondary permeability are called fractured permeability. The intensity can be measured through the darkness in the colour, that is green which is used to map the hard rock aquifers, the discharge varies from 60 to 150 ipm in dug wells areas, 100 to 300 ipm in bore wells. Groundwater Utilization (Critical Blocks) Based on state of groundwater development, the various blocks/talukas in a district are categorised as over-exploited, critical, semi critical & safe categories. In case, where annual EIA Report Prepared By Aqua-Air Environmental Engineers Pvt. Ltd., Surat 129

130 groundwater withdrawals are more than 100% of the annual recharge availability, it is categorised as over-exploited, meaning that all the annually replenishable groundwater is already being used up. In cases of talukas, where the annual withdrawals are in the ranges of 90% to 100%, in relative to the annual available groundwater recharge, they are categorised as critical blocks. The talukas/blocks, in which the range is 70 % to 90%, are categorised as semi critical. The safe category of talukas/blocks has stage of groundwater development below 70% in relative to annual recharge availability. EIA Report Prepared By Aqua-Air Environmental Engineers Pvt. Ltd., Surat 130
131 3.10 Drainage Pattern The main rivers of Bharuch district are Narmada, Kim, Kavar, Amaravati and Dhadhar. Eastern part of the district and particularly some portion of Jhagadiya taluka are hilly, while remaining portion is plain and flat. Bharuch district includes 8 talukas - Jambusar, Amod, Vaghara, Bharuch, Ankleshwar, Hansot, Valia and Jhagadiya. Hydrology: The geology of the district with vast area affected by inherent/coastal salinity, presents a complex hydrogeological pattern. Hydrogeological map is shown in fig the hard rocks, the semi-consolidated Cretaceous, and Tertiary formations and unconsolidated alluvial deposits, all comprise multi aquifer systems thereby presenting unconfined as well as confined groundwater conditions in the entire district. Tertiary formations are inherently saline and contain poor quality of groundwater. Groundwater occurs under unconfined conditions in the limestone and sandstone aquifers of Bagh beds. Occurrence and movement of groundwater is restricted mainly to the fractures and joints in the limestone and sandstones. The Bagh beds, where overlain by Deccan Trap are likely to yield groundwater under confined conditions. The Deccan Trap has given rise to multi-layered stratified aquifers. Each individual flow comprises two distinct units, namely the upper vesicular basalt and the lower massive basalt. The massive basalt is hard and compact with primary porosity but the vesicular basalts exhibit porosity. The movement of groundwater is therefore controlled by the secondary porosity developed by the presence of fractures and joints. The paleo-weathering which is invariably observed at depth near the top of every flow has given rise to good aquifers at depth. The sandstone is the main aquifers in the Tertiary formations but the limestone also yield significant quantities of groundwater wherever karstic development have taken place. The alluvium formations in the western most part of the area do not constitute potential aquifers on account of inferior quality of water. EIA Report Prepared By Aqua-Air Environmental Engineers Pvt. Ltd., Surat 131
132 FIGURE DRAINAGE PATTERN (BHARUCH REGION) EIA Report Prepared By Aqua-Air Environmental Engineers Pvt. Ltd., Surat 132
133 M/s. Infinity Research & Development FIGURE (CONT'D.) DRAINAGE PATTERN (PANOLI REGION) Panoli Region Prepared By: Aqua-Air Environmental Engineers Pvt. Ltd., Surat 133
134 CHAPTER 4: Anticipated Environmental Impacts & Mitigation Measures 4.1 IDENTIFICATION OF IMPACTS Various sources of pollution with respect to wastewater, the flue gas/process emission, hazardous waste and noise generation along with their qualitative and quantitative analysis as well as measures taken to control them are discussed herein with details. The network method has adopted to identify potential impact, which involves understanding of causecondition-effect relationship between an activity and environmental parameters. This method involves the "road map" type of approach to the identification of second and third order effect. The basic idea is to account for the project activity and identify the type of impact that could initially occur followed by the identification of secondary and tertiary impacts. Identified potential impacts for the various components of the environment, i.e. air, noise, water, land and socio-economic, are presented in Figure 4.1. It should be noted that in these illustrations the lines are to be read as "might have an effect on". Prepared By: Aqua-Air Environmental Engineers Pvt. Ltd., Surat 134
135 FIGURE 4.1 IMPACT NETWORK ON AIR ENVIRONMENT Project Activity Construction Operation Phase Phase Release of Air Pollutants Release of Heat Primary Change in Impact on Particulates Climatic Impacts Air Quality Visibility Deposition on Changes Water, Land Secondary Impacts Impact on Human Health Aesthetic Impact on Impact on Impact Agricultural Flora & Fauna Produce Tertiary Impact on Impact on Impacts Economic Output Socio - Cultural Environment Prepared By: Aqua-Air Environmental Engineers Pvt. Ltd., Surat 135
136 FIGURE 4.1 CONTD. IMPACT NETWORK ON NOISE ENVIRONMENT Project Activity Construction Operational Phase Phase Noise Emission Primary Impacts Change in Ambient Noise Level Secondary Health Risks Impact on Work Migration of Birds, Impacts Output and Reptiles & Population Efficiency Tertiary Impact on Impact on Impacts Economic Socio-cultural Output Environment Prepared By: Aqua-Air Environmental Engineers Pvt. Ltd., Surat 136
137 FIGURE 4.1 CONTD. IMPACT NETWORK ON WATER ENVIRONMENT Project Construction Phase Operational Phase Activity Change in Surface Releases of Morphology Wastewater Impact on Runoff/ Seepage Primary Impact on Impact on Environmental Impacts Hydraulics of Water Quality Health and Water Courses Aesthetic Risk Secondary Impact on Impact on Cost of Water Impact on Impacts Hydraulic of Aquatic Life Treatment Amenity / Water Cources Recreation Impacts Impact on Economic Output Impact on Socio-Cultural Environment Prepared By: Aqua-Air Environmental Engineers Pvt. Ltd., Surat 137
138 FIGURE 4.1 CONTD. IMPACT NETWORK ON GROUND WATER ENVIRONMENT Project Cnstruction Phase Operational Phase Activity Distrubance Release of of Soil Waste-water on Land Primary Change in Groundwater Change in Structure Addition / Removal Impacts Regime : Soil Moisture / of Soil : Ground of Substances or water Level / Flow Level Heat to / form Pattern / Salt Water the Soil Instruction Secondary Impact on Soil Biota Impact on Flora Impact on Impacts and Fauna Landscape Impact on Agriclutural Production Impact on Livestock Tertiary Impact on Impact on Impacts Economic Socio - Cultural Out Put Environment Prepared By: Aqua-Air Environmental Engineers Pvt. Ltd., Surat 138
139 FIGURE 4.1 CONTD. IMPACT NETWORK ON LAND ENVIRONMENT Project Activity Construction Operational Phase Phase Primary Disturbance Disposal of Impacts of land Wastewater & Sludge on Land Change in soil Change in Ground Toxic Substances Texture & Permeability Water Regime / Salt on Land, Particulate Water Intrusion Deposition on Land Secondary Impact on Soil Salinity Impact on Impacts Landscape Flora & Fauna Tertiary Impact on Impact on Impacts Agricultural Produce Live Stock Impact on Economic Output Impact on Socio- Cultural Environment Prepared By: Aqua-Air Environmental Engineers Pvt. Ltd., Surat 139
140 FIGURE 4.1 CONTD. IMPACT NETWORK ON SOCIO-ECONOMIC & CULTURAL ENVIRONMENT Project Activity Operational Phase Construction Phase Primary Economic Input Economic Output Demand for Wark Force Impacts Capital/C&M Cost Product Cost Net Income Output SecondaryChange in Development Better Air, Water Empolyment Demand for Demand for Aesthetic Impacts Economic Base of Ancillary Product Land, Noise Opportunity Communication Infrastructural Risk of The Region Industries Avaliability Pollution Facilities Facilities Saving of Foreign Exchange Effect On Effect On Effect On Effect on Human Health Agriculture & Visual Buildings Fisheries Environment Materials Mounments Tertiary Effect On Water Supply, Effect On Educational Effect On Human, Nature & Impacts Sewerage & Soild Waste Medical, Transport Recreational Facilities Management Facilities Facilities Prepared By: Aqua-Air Environmental Engineers Pvt. Ltd., Surat 140
141 4.2 PREDICTIONS AND EVALUATION OF IMPACTS An impact can be defined as any change in physical, chemical, biological, cultural and/or socioeconomic environment that can be attributed to activities related to alternatives under study for meeting the project needs. Impact methodology provides an organized approach for prediction and assessing these impacts. Scientific techniques and methodologies based on mathematical modeling are available for studying impacts of various project activities on environmental parameters. The nature of the impacts due to said project activities are discussed here in detail. Each parameters identified in the proceeding chapter, is singularly considered for the anticipated impact due to various activities listed. The impact is quantified using numerical scores 0, 1, 2, 3, 4 and 5 in increasing order of activity. In order to assess the impact accurately, each parameter is discussed in detail covering the following: 1) Project activities likely to generate impact 2) Quantification and prediction of impact WATER ENVIRONMENT With respect to water environment three aspects are generally considered in EIA, the raw water availability, consumption and wastewater disposal. The first priority in water quality assessment is to maintain and restore the desirable level of water quality in general (Wholesomeness of water) IMPACT DURING CONSTRUCTION PHASE There are three activities that have potential to cause impact on the water environment viz. construction activities, abstraction of water for construction and sanitation. During Construction, drainage pattern and water supply system of overland water flow will be somewhat changed to the site preparation activities. Potential impacts may be on surface water quality during this phase could arise from dust emissions (from vehicles and disturbance of soil). Prepared By: Aqua-Air Environmental Engineers Pvt. Ltd., Surat 141
142 MITIGATION MEASURES During construction phase, water requirement for the construction will be met through GIDC water supply. Sanitary units will be provided for the workers. Waste water to be generated will be disposed of through septic tank & soak pit. Hence, there is no any impact on the water environment Impact during Operation Phase Water Consumption & Waste Water Generation is given in Table 2.1. Details of ETP are discussed in Topic of Chapter 2. Overall there won t be any significant adverse impact due to proposed activity on the water environment. Ground water and soil will not get contaminated. With the above, it can be said magnitude of impact will be no significant adverse impact on surface and ground water or soil quality AIR ENVIRONMENT With respect to air environment, generally considerable aspect in EIA is dispersion of dust particles and gaseous pollutants in air during construction phase and operation phase CONSTRUCTION PHASE IMPACTS Dust will be the main pollutant affecting the ambient air quality of the surrounding area during the construction phase. Proposed activity will be constructed on open land and that land is flat and ready for construction. Motor vehicle transportation (to, from and around the site) particularly the traffic of tracks at the site, material movement into the site will introduce particulates and other exhaust gases into the local ambient air and there is some likelihood that during the construction period local air quality may be temporarily affected by these emissions. Prepared By: Aqua-Air Environmental Engineers Pvt. Ltd., Surat 142
143 MITIGATION MEASURES During Construction phase, suspended solids will be controlled by sprinkling of water and by employing enclosures to construction area to allow the particles to settle down, prior to discharge. Construction material/s conveyer will ask to cover conveyer to prevent any kind of dust emissions OPERATION PHASE IMPACTS The dispersion of pollutants in atmosphere is a function of several meteorological parameters viz. temperature, wind speed and direction, mixing depths, inversion level, etc. A number of models have been developed for the prediction of pollutant concentration at any point from an emitting source. The Industrial Source Complex Short Term (ISCST3) dispersion model is a steady-state Gaussian plume model. It is most widely accepted for its interpretability. It gives reasonably correct values because this obeys the equation of continuity and it also takes care of diffusion, which is a random process. For the present study, this model is used for the prediction of maximum ground level concentration (GLC). The air emissions at M/s. Prafful Overseas Pvt. Ltd.are SPM, SO 2, NOx and HCl. The site specific and monitored details considered for input data for the software ISC-AERMOD View by Lakes Environmental, Canada for prediction of impact on air environment are given in Table 4.1. The site-specific hourly meteorological data measured at site is given in Table 3.5. In order to conduct a refined air dispersion modeling using ISCST3 and ISC-PRIME short-term air quality dispersion models, the site specific hourly meteorological data measured at site is pre-processed using the U.S. EPA PCRAMMET and U.S. EPA AERMET programs. Before starting air dispersion modeling with ISC-AERMOD View, a building downwash analysis using BPIP View was done. BPIP View is a graphical user interface designed to speed up the work involved in setting up input data for the U.S. EPA Building Profile Input Program (BPIP) and Building Profile Input Program Plume Rise Model Enhancements (BPIP-PRIME). Prepared By: Aqua-Air Environmental Engineers Pvt. Ltd., Surat 143
144 The air pollution caused by the gaseous emissions from a single or small group of stacks is a local phenomenon. Its impacts will occur at a distance ranging from within the immediate vicinity of the stack to several kilometers away from the stack. Maximum ground level concentration will occur within this range. All plumes at more downwind distances from the source by stack emission become so diluted by diffusion in the ambient atmosphere, that concentrations of pollutants become negligible. The maximum ground level concentration for different parameters is given in Table 4.2. Isopleths are given in Figure 4.2. Adequate measures shall be taken to minimize air pollution by providing air pollution control equipment. Flue gases are discharged from stacks at adequate height (as per GPCB norms). TABLE 4.1 SR. NO. DETAILS OF EMISSION FROM STACKS OPERATING PARAMETER UNIT SOURCE OF EMISSION Existing Proposed Boiler CPP DG SET BOILER BOILER (4 (8 TPH) TPH) THF Prepared By: Aqua-Air Environmental Engineers Pvt. Ltd., Surat 144 CPP DG SET 1. Stack Height m Diameter m Flue Gas Temperature 0 K Air Pollution Control Equipment - Low NOx Burner adequat e stack height ESP MCS+ Bag Filter ESP Adequate stack height 5. Flue Gas Velocity 6. Emission Concentration SPM SO 2 NOx m/s mg/nm 3 (g/s) mg/nm 3 (g/s) mg/nm 3 (g/s) * Permissible limits 150* (0.026) 100* (0.0177) 50* (0.0087) 150* (0.012) 100* (0.0078) 50* (0.0038) 150* (0.0123) 100* (0.0082) 50* (0.0041) 150* (0.0262) 100* (0.0175) 50* (0.0087) 150* (0.0151) 100* (0.01) 50* (0.005) 150* (0.027) 100* (0.0179) 50* (0.0089) 150* (0.012) 100* (0.0079) 50* (0.0039)
 Prepared By: Aqua-Air")
145 FIGURE ISOPLETHS FOR PM (Existing) Prepared By: Aqua-Air Environmental Engineers Pvt. Ltd., Surat 145
146 FIGURE (CONTD.) ISOPLETHS FOR SO 2 Prepared By: Aqua-Air Environmental Engineers Pvt. Ltd., Surat 146
147 FIGURE (CONTD.) ISOPLETHS FOR NOx Prepared By: Aqua-Air Environmental Engineers Pvt. Ltd., Surat 147
148 TABLE 4.2 SUMMARY OF ISCST3 MODEL OUTPUT (EXISTING) SR LOCATIONS CO-ORDINATES CONCENTRATION (µg/m 3 ) NO (X, Y) PM SO 2 NOx 1. Project-site (A1) (0,0) Panoli (A2) (-4200,-1900) Sanjali (A3) (-1500,-100) Bakrol (A4) (700,2400) Kosamdi (A5) (2800,4290) Kharod (A6) (710,00) Kapodara (A7) (850,5100) Kondh (A8) (6700,3000) Umarwada (A9) (-3150,3400) Prepared By: Aqua-Air Environmental Engineers Pvt. Ltd., Surat 148
149 FIGURE ISOPLETHS FOR PM (Proposed) Prepared By: Aqua-Air Environmental Engineers Pvt. Ltd., Surat 149
 ISOPLETHS FOR SO 2 (Proposed) Prepared By: Aqua-Air")
150 FIGURE (CONTD.) ISOPLETHS FOR SO 2 (Proposed) Prepared By: Aqua-Air Environmental Engineers Pvt. Ltd., Surat 150