A part of BMT in Energy and Environment Kosciusko Avenue Main Drain Catchment Drainage / Flood Study Draft Report
|
|
|
- Amberly McBride
- 5 years ago
- Views:
Transcription

1 A part of BMT in Energy and Environment Kosciusko Avenue Main Drain Catchment Drainage / Flood Study Draft Report R.M DraftReport January 2011
2 Kosciusko Avenue Main Drain Catchment Drainage / Flood Study Draft Report Prepared For: Prepared By: City of Greater Geelong BMT WBM Pty Ltd (Member of the BMT group of companies) Offices Brisbane Denver Karratha Melbourne Morwell Newcastle Perth Sydney Vancouver T:\M7299.MT.KOSCIUSKO_FS\DOCS\OUT\R.M DRAFTREPORT.DOC
3 EXECUTIVE SUMMARY I EXECUTIVE SUMMARY Study Objective The Kosciusko Avenue Main Drain (MD) catchment has some of the most serious and frequent drainagerelated or stormwater flooding within the municipality. Like many areas of similar age, the stormwater pipe network within the Kosciusko Avenue MD catchment is generally ageing and hydraulically constrained by today s standards. There are only limited open channel flow systems or overland floodways to convey runoff during larger flood events, so when the capacity of the network is exceeded, it results in above floor flooding in the residential areas. The primary objectives of this study were to characterise existing flooding and to develop an appropriate flood management strategy to mitigate stormwater flooding in the area. Study Methodology The study was carried out under the following core elements. 1. Preliminary Tasks These were project initiation, including an inception meeting and initial site inspection, along with a data collation and review exercise. The data collation and review phase included an analysis of previous drainage investigations, council policy, aerial photography of the area, topography, GIS datasets, digital plans and design information. 2. Digital Terrain Model Photogrammetry of the study area was commissioned and supplied by Photomapping Services. LiDAR data of the study area was also provided by the City of Greater Geelong (CoGG) and used to assist in the hydrological model development. Additional continuous elevation strings representing features of hydraulic importance were sourced for use in the modelling. 3. Hydrological and Hydraulic Modelling, and Mapping of the Existing Conditions The hydrologic and hydraulic modelling was undertaken using the traditional approach of applying flow boundaries from the hydrological model (RORB) to the two-dimensional (2D) hydraulic model (TUFLOW). The existing flood characteristics were identified through hydrologic and hydraulic modelling of the 20%, 5% and 1% average exceedence probability (AEP) flood events. The flood results were mapped using GIS. An assessment of flood damage was undertaken using the stage-damage curve approach. 4. Mitigation Option Assessment and Mapping A wide range of potential structural and non-structural flood mitigation measures were screened, from which a shortlist of three (3) alternative flood mitigation schemes were selected and tested using the hydraulic model. Flood damage, scheme cost and benefit-cost ratios were determined for each of the schemes tested. A do nothing option was also considered. 5. Selection and Detailed Mapping of the Preferred Mitigation Scheme The mitigation schemes were assessed according to their ability to reduce flood damage. The schemes were ranked according to a range of economic and non-economic factors. A preferred strategy was then selected in consultation with CoGG. The preferred scheme was mapped using GIS, with hardcopy plans of flood extent and flood levels produced. The key results from the investigation are summarised in the following sections. T:\M7299.MT.KOSCIUSKO_FS\DOCS\OUT\R.M DRAFTREPORT.DOC
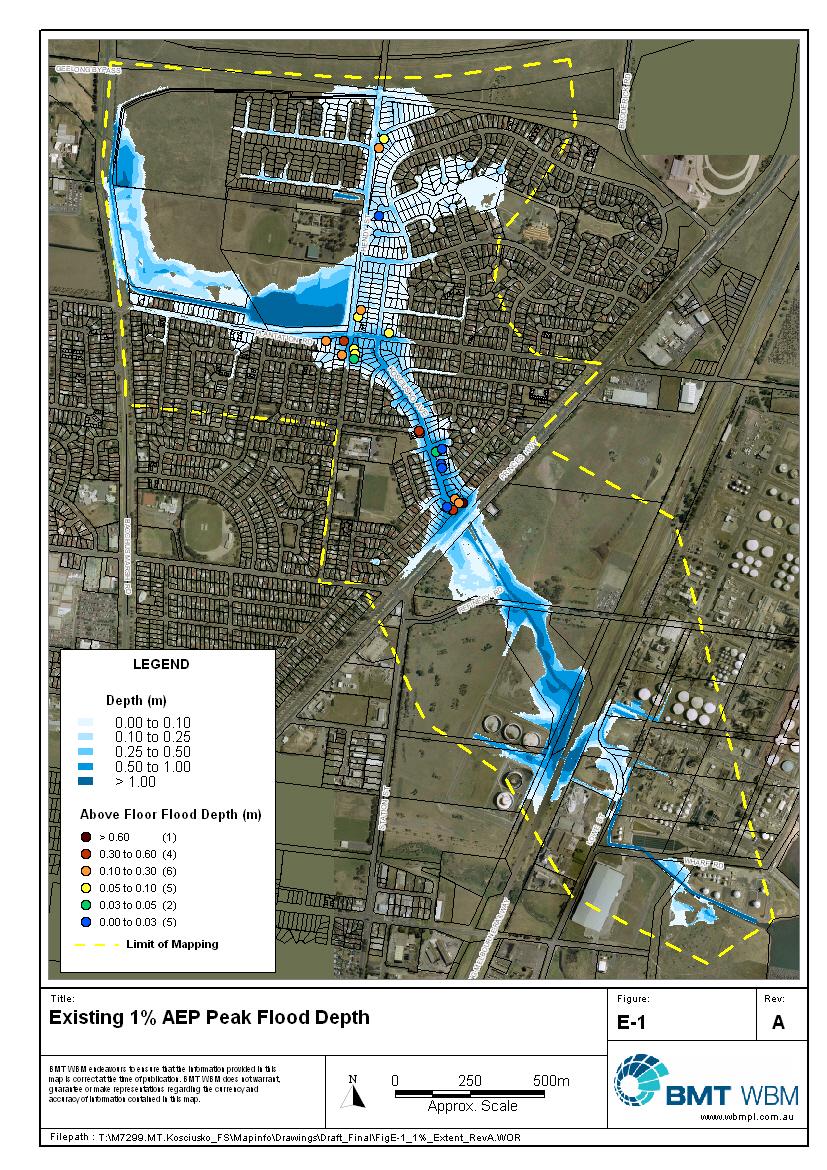
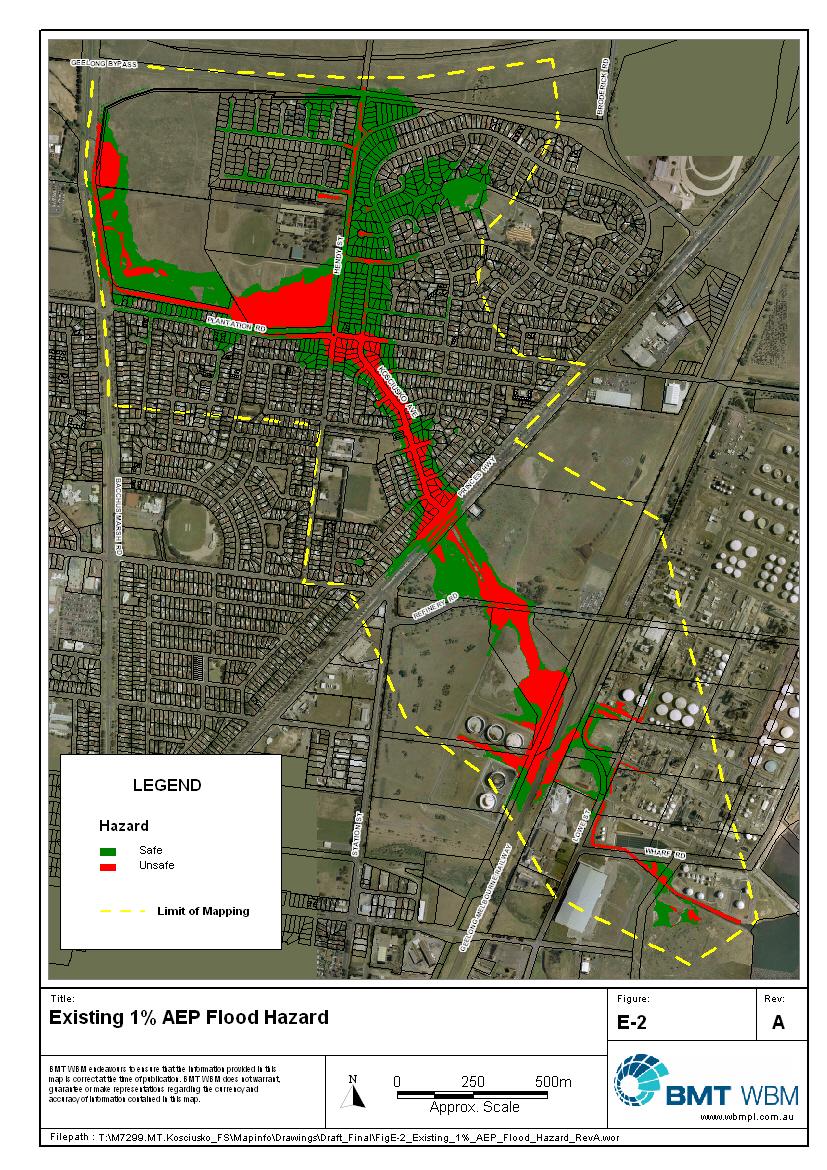
4 EXECUTIVE SUMMARY II Existing Flooding Characteristics The flood extent of the 1% Annual Exceedence Probability (AEP) flood, i.e. the 100 Year Average Recurrence Interval (ARI) flood, is shown in Figure E-1. The number of flood-affected properties was identified and the average annual flood damage (AAD) was calculated at $40,000. Table E-1 shows the total number of properties that have floor level information available and are inundated to above floor level in the range of flood events analysed. An analysis was also undertaken to determine the number of properties within the study mapping area, ie, not the full catchment, that have flooding within the property boundaries in the 1% AEP event. This information is also detailed in Table E-1. Hazard mapping was undertaken using the methodology prescribed in the Melbourne Water document Guidelines for Development in Flood-prone Areas. The analysis is designed to determine if it is safe for people to move about on a property during a flood event. Safety is defined in terms of the depth, velocity and velocitydepth product. The existing 1% AEP hazard mapping for the study area is shown in Figure E-2. There are sections of the main overland drainage paths that are classified as unsafe in a 1% AEP event such as table drains, open channels and retarding basins. In addition to these main overland flowpaths experiencing unsafe overland flow in a 1% AEP flood are Hendy St, Kosciusko Ave and the intersection of Kosciusko Ave and the Princes Hwy service road. During the 20% AEP flood, areas considered unsafe are generally located where flood water is ponding and include Bacchus Marsh Rd table drain, the Plantation Rd retarding basin and the intersection of Kosciusko Ave and the Princes Hwy service road. Table E-1 Number of Flooded Properties Number of Flooded Properties AEP Kosciusko Ave MD Within Property Above Floor* 1% % % * Results based on properties surveyed by CoGG. Refer to Section 3.6 (of the Main Report). T:\M7299.MT.KOSCIUSKO_FS\DOCS\OUT\R.M DRAFTREPORT.DOC
5
6
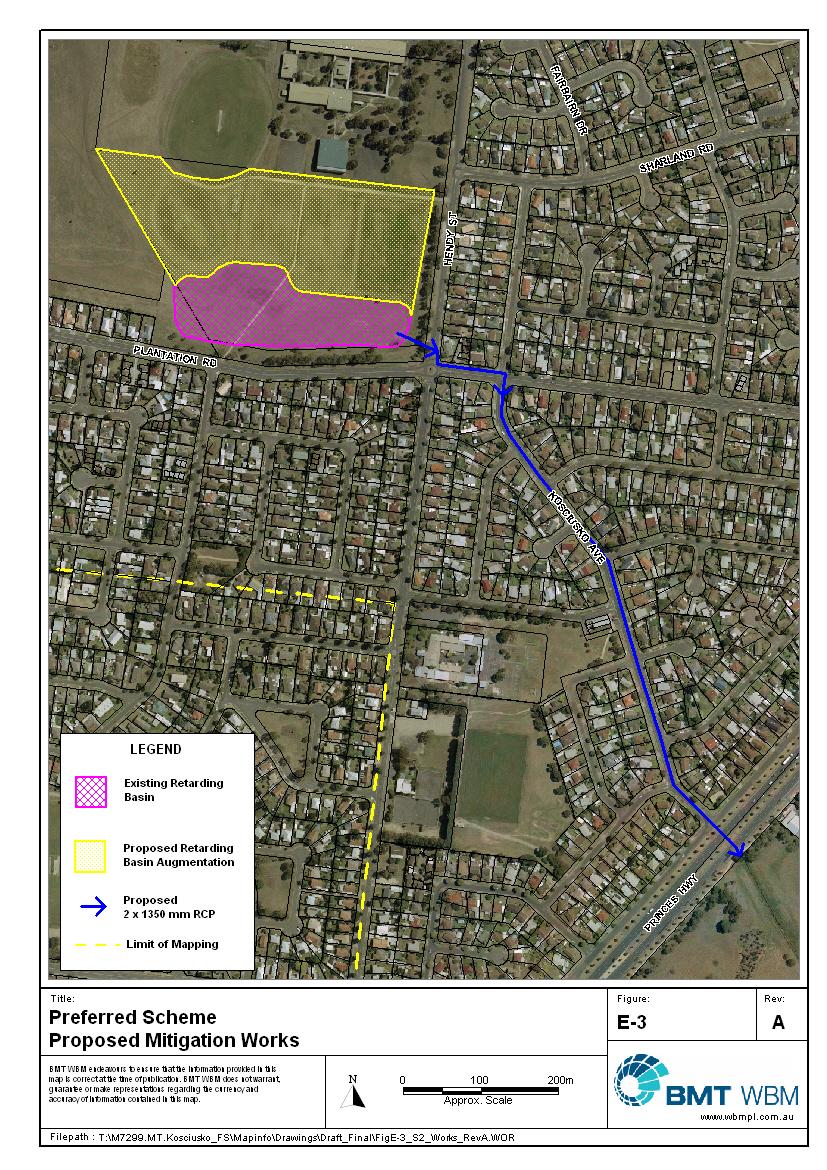
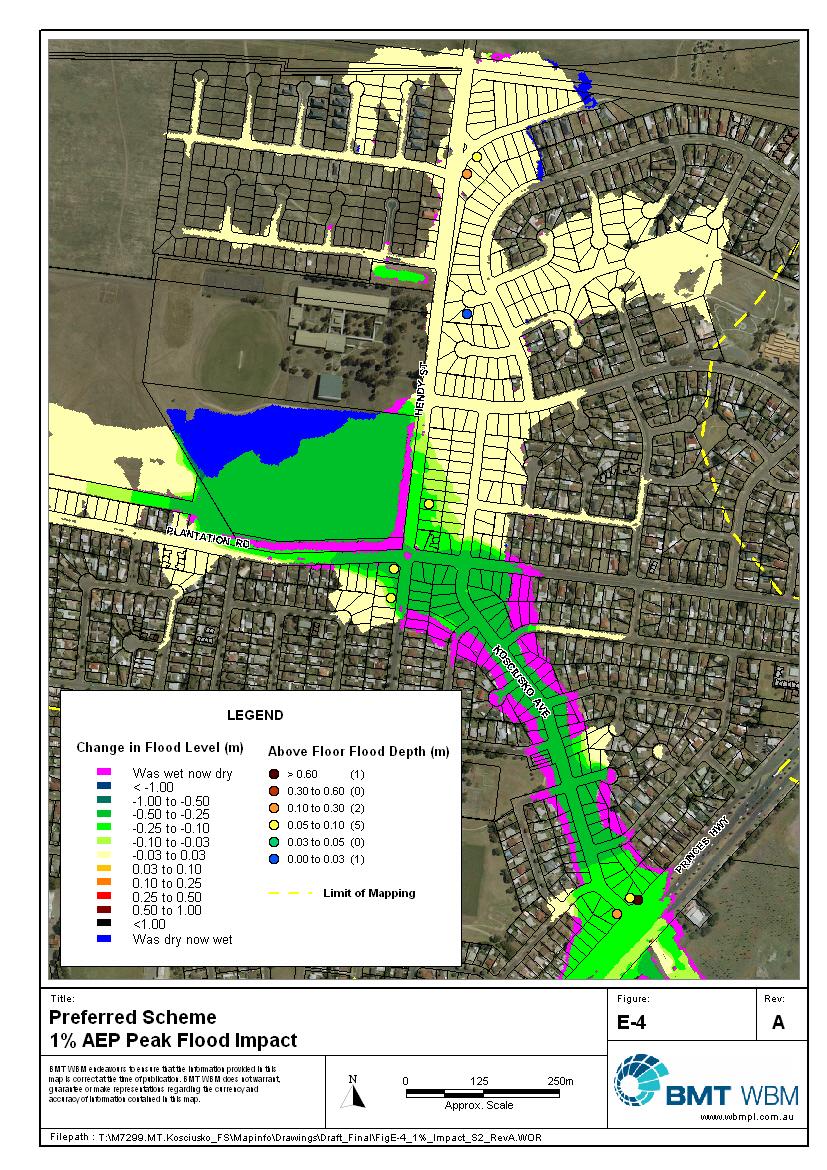
7 EXECUTIVE SUMMARY V Mitigation Option Assessment A full range of structural and non-structural flood mitigation elements were considered when developing the three mitigation schemes. The elements considered ranged from upgrading underground pipe systems through to planning scheme amendments and education and awareness programs. These elements were screened to provide a list of elements that were considered suitable for use in the Kosciusko Ave MD drainage catchment. Through discussion with Council officers, the elements were combined to form the mitigation schemes for detailed modelling and assessment. The do nothing strategy, ie, the existing flood conditions, was also considered. Each scheme was assessed using the hydraulic model for each flood event. Table E-2 shows the number of flooded properties under each scenario. Table E-3 outlines the benefit (as a result of reduced flooding), the capital and on-going costs and Benefit to Cost Ratio (BCR) of each scheme. Table E-2 Flood Affected Properties Option Flood Affected Property Floors ** 1% AEP 5% AEP 20% AEP Existing Scheme One Scheme Two Scheme Three Scheme Four (Do Nothing) ** Flood Affected Property Floors are defined as those with flood levels above the surveyed floor level Table E-3 Mitigation Option Economic Summary Options Scheme One Scheme Two Scheme Three Scheme Four Annual Damages Average Annual Benefit Total Benefit (NPV) Capital Cost Ongoing Costs over 30 Years (PA) Ongoing Costs over 30 Years (NPV)* Total Option Cost $32,000 $8,000 $99,000 $2,220,000 $53,000 $658,000 $2,878, $26,000 $14,000 $174,000 $5,565,000 $134,000 $1,663,000 $7,228, $20,000 $20,000 $248,000 $10,578,000 $254,000 $3,152,000 $13,730, $40,000 BCR * NPV Net Present Value discounted at 7% over 30 years Preferred Mitigation Scheme Scheme Two is the preferred scheme for the Kosciusko Ave MD drainage catchment. Details of the scheme are shown in Figure E-3. Through consultation with the CoGG, the preferred scheme was selected as it focused on mitigation of overland flows and flood depths to reduce flood hazard within the urban areas of Kosciusko Ave MD. The impact of the preferred scheme on 1% AEP flood levels is shown in Figure E-4, and T:\M7299.MT.KOSCIUSKO_FS\DOCS\OUT\R.M DRAFTREPORT.DOC
8 EXECUTIVE SUMMARY VI the hazard mapping for the preferred scheme is shown in Figure E-5. A comparison with the existing case hazard map (Figure E-2) shows a significant reduction in the extent of the areas classified as unsafe, particularly in the areas of concern previously mentioned. Scheme Two has a higher capital cost and a marginally lower BCR. The scheme results in reductions of flood levels along most of the major flow paths and reduces the overall flood extent along Kosciusko Ave, resulting in a reduction of flood affected properties. Although regions of high hazard still exist within the catchment, these areas are dramatically reduced by the preferred scheme. Also considered in the selection of the preferred scheme were key indicators such as environmental, social, feasibility and performance. This analysis in regard to the preferred scheme, when compared to the other schemes, is summarised as follows: its potential environmental impact is minimal and similar to the other schemes; the social impacts arising from Scheme Two are very limited; and the feasibility and performance are comparable to the other schemes. A number of non-structural components are recommended for implementation in conjunction with the structural measures. These additional measures are summarised below. Further investigation into the feasibility of property-specific measures to manage risk from residual flooding (with Scheme Two in place). Potential measures include flood proofing of individual (or groups) of buildings/properties by landowners, and property buy-back with on-sell following modifications (where feasible) with conditions known to purchaser. This may be a feasible and economical alternative considering that house values are approximately $200,000 to $300,000 in the area whereas the capital cost per floor saved in the 1% AEP event for Scheme Two is approximately $398,000. Education and awareness program to inform landowners how to minimise the magnitude of damage during a flood event. Development controls via designation of areas as liable to flooding (in accordance with Building Regulations 2006) and use of flood zones/overlays within the Greater Geelong Planning Scheme. Recognition that further development within the catchment has the potential to increase flood risk to people and property. Assessment of rezoning proposals to include application of principle of zero adverse flood impact on adjacent, upstream and downstream areas. Assessment of development and subdivision applications (planning permit) to include application of best practice guidelines for development within or upstream of flood-prone areas. Best practice environmental management for stormwater runoff to be encouraged as part of development and subdivision applications in order to reduce runoff and improve water quality, where not a statutory requirement. T:\M7299.MT.KOSCIUSKO_FS\DOCS\OUT\R.M DRAFTREPORT.DOC
9
10
11