8 AIR QUALITY & CLIMATE / NOISE & VIBRATION
|
|
|
- Jacob Francis Payne
- 5 years ago
- Views:
Transcription
1 8 AIR QUALITY & CLIMATE / NOISE & VIBRATION This section assesses both the air quality & climate and the likely noise & vibration impact of the proposed works, in the context of current relevant standards and guidance, and identifies any requirements or possibilities for mitigation. The proposed scheme will comprise of the following works which may contribute to air quality, noise and vibration impacts in the area: Site investigations and site clearance; Construction of diversion new channel (c1km in length); Construction of new reinforced concrete flow control structure and spillway including adjustable steel plate, automated tilting weirs and platform; New hydrometric gauges; Construction of two new bridges and safety barriers and upgrade to approach roads; Road realignment; Creation of washlands; Creation and extinguishing of access roads; Ancillary work. The vast majority of air quality or noise and vibration impacts as a result of the proposed works will occur during the construction phase which will be short term in nature. 8.1 AIR QUALITY & CLIMATE - EXISTING ENVIRONMENT Meteorological Data A key factor in assessing temporal and spatial variations in air quality is the prevailing meteorological conditions. Depending on wind speed and direction, individual receptors may experience very significant variations in pollutant levels under the same source strength (i.e. traffic levels) (World Health Organisation, 2006). Wind is of key importance in dispersing air pollutants and for ground level sources, such as traffic emissions, pollutant concentrations are generally inversely related to wind speed. Thus, concentrations of pollutants derived from traffic sources will generally be greatest under very calm conditions and low wind speeds when the movement of air is restricted. In relation to PM10, the situation is more complex due to the range of sources of this pollutant. Smaller particles (less than PM2.5) from traffic sources will be dispersed more rapidly at higher wind speeds. However, fugitive emissions of coarse particles (PM2.5 PM10) will actually increase at higher wind speeds. Thus, measured levels of PM10 will be a non-linear function of wind speed. The nearest representative weather stations collating detailed weather windrose records are Belmullet and Claremorris, which are located approximately 40 km northwest and 50km southeast of the Crossmolina Town, respectively. Data collated by Met Eireann for the 30 year average ( ) indicates that the mean windspeed at Belmullet and Claremorris weather stations are 13.1 knots and 8.8 knots, respectively. The predominant wind direction is south to westerly Available Background Data Air quality monitoring programs have been undertaken in recent years by the EPA and Local Authorities. The most recent annual report on air quality Air Quality in Ireland 2016, Key Indicators of Ambient Air Environmental Impact Assessment Report 8-1
2 Quality (EPA, 2017), details the range and scope of monitoring undertaken throughout Ireland. EU legislation on air quality requires that areas are divided into zones for the assessment and management of air quality. In Ireland, Zone A is the Dublin Conurbation, Zone B is the Cork Conurbation, Zone C is all large towns in Ireland with a population >15,000 and Zone D is all remaining area. Crossmolina is categorised as Zone D. NO2 monitoring is carried out at the two rural Zone D locations, Emo and Kilkitt. The NO2 annual mean in 2013 for the sites was 4.1 and 3.0 μg/m 3 respectively (EPA, 2017). The results of NO2 monitoring carried out at the urban Zone D location in Castlebar and Enniscorthy in 2016 indicated an average NO2 concentration of 9.6 and 8.5μg/m 3 respectively while the Zone C locations of Kilkenny Seville Lodge and Portlaoise had average NO2 concentrations of 6.5 and 11.1 μg/m 3 respectively with no exceedances of the 1-hour limit value (EPA, 2017). Hence long-term average concentrations measured at these locations were significantly lower than the annual average limit value of 40 µg/m 3. Based on the above information and baseline EPA monitoring data, an expected background concentration for Crossmonlina is similar to other Zone D NO2 concentrations of between 3.0 and 9.6μg/m 3 which is well below the limit value of 40μg/m 3 for the protection of human health, and, 30μg/m 3 for the protection of vegetation. PM10 monitoring was carried out at the urban Zone D locations of Castlebar, Claremorris and Enniscorthy in The PM10 annual averages for the locations in 2016 were 11.9, 10.1 and 17.3 μg/m 3 respectively (EPA, 2017). The PM10 annual average in 2016 for the rural Zone D location of Kilkitt was 8.1 μg/m 3. In addition, data from Rathmines provides a good indication of urban background levels, with an annual average in 2016 of 14.8 μg/m 3 (EPA, 2017). Based on the above information, a conservative estimate of the background PM10 concentration for Crossmolina is between 8.1 and 14.8 μg/m 3 which is below the annual mean limit values for human health of 40μg/m 3. A study by the UK ODPM (2000) gives estimates of likely dust deposition levels in specific types of environments. In open country a level of 39 mg/(m 2 *day) is typical, rising to 59 mg/(m 2 *day) on the outskirts of town and peaking at 127 mg/(m 2 *day) for a purely industrial area. As a worst-case, a level of 127 mg/(m 2 *day) can be estimated as the existing dust deposition level for the current location which is below below the TA Luft guidelines of 350 mg/m 2 /day. With regard to benzene, continuous monitoring was carried out at Kilkenny Seville Lodge (Zone C), and Rathmines (Zone A) in 2016, with annual averages of 1.01 µg/m 3 and 0.2 µg/m 3 respectively (EPA, 2017). Based on the above information a conservative estimate of the background benzene concentration for the region of the proposed development is below 1.0 µg/m 3. This is below the annual limit for protection of human health of 5 µg/m 3. In terms of CO, results for the Zone C location of Portlaoise was 0.4mg/m 3 annual mean for the rolling 8- rour CO concentration in 2016, while Enniscorthy (Zone D) was 0.06 mg/m 3 for the annual average. The maximum 8-hour limit value for the protection of human health is set at 10 mg/m 3 (EPA,2017). Based on the above information a conservative estimate of the background CO concentration for the region of the proposed development is below 0.4 mg/m 3. In summary, existing baseline levels of NO2, PM10, PM2.5, CO and benzene based on extensive long-term data from the EPA are likely to be below ambient air quality limit values in the vicinity of the proposed development Noise Sensitive Receptors The following diagrams / photos detail each of the adjacent noise sensitive receptors that are identified as being in close proximity to the proposed work areas. Environmental Impact Assessment Report 8-2

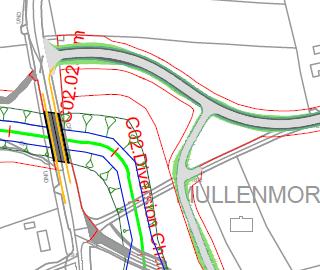
3 Figure 8.1 Figure 8.1 Noise Sensitive Location Map Environmental Impact Assessment Report 8-3


4 NSL 1 NSL 2: NSL 3 Environmental Impact Assessment Report 8-4


5 NSL 4 NSL 5 & ASSESSMENT OF THE PROPOSED WORKS Air Quality & Climate Ambient Air Quality Standards National and European statutory bodies have set limit values for various air pollutants in order to reduce the risk to human health from poor air quality. These limit values or Air Quality Standards are health or environmental-based levels for which additional factors may be considered. Limit values are set out in the tables below. Environmental Impact Assessment Report 8-5
6 Pollutant Regulation Note 1 Limit Type Margin of Tolerance Value Nitrogen Dioxide 2008/50/EC Hourly limit for protection of human health - not to be exceeded more than 18 times/year Annual limit for protection of human health Annual limit for protection of vegetation Lead 2008/50/EC Annual limit for protection of human health Sulphur dioxide 2008/50/EC Hourly limit for protection of human health - not to be exceeded more than 24 times/year Daily limit for protection of human health - not to be exceeded more than 3 times/year Annual & Winter limit for the protection of ecosystems Particulate Matter (as PM10) 2008/50/EC 24-hour limit for protection of human health - not to be exceeded more than 35 times/year Annual limit for protection of human health 40% until 2003 reducing linearly to 0% by μg/m 3 NO2 40% until μg/m 3 NO2 reducing linearly to 0% by 2010 None 30 μg/m 3 NO + NO2 100% 0.5 μg/m μg/m μg/m 3 None 125 μg/m 3 None 20 μg/m 3 50% 50 μg/m 3 PM10 20% 40 μg/m 3 PM10 PM2.5 (Stage 1) 2008/50/EC Annual limit for protection of human health PM2.5 - Annual limit for protection (Stage 2) Note 2 of human health Benzene 2008/50/EC Annual limit for protection of human health Carbon Monoxide 2008/50/EC 8-hour limit (on a rolling basis) for protection of human health 20% from June Decreasing linearly to 0% by 2015 None 25 μg/m 3 PM μg/m 3 PM % until μg/m 3 reducing linearly to 0% by % 10 mg/m 3 (8.6 ppm) Table 8.1 Air Quality Standards Regulations 2011 (Based on Directive 2008/50/EC and S.I. 180 of 2011) Note 1 EU 2008/50/EC Clean Air For Europe (CAFÉ) Directive replaces the previous Air Framework Directive (1996/30/EC) and daughter directives 1999/30/EC and 2000/69/EC Note 2 EU 2008/50/EC states - Stage 2 indicative limit value to be reviewed by the Commission in 2013 in the light of further information on health and environmental effects, technical feasibility and experience of the target value in Member States. Environmental Impact Assessment Report 8-6
7 Pollutant Averaging Period Primary & Secondary Standard Note 1 (µg/m3) PSD Increment Class II Note2 (µg/m3) PM10 Annual Average over 3 years Hour as a 99 th %ile over 3 years NO2 Annual Mean CO 8-Hour 3-year average of annual 4 th highest daily maximum 8-hour conc. 1-Hour not to be exceeded more than 3 times in 3 consecutive years 10,000-40,000 - Hydrocarbon (Benzene) 3 Hours (6-9 AM) (corrected for methane) Table 8.2 US National Ambient Air Quality Standards (NAAQS) & PSD Increments Note 1 Primary standards to protect public health whilst secondary standards are set to protect public welfare Note 2 Class I areas are national parks and similar areas. Class II are all areas not originally classified as Class I. Note 1 Substances Time-weighted Average Averaging Time Lead µg/m 3 1 year Nitrogen dioxide 200 µg/m 3 40µg/m 3 1 hour annual Sulphur Dioxide 500 µg/m 3 20µg/m 3 10 minutes 24 hour Carbon monoxide 100 µg/m 3 60 µg/m 3 30 µg/m 3 10 µg/m 3 15 minutes 30 minutes 1 hour 8 hour Ozone (O3) 100 µg/m 3 8 hour Benzene Note 1 Particulate matter (PM2.5) 25 µg/m 3 10µg/m 3 24 hour annual Particulate matter (PM10) 50 µg/m 3 20µg/m 3 24 hour annual Table 8.3 WHO Air Quality Guidelines 1999 & 2005 No safe level recommended owing to carcinogenicity. Environmental Impact Assessment Report 8-7
8 Air quality significance criteria are assessed on the basis of compliance with the appropriate standards or limit values. The applicable standards in Ireland include the Air Quality Standards Regulations 2011, which incorporate EU Directive 2008/50/EC which combines the previous air quality framework and subsequent daughter directives. Although the EU Air Quality Limit Values are the basis of legislation, other thresholds outlined by the EU Directives are used which are triggers for particular actions (see Tables ). There are no statutory guidelines regarding the maximum dust deposition levels that may be generated during the construction phase of a development in Ireland. Furthermore, no specific criteria have been set in respect of this development. However, guidelines from the Department of the Environment, Heritage and Local Government currently exist for dust emissions from quarrying and ancillary activities (DEHLG, 2004). These can be implemented with regard to dust emissions from the proposed construction sites. With regard to dust deposition, the German TA-Luft standard for dust deposition (non-hazardous dust) (German VDI, 2002) sets a maximum permissible level for dust deposition of 350 mg/(m 2 *day) averaged over a one year period at any receptors outside the site boundary. Recommendations outlined by the Department of the Environment, Health & Local Government, apply the Bergerhoff limit of 350 mg/(m 2 *day) to the site boundary of quarries (DOEHLG, 2004). The concern from a health perspective is focused on particles of dust which are less than 10 microns. EU ambient air quality standards (Council Directive 2008/50/EC transposed into Irish law as S.I. 180 of 2011) centres on PM10 (particles less than 10 microns) as it is these particles which have the potential to be inhaled into the lungs and cause some adverse health impact. The Directive also sets an ambient standard for PM2.5 (particles less than 2.5 microns) which came into force in Climate Agreements Ireland ratified the United Nations Framework Convention on Climate Change (UNFCCC) in April 1994 and the Kyoto Protocol in principle in 1997 and formally in May 2002 (Framework Convention on Climate Change, 1997 & 1999). The Paris Agreement (2015) replaced the Kyoto Protocol and aims to strengthen the global response to the threat of climate changes. The Paris Agreement puts in place the necessary framework for all countries to take ambitious mitigation action. It aims to tackle 95% of global emissions through 188 Nationally Determined Contributions (NDCs). The agreement also places significant importance on actions needed, both nationally and globally, to help people adapt to climate change. Ireland will contribute to the mitigation aspects of the Agreement via the NDC tabled by the EU on behalf of Member States which commits to a 40% reduction in EU-wide emissions by 2030 compared to The most recent Conference of the Parties (COP23) to the agreement was convened in Bonn, Germany in November Noise The vast majority of potential noise and vibration impact of the proposed works on the surroundings will occur during the construction phase. No vibration impacts will occur following construction. There is no published statutory Irish guidance relating to the maximum permissible noise level that may be generated during the construction phase of a project. Local authorities normally control construction activities by imposing limits on the hours of operation and consider noise limits at their discretion. In the absence of specific noise limits, appropriate criteria relating to permissible construction noise levels for a development of this type may be found in the National Roads Authority (NRA) publication Guidelines for the Treatment of Noise and Vibration in National Road Schemes which indicates the following criteria Environmental Impact Assessment Report 8-8
9 and hours of operation. The majority of the construction activity is expected to occur during normal working hours. Table 8.4 indicates the maximum permissible noise levels at the facade of dwellings during the construction period as recommended by the NRA (Now TII). Days and Times Noise Levels (db re. 2x10⁻⁵ Pa) LAeq(1hr) LAmax Monday to Friday 07:00 to 19:00hrs Monday to Friday 19:00 to 22:00hrs 60* 65* Saturdays 08:00 to 16:30hrs Sundays & Bank Holidays 08:00 to 16:30hrs 60* 65* Table 8.4 Maximum permissible noise levels at the facade of dwellings during construction *Note: Construction activity at these times, other than that required for emergency works, will normally require the explicit permission of the relevant local authority Vibration Vibration standards are divided into two varieties: those dealing with human comfort and those dealing with cosmetic or structural damage to buildings. In both instances, the magnitude of vibration is considered in terms of Peak Particle Velocity (PPV). Humans are particularly sensitive to vibration stimuli and any perception of vibration may lead to concern. In the case of road traffic, vibration greater than 0.5mm/s may be disturbing. Higher levels of vibration are typically tolerated for events of short duration or single events. The following documents contain guidance in relation to acceptable vibration within buildings: British Standard BS (1993): Evaluation and measurement for vibration in buildings Part 2: Guide to damage levels from ground borne vibration, and; British Standard BS (2009): Code of Practice for Noise and Vibration Control on Construction and Open Sites: Vibration. BS 7385 states that there should typically be no cosmetic damage if transient vibration does not exceed 15mm/s at low frequencies rising to 20mm/s at 15Hz and 50mm/s at 40Hz and above. These guidelines relate to relatively modern buildings and should be reduced to 50% or less for more critical buildings. BS 5228 recommends that, for residential property and similar structures that are generally in good repair, a threshold for minor or cosmetic (i.e. non-structural) damage should be taken as a peak particle velocity of 15mm/s for transient vibration at frequencies below 15Hz and 20mm/s at frequencies above than 15Hz. Below these vibration magnitudes minor damage is unlikely, although where there is existing damage these limits may be reduced by up to 50%. In addition, where continuous vibration is such that resonances are excited within structures the limits discussed above may need to be reduced by 50%. NRA, 2004 details the permissible vibration levels during construction phase for national road schemes. These are listed in Table 8.5. Environmental Impact Assessment Report 8-9
10 8.3 POTENTIAL IMPACTS Allowable vibration (in terms of peak particle velocity) at the closest part of sensitive property to the source of vibration, at a frequency of Less than 10Hz 10 to 50Hz 50 to 100Hz (and above) 8 mm/s 12.5 mm/s 20 mm/s Table 8.5 Allowable Vibration During Construction Phase Air Quality & Climate Air Quality Dust Generation Rates Temporary Slight Negative Impact Construction activities may lead to the emission of dust. Dust is classified as matter with a particle size of between 1 and 75 microns (1-75 µm). As dust particles fall out of suspension in the air, dust deposition typically occurs in close proximity to the site and potential impacts generally occur within 500 metres of the dust generating activity. Deposition rates decrease with distance from the generating source and larger particles deposit closer to the source. Sensitivity to dust depends on the duration of the dust deposition, the dust generating activity, and the nature of the deposit. Therefore, a higher tolerance of dust deposition is likely to be shown if only short periods of dust deposition are expected and the dust generating activity is expected to stop. The potential for dust to be emitted will depend on the type of activity being carried out in conjunction with environmental factors including levels of rainfall, wind speed and wind direction. Dust generation rates depend on the site activity, particle size (in particular the silt content, defined as particles smaller than 75 microns in size), the moisture content of the material and weather conditions. Dust emissions are dramatically reduced where rainfall has occurred due to the cohesion created between dust particles and water and the removal of suspended dust from the air. It is typical to assume no dust is generated under wet day conditions where rainfall greater than 0.2 mm has fallen. 30-year average data ( ) from Belmullet and Claremorris meteorological stations identified that typically 249 and 230 days per annum are wet, respectively. Therefore, for greater than 63% of the time no significant dust generation will be likely due to meteorological conditions. Large particles which are greater than 75 microns in size fall out of atmospheric suspension and are therefore deposited in close proximity to the source. Smaller particles which are less than 75 microns can remain in atmospheric suspension for a greater distance and therefore give rise to potential dust nuisance. Particles which are less than 75 microns in size are referred to as silt. Emission rates are normally predicted on a site-specific particle size distribution for each dust emission source. Construction activities such as excavating and earth moving are likely to produce some level of dust during the construction phase of the project. These activities will mainly produce particles of dust greater than 10 microns, these particles are considered a nuisance but no not have the potential to cause significant health impacts. As the construction phase of the scheme is temporary, the potential for dust nuisance and significant levels of PM10 and PM2.5 will be temporary and will vary spatially during the construction phase. Environmental Impact Assessment Report 8-10
11 With mitigation measures in place, the proposed development will have a negligible impact on air quality during the construction phase. The proposed development will have an imperceptible impact on air quality once operational. Hence the impact on air quality of the proposed development will be insignificant Climate Temporary Negligible Impact Construction traffic will give rise to CO2 and N2O emissions during the construction phase of the proposed development. As these emissions will only be associated with the construction phase of the development, the impact will be temporary in nature. The estimated volume of construction traffic is 24/day. The increase in greenhouse gas emissions due to the proposed development will be negligible Mitigation Measures Air Quality & Climate In order to predict and reduce the volume of dust emissions pertaining to the construction phase of the proposed scheme, a dust minimisation plan will be put in place. The generation of dust is dependent on the construction activity being carried out. Environmental factors such as rainfall, wind speed and wind direction will also affect dust emissions. The majority of dust produced during the construction period will be deposited in close proximity to the source and any impacts from dust will generally be within several hundred meters of the construction area (UK ODPM, 2000). A number of measures will be implements in order to minimise dust impact: Site roads shall be regularly cleaned and maintained as appropriate; Hard surface roads shall be swept to remove mud and aggregate materials from their surface; Any road that has the potential to give rise to dust emissions must be regularly watered during dry and/or windy weather; Speeds shall be restricted on hard surface roads and vehicles transporting materials with dust potential must ensure that the material is enclose or covered with tarpaulin at all times; Public roads in the vicinity of the construction site shall be regularly inspected and cleaned as necessary; In the event of dust nuisance occurring outside the site boundary, movement of materials must be terminated immediately and procedures implements to rectify the problem; The dust emission plan shall be reviewed at regular intervals during the construction phase to ensure that best practice and procedures are in place to minimise dust emissions Residual Impact Air Quality & Climate Temporary Negligible Impact No residual impact is anticipated Monitoring Air Quality & Climate The dust mitigation measures put in place will be strictly monitored and assessed throughout the construction phase to ensure their effectiveness. Environmental Impact Assessment Report 8-11
12 8.3.5 Noise Impact Works associated with the proposed development may contribute to noise impact are as follows: Construction of bridge and road infrastructure; Construction of new channel and associated infrastructure; HGV movements; Piling works. A variety of items of plant will be in use for each of these work activities, such as excavators, lifting equipment, dumper trucks, compressors, piling rigs and generators. Sheet piling is expected to be the noisiest activity and the flow of vehicular traffic to, from and along the easement routes is also a potential source of noise and vibration. Due to the fact that the construction programme has been established in outline form only, it is not possible to calculate the actual magnitude of noise emissions to the local environment. However, the following sections present calculations of indicative noise levels for typical noise sources associated with each of the identified activity types. In each instance, source information was obtained from BS 5228: 2009: Code of practice for noise and vibration control on construction and open sites Part 1: Noise which sets out typical noise levels for items of construction plant. Table 8.6 provides the approximate distance from the nearest works to Noise Sensitive Locations. Location Distance From Roadway / Easement NSL 1 60m NSL 2 20m NSL 3 43m NSL 4 30m NSL 5 30m NSL 6 10m Table 8.6 Distance from Traffic Noise Emission to Nearest NSLs Reinforced Concrete Works, New Channel Works, and Road Realignment Temporary Negligible Impact Concrete works will be required at the following locations: A reinforced concrete spillway at the intake weir enclosed on three sides by a reinforced concrete retaining wall. Both bridges at Mullenmore (R315) and Pollnacross (L1105) Other locations, such as footpaths along the Lake Road, locations with the grass lines channel. The channel will be grass lined. The grass will generally be unreinforced, with reinforcement proposed to prevent potential scouring at locations where high velocities are predicted by the hydraulic model. Environmental Impact Assessment Report 8-12
13 The proposed grass lined channel will involve the excavation of c 160,000m 3 of naturally occurring Fluvioglacial and glacial tills, the majority of which will be transported off site. The surface area of the channel is 6ha (15 Acres), including the area between channel and boundary fences. realign the existing Lake Road and create a new junction with the R315. This will necessitate the permanent closure of a section of the existing road and realignment of the existing avenues connecting the Lake Road to properties to the South to suit the new layout. It will also be necessary to elevate the realigned property access avenues to prevent flooding of these access routes in the event of a flood. The new section of Lake Road will incorporate two new footpaths Fences will be erected along the revised property boundaries. Gates will be provided along the fence line to facilitate new access points for landowners. Access points may be revised subject to agreement with individual landowners. Surface water from the new road will be collected via a new surface water drainage system. Surface water runoff will be routed through new petrol interceptor(s), before discharging to the low flow channel at the base of the new diversion channel. The construction of the reinforced concrete walls, channel excavation and road construction are expected to be carried out in a traditional manner as set out in Chapter 3. Excavation and disposal of material is the main activity associated with channel construction. This will be followed by other activities such as channel lining, fencing, etc. Concrete structures will require excavation for foundations, blinding of formation, fixing of the reinforcement and placing of the formwork and concrete. Sheet piling may be required in some areas to provide a cut-off measure where there is a possibility of flood water passing underneath the foundation, however this is considered unlikely based on available geotechnical information. The impact of piling noise emission is dealt with in Section Road construction will include excavation to foundation level, installation of pipework for road drainage and other ducting required to facilitate installation of underground utilities, including placement of pipe bedding, surround, placing and compaction of backfill material, construction of concrete footpaths, including fixing of reinforcement, placing of formwork, placing of concrete, and stripping of formwork, construction of road including sub base, road base, base course and wearing course. Table 8.7 lists the expected noise sources associated with the these activities, their assumed noise levels and the predicted noise emission levels at each of the nearest noise sensitive locations. It is assumed that a 2.4m high hoarding wall will be provided between the various construction works areas and the nearest noise sensitive locations. Item Of Plant (BS5228 Ref.) 170kW Tracked Excavator (C.2.16) 170kW Wheeled Loader (C.2.28 Noise Level At 10m Predicted Noise Level at NSL Locations (db LAeq,1hr) Excavation Phase Dumper (C.2.32) Environmental Impact Assessment Report 8-13
14 Item Of Plant (BS5228 Ref.) Noise Level At 10m Predicted Noise Level at NSL Locations (db LAeq,1hr) Cumulative n/a Large Concrete Mixer (C.4.22) Truck Mounted Concrete Pump + Boom Arm (C.4.30) Poker Vibrator (C.4.33, concrete works only) Roller (C.2.37, R315 Bridge) Roller (C.2.38, road) 4kVA Generator (D.7.49) Construction Phase Cumulative n/a Table 8.7 Predicted Concrete And New Channel Works Activity Noise Emission To Nearest NSLs During the excavation phase, all of the noise emission levels are expected to meet or be less than the minimum adopted daytime noise criterion of 70dB LAeq. During the construction phase of the walls, noise levels will be consistent with or less than the daytime noise criterion of 70dB LAeq with the exception of NSL 6 which predicts a cumulative noise level of 75 db LAeq,1hr. The calculated levels listed above are commensurate with a worst case condition that would only occur during the short span of time that the listed plant items are at the closest point to each of the noise sensitive locations. Therefore, the likely impact of the construction of the flood defence walls on the local environment is expected to be negligible HGV Movements Temporary Negligible Impact The construction phase of the proposed scheme will give rise to additional traffic which may incur a noise impact on the adjacent noise sensitive locations. Construction traffic will access the construction site along the existing roads and temporary access routes shown on the scheme drawings in Appendix 3A. The noise level associated with an event of short duration, such as a passing vehicle movement, may be expressed in terms of its Sound Exposure Level (LAX). The Sound Exposure Level can be used to calculate the contribution of an event or series of events to the overall noise level in a given period. The appropriate formula is given below: LAeq,T = LAX + 10log10(N) 10log10(T) + 10log10(r1/r2)dB Environmental Impact Assessment Report 8-14
15 where: LAeq,T is the equivalent continuous sound level over the time period T (in seconds); LAX is the A-weighted Sound Exposure Level of the event considered (db); N is the number of events over the course of time period T; r1 is the distance at which LAX is expressed; r2 is the distance to the assessment location. The mean value of Sound Exposure Level for truck moving at low to moderate speeds (i.e. 15 to 45km/hr) is in the order of 82dB LAX at a distance of 5 metres from the vehicle. This figure is based on a series of measurements conducted under controlled conditions. The project estimates consider a maximum of 100 HGV round trip movements per day while works are being carried out at each works location. Using the equation detailed above and taking into account the attenuation due to distance, the predicted noise levels at each of the noise sensitive locations (NSLs) are listed in Table 8.8. Location Distance From Roadway / Easement HGV Sound Exposure Level at 5 metres (db,lax) Predicted Noise Level (db, LAeq,1hr) NSL 1 60m 48 NSL 2 20m 53 NSL 3 43m NSL 4 30m 51 NSL 5 30m 51 NSL 6 10m 56 Table 8.8 Predicted Construction Traffic Noise Emission At Nearest NSLs The predicted noise emission levels range between 43dB and 51dB LAeq,1hr with 51dB LAeq,1hr being the expected maximum at the any remaining noise sensitive locations along construction traffic routes that are located immediately adjacent to the road (i.e. 10m away). These predicted noise levels are within the minimum design criterion of 70dB LAeq. Therefore, the likely impact of construction traffic on the local environment will be negligible Piling Temporary Significant Negative Impact Based on available geotechnical information and the design channel invert levels, it is anticipated that piled foundations will be required for the Mullenmore (R315) Bridge. These will consist of cast in situ bored reinforced concrete piles. Sheet piling may be required in some areas to provide a cut-off measure where there is a possibility of flood water passing underneath the foundation, however this is considered unlikely, again based on available geotechnical information and the design channel invert levels. The requirement for sheet piling will be determined following a detailed site investigation. Therefore, as part of this assessment and in order to demonstrate the worst case scenario, piling is considered at the intake location. Environmental Impact Assessment Report 8-15
16 Table 8.9 summarises the predicted noise levels due to piling activities at the nearest noise sensitive locations. Item Of Plant (BS5228 Ref.) Mini piling Rig (C.3.17) Vibratory Piling Rig (C.3.3) Noise Level At 10m Predicted Noise Level at NSL Locations (db LAeq,1hr) Excavation Phase Cumulative n/a Table 8.9 Typical Piling Noise Levels At Nearest Noise Sensitive Locations Table 8.9 indicates that piling noise emissions would result in an exceedance of the design criteria at noise sensitive location 6. Although some allowance could likely be made given the relatively short durations that will be required for piling works and that they very likely won t be required at all of these locations, it is recommended that an alternative piling process such as the Giken Seisakusho Silent Piler be employed where possible, if it is necessary to include sheet piling in the works. The Giken piling rig employs a press-in method of piling in lieu of the more typical vibratory or impact type of piling. This method allows pre-formed piles to be installed with minimal noise and vibration generation. Noise level data for the Giken Silent Piler indicates a measured sound pressure level of 75dB(A) at a distance of 1m (White et al, 2002). Assuming the piling rig operates continuously for one hour, this would result in a noise level of 65dB LAeq, 1hr at a distance of 10m, which would be a closer distance than the piling works would be to any noise sensitive location. This level would be within the established criteria at each location and, hence, would allow piling activities to occur at any of the proposed works locations without a significant risk of noise emission exceeding the criteria. It is unlikely that piling will be carried out for walks in the vicinity of NSL 1 and NSL 3 due to proximity of masonry structures. In summary, assuming an alternative press-in piling method is employed, the likely impact of piling noise on the local environment would not be significant. If normal piling is employed, there is likely to be a moderate amount of noise impact although it would be likely to occur over relatively short durations Site Investigation Temporary Negligible Impact Site investigation works will involve some of the activities described above but are expected to be very low scale in nature and therefore are considered negligible when compared with the predicted impacts of the proposed scheme. Environmental Impact Assessment Report 8-16
17 8.3.6 Vibration Impacts Temporary Negligible to Slight Negative Impact The majority of the construction activities which will be employed during the construction phase of the proposed scheme with the exception of sheet piling are unlikely to generate perceptible vibrations at the sensitive noise locations. Piling activity is generally one of the most significant sources of vibration on construction sites. The vibration transmission associated with piling can be significantly reduced if piling operations are conducted with the press-in method. Although the exact levels will depend on ground composition, research indicates that vibration levels at a distance of 10m from the piling rig would be of the order of 1mm/s (White et al. 2002). This level is well below the BS 5228 guidance criteria limits. If an alternative piling method is conducted, a test pile should be erected at the piling location closest to the noise sensitive locations. Vibration monitoring should then be conducted to confirm that ground borne vibration will be within the guidance criteria limits listed in Table 8.6 and that no structural damage will therefore occur to adjacent buildings. Vibration may also impact on aquatic species such as the fresh water pearl mussel. Vibration monitoring should also be conducted at locations along the river bed which are in proximity to piling activities in order to ensure that vibration will not adversely affect the aquatic environment. Therefore, if the press-in method of piling is employed at all piling locations, the likely impact of vibration from the proposed construction works on the local environment would not be significant. If normal piling is employed, there is likely to be a moderate amount of vibration impact although it would be likely to occur over relatively short durations Mitigation Measures Noise & Vibration In order to sufficiently ameliorate the likely noise and vibration impacts from the proposed works, a schedule of noise control measures has been formulated for the construction phase. Reference will be made to BS : 2009: Code of Practice for Noise and Vibration Control on Construction and Open Sites: Noise, which offers detailed guidance on the control of noise & vibration from demolition and construction activities. In particular, it is proposed that various practices be adopted during construction, including: limiting the hours during which site activities likely to create high levels of noise or vibration are permitted; provision of a 2.4m high hoarding around weir and embankment works areas; establishing channels of communication between the contractor/developer, Local Authority and residents; appointing a site representative responsible for matters relating to noise and vibration; monitoring typical levels of noise and vibration during critical periods and at sensitive locations and along the river bed. Furthermore, it is envisaged that a variety of practicable noise control measures will be employed. These may include: selection of plant with low inherent potential for generation of noise and/ or vibration; erection of enclosures as necessary around noisy processes and items such as generators, heavy mechanical plant or high duty compressors; Environmental Impact Assessment Report 8-17
18 placing of noisy / vibratory plant as far away from sensitive properties as permitted by site constraints and the use of vibration isolated support structures where necessary. Vibration from construction activities will be limited to the values set out in Table 8.8. It should be noted that these limits are not absolute but provide guidance as to magnitudes of vibration that are very unlikely to cause cosmetic damage. Magnitudes of vibration slightly greater than those in the table are normally unlikely to cause cosmetic damage, but construction work creating such magnitudes should proceed with caution. Where there is existing damage, these limits may need to be reduced by up to 50% Residual Impact Noise & Vibration Temporary Negligible Impact During the construction phase of the project, we expect that nearby residential properties will not be exposed to significant noise emissions from construction works given that they in most cases well over 20m from the works. Given that the construction phase of the development is temporary in nature and calculated levels with mitigation measures in place are within criteria, it is expected that the various noise sources will be relatively negligible. Furthermore, the application of binding noise limits and hours of operation, along with implementation of appropriate noise control measures such as screening and low noise piling methods/durations, will ensure that noise impact is kept to a minimum Monitoring Noise & Vibration During the proposed works, noise and vibration monitoring may be conducted during certain activities. It is considered that short term attended noise and vibration measurements would be appropriate to ensure that the project design criteria are being met. The following survey methodology should be employed for attended noise monitoring: measure LAeq, LAMax, LAMin, LA10 and LA90 over a sample period of 15 minutes; detailed notes should be taken in relation to primary noise sources, weather and prevailing winds; measurements should be conducted at various locations on a cyclical basis over the course of a typical day. Noise monitoring will be conducted in accordance with ISO 1996: 2007: Acoustics Description, measurement and assessment of environmental noise. The following survey methodology will be employed for attended vibration monitoring or test pile measurements: measure the maximum ppv at each location over a sample period of 15 minutes; detailed notes should be taken in relation to primary vibration sources; measurements should be conducted at the locations on a cyclical basis over the course of a typical day (attended vibration monitoring only). Vibration monitoring will be conducted in accordance with either BS (1990) Evaluation and measurement for vibration in buildings Part 1: Guide for measurement of vibrations and evaluation of their effects on buildings or BS 6841 (1987) Guide to Measurement and Evaluation of Human Exposure to Whole- Body Mechanical Vibration and Repeated Shock as appropriate. Environmental Impact Assessment Report 8-18