WIND PROSPECTING IN BRITISH COLUMBIA, CANADA: A REPORT ON THE FEASIBILITY OF THE STANDING OFFER PROGRAM. Michelle Closson, B.Sc.
|
|
|
- Gerard Anthony
- 5 years ago
- Views:
Transcription
1 WIND PROSPECTING IN BRITISH COLUMBIA, CANADA: A REPORT ON THE FEASIBILITY OF THE STANDING OFFER PROGRAM Michelle Closson, B.Sc. Renewable Energy Masters Dissertation Murdoch University Division of Science and Engineering November, 2008
2 I, Michelle Closson, declare that this Dissertation is an account of my own research and that I have acknowledged appropriately.
3 ABSTRACT This report evaluated the effectiveness of the BC Hydro Standing Offer Program (SOP) at encouraging the development of smaller wind projects. The BC Predicted Wind Speed Atlas, collected meteorological data, and RETscreen financial model were used to conduct feasibility analyses in four promising regions Vancouver Island, North Coast, Eastern and Southern Interior, and the Peace region. The BC Predicted Wind Speed Map was used as a tool to identify where the average annual wind speed is sufficient to warrant a feasible project under the BC Hydro Standing Offer Program according to a variety of assumptions and constraints. Collected meteorological data was used to validate the BC Wind Atlas. The report concludes that the BC Predicted Wind Speed Atlas is an accurate tool and can be used by developers for identifying areas of good wind potential to initiate assessment. RETScreen was used to conduct the financial analysis. Four analyses were conducted for each of the regions to determine the wind speed required for projects signing a 20 or 40 year SOP contract in order to achieve 0% or 8% internal rate of return (IRR). The IRR was used as a measure to determine the financial viability of a project. An 8% IRR is considered relatively low from the perspective of financers, but was considered in this report as the lower range suitable for smaller, community-based projects. Realistically, the IRR would typically be required to be at least 12% in order to be considered for project financing. The financial analysis revealed that the BC Hydro Standing Offer Program does not provide an adequate payment price to encourage development of small wind projects. iii
4 The report highly recommends that BC Hydro increase the base payment prices to at least 11 cents per kilowatt hour at the two year review period. iv
5 ACKNOWLEDGEMENTS I would like to thank my advisors, family, and friends for your guidance, assistance and patience throughout the preparation and writing of this report. Thank you to my parents for your ongoing support of my education and for encouraging me to press enter ; to Sam Mills for your quantum of technical proficiency, your absurd ability to make me laugh, and your good loving; to my friends for taking every opportunity to distract me; to Jonathan Whale and Murdoch University for your consideration and for the opportunity to continue learning; and to M K Ince and Associates and BC Hydro for your resources. Finally I would like to acknowledge Adam Rosso for the incredible amount of guidance, time, and patience that you provided me. You helped me every step of the way and encouraged me to think harder. Without your help and your wife s yummy dinners I would surely not have completed this report and might have withered away. v
6 Table of Contents Chapter Introduction Background Report Outline... 5 Chapter 2.0 Wind Power Potential A British Columbia Context Introduction State of Development of Wind Farms in British Columbia Wind Regime A Regional Focus Vancouver Island North Coast Region Peace Region Southern and Eastern Interior Regions Interconnection Provincial and Federal Policies for Wind Power BC Hydro Calls for Power BC Hydro Standing Offer Program (SOP) ecoenergy for Renewable Power Chapter 3.0 British Columbia Predicted Wind Speed Map - MesoMap System Introduction MesoMap Models Data Sources The Mapping Process Conclusion Chapter 4.0 Collected Meteorological Data Introduction Location and Duration of Monitoring Measurement Systems Campbell Scientific NRG Dataloggers Data Data Overview vi
7 4.4.2 Data Format Data Manipulation Data Arrangement Wind Shear Results Conclusions Chapter 5.0 Map Comparison Introduction Comparison of Model Map to Collected Data Conclusion Chapter 6.0 Economic Analysis Introduction RETScreen the Tool RETScreen Analysis Introduction Analysis Discussion Base Case Results Sensitivity Analysis Discussion Chapter 7.0 SOP Site Prospecting Introduction Prospecting Scope Prospective areas in promising regions Chapter 8 Sources of Error Introduction MesoMap System Monitoring Equipment Collected Data Quality Wind Shear Calculations Georeferencing Chapter 9 - Discussion Further Work vii
8 Chapter 10 Conclusion and Recommendations References viii
9 List of Figures Figure 2.1 Areas with greatest wind development potential in BC...9 Figure 2.2 BC Hydro Transmission and Distribution Grid...12 Figure 4.1 Monitoring Station Locations...24 Figure 5.1 Monitoring stations overlaid on modeled map on Vancouver Island...32 Figure 5.2 Monitoring stations overlaid on modeled map in the Peace Region...33 Figure 5.3 Monitoring stations overlaid on modeled map in the E/S Interior Region...34 Figure 7.1 Prospecting in Vancouver Island...54 Figure 7.2 Prospecting in the North Coast...55 Figure 7.3 Prospecting in the Peace Region...56 Figure 7.4 Prospecting in the Eastern and Southern Interior region...57 List of Tables Table 2.1 Regional base price, Environmental Attributes Price, and Total Price...15 Table 2.2 Base price escalation...16 Table 4.1 BC Hydro meteorological station location and monitoring duration details...23 Table 4.2 Data collected from sensors and system...26 Table 4.3 Annual average wind speeds at 65 metres...29 Table 5.1 Comparison of modeled annual avg. wind speed to measured wind speed...35 Table 6.1 Values and assumptions summary for RETScreen energy model section...40 Table 6.2 Values and assumptions summary for RETScreen cost analysis section...43 Table 6.3 Values and assumptions summary for RETScreen financial summary section...46 Table 6.4 Summary of wind speeds with regional IRRs of 0%/8% in 20/40 year SOP terms.47 Table 6.5 Sensitivity analysis of payment price, capital, and annual costs...48 Table 7.1 Prospective wind project sites in BC under SOP...53 Table 8.1 Accuracy of Monitoring Equipment used at Monitoring Stations...59 ix
10 Chapter Introduction 1.1 Background The current installed capacity of wind power in Canada is almost 1900 MW (CANWEA, 2008). Despite the size of British Columbia (~ 944,000 km 2 ; more than twice the size of California) and its lengthy coastline (~ 25,000 km), the province has yet to connect any wind farms to the grid. The majority of British Columbia s power is derived from hydro electric generation systems (~80%) while the remaining comes from thermal power stations. It is expected that energy demand in British Columbia (BC) will increase by approximately 33% by the year 2023 (Deveau, 2004). Although the World Energy Council, FortisBank, and Petroleum Economist have declared that BC has some of the best conditions for viable wind energy projects in North America, it is still only just beginning construction to tap into this untouched resource (BCWEA, 2005). The BC Energy Plan: A Vision for Clean Energy Leadership aspires for power generation from renewable sources to continue to account for at least 90% of the total generation in the province (MEMP, 2007). It was not until recently that developers began to seriously evaluate the wind resource and the feasibility of wind power in BC. The quality and resolution of publicly available wind data for the province is relatively low compared to other Canadian provinces. In the recent past, most of the publicly available wind data in BC came from airport weather stations - a poor representation of wind potential. Area-specific wind resource modeling can be completed for developers by consulting companies, but this can be an expensive exercise. Consequently, in the year 2000, BC Hydro hired consultants to 1
11 produce the BC Predicted Wind Speed Map for public access. The map was developed using a Meso-Map System which couples weather modeling with topographical and land cover data. Additionally, BC Hydro installed meteorological towers at 18 sites throughout the province between 2000 and These towers were erected in four regions of the Province that had been identified as having the most promising wind resources, namely Vancouver Island, Peace Region, Southern and Easter Interior, and the North Coast. This wind data is available to the public for free download. BC Hydro made the wind resource data available to the public in order to encourage developers to assess potential wind sites by reducing barriers to data acquisition. There are several characteristics that dictate the feasibility of a wind power facility; 1. Wind resource availability, 2. Proximity to the grid, 3. Site access, and 4. Power purchase agreement. In other words, where is the good wind, how far is it from the grid, is the terrain navigable, and will anyone pay a reasonable price for what is generated, are very important questions that will weigh on the minds of developers in an unexploited and largely unexplored territory. 2
12 According to the Canadian Wind Energy Association (CANWEA), as of June 2008, there were three wind projects with signed purchase agreements and/or already under construction in BC. The Dokie Wind Project is a 144 MW wind park under construction in the Peace Region of northeastern BC and is expected to be first one built in the province; Bear Mountain Wind Park, another Peace Region project, will be 100 MW; and Mount Hays Wind Farm is a 25.5 MW wind project that will be located in the North Coast region. All three projects were awarded power purchase agreements by BC Hydro. While it is evident that large-scale developments have been able to make some headway, if one were prudent, investing time and money to enter a competitive Call for Power process might be considered too risky. BC Hydro has issued several calls for power with various requirements for participants and projects. The 2006 Call for Power awarded power purchase agreements to the wind projects noted above, however it is a process that is administratively discouraging for participation by small developers. In response, the BC Energy Plan mandated the Standing Offer Program (SOP) which was launched in April, The SOP provides a simplified, non-competitive, and less expensive process of granting contracts to projects with a capacity that does not exceed 10 MW. By decreasing the costs of participation for developers, the SOP allows smaller clean energy projects to be constructed more easily. This type of program reflects a government that sees the value of cleaner power production, regardless of scale. By creating an incentive whereby reducing greenhouse gas emissions is not a dream that can only be realized by big business or those backed by extraordinary investment, the SOP 3
13 motivates a grass-roots movement for passionate people and groups that want to improve air quality in a capacity they can afford. The power payment price for SOP projects varies depending on location, time of year, and time of day. While this program is encouraging in theory, there are already concerns that the purchase price is too low to promote economically feasible small wind farm development in many areas of the province. This report seeks to determine the feasibility of projects under the SOP and identify where prospective wind projects exist. To do this, the following objectives are addressed: To determine if the BC Predicted Wind Speed Map is an accurate tool that can confidently be used for prospecting by comparing mapped ranges to collected wind speed averages. To identify where and under what economic circumstances Standing Offer-sized wind projects are feasible in British Columbia using RETScreen economic software. To determine if the SOP is a useful incentive that will encourage development of small (50 kw to 10 MW) wind projects. 4
14 1.2 Report Outline The purpose of this report is to investigate the feasibility of wind development in British Columbia under BC Hydro s Standing Offer Program (SOP). In order to determine whether this government incentive encourages development of wind power, desktop research, as well as the BC Hydro data and wind atlas, Manifold GIS software and RETScreen economic analysis software program have been utilized. Chapter 2 is an overview of the context of wind power in British Columbia; wind resource potential with a regional focus, interconnection, policy, and collected and predicted wind data are briefly discussed. In Chapter 3, the MesoMap system used to create the BC Predicted Wind Speed Map is introduced, explained, and its assumptions and limitations discussed. Chapter 4 introduces wind resource data collected from towers around BC, discusses where and how data was collected, and how the data was analyzed, including discussion on assumptions and limitations. In Chapter 5, the predictive map is validated through comparison with the collected wind data. In Chapter 6, the regional economic feasibility of Standing Offer-sized wind projects is assessed using RETScreen. In Chapter 7, a prospecting exercise is conducted, describing the scope and identifies potential sites for feasible wind development. Sources of error are discussed in Chapter 8. Chapter 9 includes a discussion and further work possibilities. Finally Chapter 10 includes a conclusions and recommendations for developers and BC Hydro. 5
15 Chapter 2.0 Wind Power Potential A British Columbia Context 2.1 Introduction Global wind patterns and local wind systems contribute to variations in wind speed and wind direction. Global or geostrophic winds are driven by differences in temperature and pressure. These winds determine the prevailing wind direction. Local wind systems are influenced by temperature gradients and topographic effects of the earth s surface, including roughness of terrain and terrain contours, and often determine the most common wind direction. British Columbia has vast expanses of coast and mountainous terrain that promote sea breezes and mountain induced winds. These local wind patterns can have extremely powerful and predictable wind regimes and hence provide obvious potential wind farm sites. In addition to strong wind energy potential, proximity to the electrical grid, the accessibility of a site, load demand, and encouraging policies are significant variables when determining the feasibility of a project site. This chapter briefly discusses the current state of development of wind projects in the province, the wind regime in the most promising regions for development, interconnection, and provincial and federal policies. It provides a useful context as well as background information that are important to the financial analysis in Chapter 7. 6
16 2.2 State of Development of Wind Farms in British Columbia The Dokie Wind Project (144 MW) and Bear Mountain Wind Park (100 MW) are to be located in the Peace Region and the Mount Hays Wind Farm (25.5 MW) is to be located in the North Coast Region. All three projects were awarded power purchase agreements by the BC Hydro 2006 Clean Power Call. Fifteen other projects are in the later stages of development either having completed or almost completed the Environmental Assessment Process, and will be submitting proposals to the 2008 Clean Power Call. Some of the more high profile projects include the 700 MW Banks Island Wind Farm off the North Coast of BC, the 320 MW offshore Nai Kun Wind Farm off the east coast of the Queen Charlottes/Haida Gwaii islands (first of five phases), and the 99 MW Know Hill Wind Farm on Northern Vancouver Island (BC Government, 2008). In addition to the projects mentioned above, there are hundreds of other sites in BC under investigation. Very few projects are being planned on private land. The majority of projects are proposed on Crown Land, which makes up ninety-five percent of the province, and covers areas with high wind energy potential such as mountain ridges (BC Min. of Agriculture and Lands, 2008a). Accordingly, policy for tenure of Crown land for wind energy projects has been developed by the BC Ministry of Energy, Mines and Petroleum Resources (BC Min. of Agriculture and Lands, 2008b). As of September 2008, there were over 400 posted applications for Investigative Use Permits for wind power projects 7
17 in the province. The majority of projects under investigation are concentrated in the Peace Region, North Coast, Eastern and Central Interior, and on Northern Vancouver Island. 2.3 Wind Regime A Regional Focus This report focuses on the following four regions of BC that have been identified as having the strongest wind development potential and where wind development is most active: Vancouver Island, the North Cost, the Peace region, and the Southern and Eastern Interior. Nevertheless, the feasibility of wind projects in all regions could be significantly affected by issues such as proximity to the grid, site access prevented by terrain features such as ridges, turbine suitability for local conditions, and regional power demand (GH, 2008). The four regions of focus are illustrated in Figure 2.1 and described in greater detail in the following sections. 8
![Figure 2.1: Areas with greatest wind development potential in BC [BC Hydro LTAP Resource Options Update www.bchydro.com/rx_files/info/info54510.pdf] 2.3.](/docs-images/95/125501563/images/18-0.jpg "1 Vancouver Island Vancouver Island is located off the southwest coast of British Columbia.")
18 Figure 2.1: Areas with greatest wind development potential in BC [BC Hydro LTAP Resource Options Update Vancouver Island Vancouver Island is located off the southwest coast of British Columbia. The majority of wind farm sites proposed in BC are located on the Island to take advantage of exposure to the coast and terrain features (GH, 2008). The predominant wind regime is driven from the southeast and northwest. High mean annual wind speeds ( ms -1 at 80 m hub height) are expected for areas where conditions are suitable and that are well exposed. 9
19 2.3.2 North Coast Region The North Coast Region covers the western central coast of BC. Promising wind sites are located inland near Smithers, Prince Rupert, and Kitimat, as well as on coastal islands on the east side of Hecate Strait. The predominant wind regime is driven from the southeast direction, parallel to the coast. Significant westerly winds have also been suggested (GH, 2008). High mean annual wind speeds ( ms -1 at 80 m hub height) are expected in this region, being particularly high in sheltered inland and coastal island sites Peace Region The Peace region covers a large expanse of eastern mainland BC. The complex mountainous terrain makes predictions of local wind conditions difficult and therefore highly localized. The promising wind sites would exploit elevated, exposed areas with the speedup effects from terrain. The predominant wind regime comes from the west and southeast depending on the site location. Relatively high mean annual average wind speeds ( m s -1 at 80 m hub height) are expected in this region Southern and Eastern Interior Regions This region covers the largest area extending through southern and eastern interior parts of BC. As with the Peace region, the promising wind sites would exploit elevated, exposed areas with the speedup effects from terrain, as well as lengthy plateaus. Depending on the location, the wind regime is predominantly from the southwest or from the northeast and southwest directions. High mean annual wind speeds ( m s -1 at 80 m hub height) are expected in this region, in suitably well exposed sites. The 10
20 complex mountainous terrain makes predictions of local wind conditions difficult and therefore highly localized. 2.4 Interconnection BC Hydro and the British Columbia Transmission Corporation (BCTC) are the two groups responsible for most of the BC electricity grid. BC Hydro is responsible for managing the distribution grid while the transmission lines throughout the province are managed by BCTC. BC Hydro and the BCTC are governed by the BC Utilities Commission. Distribution line voltages in BC are commonly 12 kv and 25 kv. The transmission line voltages are commonly 69 kv, 138 kv, 230 kv, and 500 kv. Most wind projects will likely connect to the transmission lines, however some Standing Offer-sized projects (50 kw to 10 MW) can connect to the 25 kv distribution lines. Figure 2.2 shows the BC Electricity and Distribution Grid. In this report, the economic feasibility and site prospecting analyses in Chapters 6 and 7 assume a conservative but realistic distance of 5 km from 69 kv transmission lines. 11

.")

21 Figure 2.2. BC Hydro Transmission and Distribution Grid (BC Hydro, 2008c). In April 2008, the BCTC released a Stage 1 Study Report on the Wind Integration Project Transmission Planning Study that examined the impact on the transmission network of connecting intermittent generation systems, such as individual wind power facilities, in different regions around BC (BCTC, 2008). The report also proposed solutions, such as reinforcing existing lines and adding new transformers, to integrate wind power into the grid in a reliable and cost-effective manner. Transient voltage dip and branch overload were determined to be the most restrictive factors of the existing system. It was concluded that the BC transmission system has the ability to integrate 12
22 substantial wind generation in different areas studied in the Peace region, North Coast, Northern Vancouver Island, and the Eastern interior. 2.5 Provincial and Federal Policies for Wind Power The response to the BC Hydro Calls for Power demonstrates the interest in developing wind power in the province and the anticipation for a positive return on investment on large-scale wind energy development. But the question remains whether projects on a smaller scale have the ability to be prosperous. The purpose of this report is to evaluate the effectiveness of the BC Hydro Standing Offer Program at encouraging the development of smaller (<10 MW) projects and illustrate where potential projects might be located. This section introduces the rules of the existing provincial incentive, as well as the federal ecoenergy Renewable Power Program that has been included in the financial analysis in Chapter BC Hydro Calls for Power BC Hydro has been issuing Calls for Power from Independent Power Producers for green power projects since The calls have had various requirements for projects and participants. This is a competitive process whereby BC Hydro reviews the project proposals and selects those that are the most economically viable. The first wind energy project in BC, Holberg, was awarded a Power Purchase Agreement in the 2005 Call for 13
23 Power. However this project was cancelled, partly due to the proponent deciding that the agreed upon power purchase price was too low to afford development. The Call for Tenders process was changed to a request for proposals (RFP) -style Clean Power Call in order to provide more flexibility to BC Hydro when working with developers in drafting contract terms that are cost-effective and conditions catering to the needs of large, complex power projects (BC Hydro, 2008b). The most recent 2008 Clean Power Call was issued in June, The RFP target will be to acquire 5,000 GWh per year for seasonal and hourly peak energy demands BC Hydro Standing Offer Program (SOP) The Standing Offer Program (SOP) is a new initiative of BC Hydro that launched in April 2008 to facilitate development of wind energy by purchasing the energy from small projects with a nameplate capacity between 50 kw and 10 MW. The SOP was developed to provide a more straightforward, non-competitive and cheaper process, granting contracts for projects meeting specific criteria (BC Hydro, 2008). Under the SOP, BC Hydro offers a variable base payment price for all Proven Generation Technologies, which can range from $69-$84 per megawatt hour according to region and time of delivery. Higher payment prices are offered in regions such as Vancouver Island where the project can be located near a load centre. The base price will not be revised any earlier than the second year of the program. Monthly and diurnal multipliers are also applied to the base price according to periods of heavy and light 14
24 load. Heavy load hours are considered to be between 06:00 to 22:00 Pacific Time, Monday through Saturday (excluding statutory holidays). Light load hours are all those that are not heavy load hours. In addition, a payment of $3.10 per megawatt hour is available for the Environmental Attributes (BC Hydro, 2008). Table 2.1 and Table 2.2 outline the price structure from the SOP terms for the regional base price and time of delivery multipliers respectively. Developers can sign into contracts for 20 or 40 year terms. Table 2.1 Regional base price, Environmental Attributes Price, and Total Price. Region Base Price (2008$/MWh) Environmental Attributes Price (if any) (CAN$/MWh) Total Price (CAN$/MWh) Vancouver Island Lower Mainland Kelly/Nicola Central Interior Peace Region North Coast South Interior East Kootenay
25 Table 2.2 Base price escalation. Time of Delivery Adjustment to Escalated Base Price (percentage) Month Heavy Load Hours (HLH) January 125% 106% February 126% 110% March 114% 106% April 103% 95% May 92% 76% June 90% 72% July 91% 72% August 95% 81% September 96% 88% October 108% 97% November 109% 102% December 122% 102% Light Load Hours (LLH) This report assesses whether the payment price is sufficient to attract development of smaller wind projects in different regions throughout the province ecoenergy for Renewable Power The ecoenergy for Renewable Power program (EERP) is a federal initiative that started in April, Its mandate is to increase the supply of renewable power sources. For up to 10 years, the program will provide a one cent per kilowatt-hour financial incentive for projects constructed before March 31, Unlike other provinces, such as Ontario, a developer in BC is not required to transfer any of the incentive claimed under the ecoenergy program to the utility, BC Hydro. 16
26 Chapter 3.0 British Columbia Predicted Wind Speed Map - MesoMap System 3.1 Introduction In 2000, BC Hydro conducted a wind mapping initiative with the purpose of identifying potential wind sites. Consulting company, AWS Truewind, was commissioned to develop the British Columbia Predicted Wind Speed Map. The map (see Appendix A) image displays colour-coded predictions of the average annual wind speed in metres per second at 65 m hub height at a 1000 m resolution (BC Hydro, 2000).The wind speeds are rated poor (<4 m/s), fair (4-6 m/s), good (6-8 m/s), or very good (> 8 m/s). The map was intended to be used as a macroscale prospecting tool for developers to identify potential sites for wind power projects. It was also useful for BC Hydro to determine the potential future energy that could be generated by wind. Currently, additional wind potential and characteristics are being modeled in a new mesoscale wind data study commissioned by BC Hydro. The BC Predicted Wind Speed Map was created using the MesoMap system. This system is a dynamic atmospheric simulation model which combines mesoscale and microscale mathematical models, weather databases, and computer systems to predict wind speeds at a high resolution over large regions without surface wind measurements. It is capable of managing complex wind conditions, such as lake-sea breezes and katabatic mountain winds. MesoMap is considered one of the strongest and most 17
27 accurate systems available for wind mapping compared to similar models (AWS Truewind,?). The BC Predicted Wind Speed Map is used in this report as a tool to identify where the average annual wind speed is sufficient to warrant a feasible project under the BC Hydro Standing Offer Program according to a variety of assumptions and constraints (see Chapter 7 Prospecting for SOP). The map is validated in Chapter 5 Map Validation. The sections to follow describe the models used, data sources, mapping process, and assumptions and limitations of the MesoMap system used to develop the BC Predicted Wind Speed Map. 3.2 MesoMap Models The MesoMap system combines two models. A mesoscale weather model (MASS) is used to initialize the microscale wind flow model (WindMap) (AWST,?b). MASS or Mesoscale Atmospheric Simulation System is a numerical weather model developed by MESO Inc. It is different from other mesoscale models as it has been specifically adapted for wind resource assessment. The important meteorological inputs into MASS are reanalysis and rawinsonde data (see section 3.3). Using this data, MASS determines the evolution of wind and weather patterns that reflect factors such as terrain, oceans and lakes, vegetation, and solar heating. MASS is a dynamic model that simulates atmospheric conditions in short time steps. Processing of the model is computationally demanding, therefore MASS is coupled with WindMap, a less complex and faster model. 18
28 WindMap is a mass-conserving wind flow model that is used to account for local terrain and surface roughness variations, improving the resolution of the MASS simulations. In the case of the BC Predicted Wind Speed Map, the results of the model were assembled to produce a map of mean wind speed. 3.3 Data Sources The MASS model utilizes a combination of global, meteorological and geophysical databases. The key meteorological inputs into MASS are rawinsonde and reanalysis data, and measurements of land surface (BC Hydro, 2004).The reanalysis database is produced by the US National Centres for Environmental Prediction and the National Centre for Atmospheric Research. It is composed of gridded historical atmospheric conditions at all levels of the atmosphere in intervals of six hours and is considered to be the most important database to MASS. The important land cover inputs are elevation, normalized differential vegetation index (NDVI), sea-surface temperature, and soil moisture. The land cover and NDVI data are translated by the model into physical parameters, such as surface roughness and albedo. The MesoMap system requires highresolution land cover and topographical data in order to output high resolution wind maps. 19
29 3.4 The Mapping Process The development of a wind resource map is completed by the MesoMap system following a sequence of steps. The MASS model randomly selects 366 days from a 15- year period to simulate conditions. Three-dimensional wind and other weather characteristics are generated by each simulation and are stored at hourly intervals. Then the results of the simulations are summarised in data files to be input into WindMap. For the BC Predicted Wind Speed Map, the WindMap program produced a color-coded map of wind speed at 65 metres height above ground. 3.5 Conclusion As with any modelling system, expecting 100% accuracy is unrealistic (see Chapter 8 Sources of Error for more detail). However, the proven accuracy of the MesoMap system in studies across the globe instils significant confidence. Therefore, the BC Predicted Wind Speed Map generated by the MesoMap system could be considered a dependable tool for prospecting potential regions for wind sites. To validate this further, collected data was used to calculate annual average wind speeds at sites within the four focus regions (see Chapter 4 Collected Meteorological Data) and then compared to the modeled wind speed range at the same location (see Chapter 5 Map Validation). 20
30 Chapter 4.0 Collected Meteorological Data 4.1 Introduction BC Hydro performed a wind monitoring data collection program between May 2000 and August 2004 at 18 stations spread between the Peace, North Coast, Vancouver Island, and Southern and Eastern Interior regions in a variety of terrains and elevations (BC Hydro, 2004). The purpose of this initiative was to characterize the wind potential throughout the province. This data has been made available for free download on the BC Hydro website. Each regional folder includes raw, unprocessed data files. Each individual site folder includes a summary document containing information about the site, data format, and monitoring equipment. The wind monitoring stations collected a variety of meteorological data for at least one year, but have since been either taken over by other parties or decommissioned. For this report, the collected wind speed data was formatted from its raw form, validated, and verified in order to calculate the annual average wind speeds at the monitoring locations. The average wind speeds were then adjusted to 65 metres using wind shear calculations to match the modeled hub height in the BC Predicted Wind Speed Map. Chapter 5 uses these values to compare to the map. Not all monitoring stations were included in the final analysis. Several sites were excluded from the study, including Mount Hays, Mount Wartenbe, Puleteny Point, and Rumble North. Mount Hays was removed due to higher wind speeds at lower heights indicating suspect data or monitoring equipment. The remaining three sites were 21
31 removed due to incomplete annual data sets (see Sections Data Quality and Wind Shear). 4.2 Location and Duration of Monitoring Wind monitoring data was collected at 18 stations focusing on the Peace, North Coast, Vancouver Island, and Southern and Eastern Interior regions. Table 4.1 presents the name, region, coordinates, elevation, and approximate duration of the monitoring at the different meteorological stations. A map of the monitoring station locations is provided in Figure
32 Table 4.1 BC Hydro meteorological station location and monitoring duration details. Site Name Region Latitude Longitude Elev (m) Approx. Period of Monitoring (MM/YY) Aasen Peace Region ' 757 Vancouver Alert Bay Island Ashcroft Interior Bald Mountain Interior Bear Mountain Peace Region Bessborough Peace Region Chilko Lake Interior Erbe Peace Region Vancouver Franklin Range Island Great Central Vancouver Lake Island Vancouver Jordan River Island ' ' 671 Merritt Interior Mount Hays North Coast Mount Wartenbe Peace Region Vancouver Port Alice Island Vancouver Pulteney Point Island Vancouver Rumble Island Vancouver Rumble North Island /01 07/03 04/00 05/02 12/01 04/03 11/00 05/02 10/01 07/04 10/01 07/03 11/00 05/02 10/01 07/03 09/02 09/03 09/01 06/03 09/00 05/02 12/01 08/03 10/00 06/04 09/02 10/03 06/01 05/03 07/00 01/03 09/01 03/04 07/02 08/04 23

33 Figure 4.1 Monitoring Station Locations. 24
34 4.3 Measurement Systems The BC Hydro wind monitoring program stations consisted of towers with wind and other sensors connected to dataloggers including a power supply and communication system. The tower type and equipment used at the different stations is included in Appendix B. In general, towers were installed with wind and temperature sensors at 30 metres and/or 50 metres elevation above ground level. The arrangement of the output from the dataloggers was of particular importance to the formatting of the data for this report. Campbell Scientific and NRG Systems dataloggers were the two types used in the monitoring program. A brief description of the output from the dataloggers is provided below Campbell Scientific Campbell Scientific dataloggers record sensor readings at one second intervals which are averaged into 10-minute measurements. Collected data records are presented in rows of 10-minute records and a daily record row at the end of each day. 25
35 4.3.2 NRG Dataloggers NRG dataloggers record sensor readings that are collected at two second intervals and averaged into 10-minute measurements as well as standard deviation, minimum and maximum values for each sensor. Dates are recorded as year-month-day. 4.4 Data Data Overview The type of meteorological and system data collected and recorded at each station are included in Table 4.2. Table 4.2 Data collected from sensors and system. Variable Unit Wind Speed (avg., max, min, vertical, standard deviation) m/s Wind direction degrees Ambient Air Temperature (avg, min, max) degrees C Barometric Pressure kpa Julian day n/a Relative Humidity % Voltage (avg, min, max) Volts 26
36 The data is provided with the following disclaimer: BC Hydro does not represent, guarantee or warrant to any third party, either expressly or by implication: (a) the accuracy, completeness or usefulness of, (b) the intellectual or other property rights of any person or party in, or (c) the merchantability, safety or fitness for purpose of, any information, product or process disclosed, or described in this wind data. (BC Hydro, 2004) Data Format The meteorological station data is provided in a raw, unprocessed format. Each general region for wind monitoring Peace, North Coast, Vancouver Island, and Eastern and Southern Interior has a compressed (.zip) file. Each file is in comma-delimited format. For the purposes of this report, data files were imported into excel to verify and manipulate data, and perform calculations with ease. 4.5 Data Manipulation Data Arrangement After the raw data were imported and verified, the data that had been collected from monitoring stations utilizing the Campbell Scientific (CS) dataloggers required further filtering. The CS dataloggers include 10-minute and daily records. For the purposes of the analysis in this study, the daily records were removed from each dataset so that monthly average wind speeds could be calculated. Next the average annual wind speeds were calculated for all monitoring stations at each wind sensor height. 27
37 4.5.2 Wind Shear Wind speed data was collected using elevated wind sensors. Ten of the fourteen monitoring stations collected wind speed data at 30 metres and 50 metres; two monitoring stations collected wind speed data at 20 metres and 30 metres; two other monitoring stations collected wind speed data at only 30 metres. Wind shear calculations were used to adjust the candidate data to a 65 metre hub height in order to compare values to ranges illustrated in the BC Predicted Wind Speed Map. The mean annual wind speeds derived for Merritt, Ashcroft, Bear Mountain, Bessborough, Aasen, Erbe, Alert Bay, Jordan River, Rumble, Port Alice, Great Central Lake, and Franklin Range were extrapolated to a 65 metre hub height by calculating their wind shear exponent after rearranging the formula for wind shear (see below). The wind shear exponents were estimated for sites with sensors at only one height; the wind shear exponents at Bald Mountain and Chilko Lake were estimated to 0.25 based on the appearance of scattered forested terrain on Google Earth. Final velocities were calculated using the following expression for wind shear: v / v o = (h / h o) α where, v = the velocity at height h (m/s) v o = the velocity at height h o (m/s) α = the wind shear exponent 28
38 4.6 Results The annual average wind speeds at the 14 BC Hydro Monitoring Stations included in this analysis, extrapolated to a 65 metre hub height, are presented in Table 4.3. Table 4.3 Annual average wind speeds at 65 metres. Site Name Region Measured Wind 65 m (m/s) Bald Mountain Interior 6.28 Chilko Lake Interior 4.46 Merritt Interior 5.8 Ashcroft Interior 4.07 Mount Hays North Coast Removed from analysis wind shear problems Bear Mountain Peace Region 7.49 Bessborough Peace Region 5.7 Aasen Peace Region 5.67 Erbe Peace Region 5.32 Mount Wartenbe Peace Region Removed from analysis incomplete data set Alert Bay Vancouver Island 5.8 Jordan River Vancouver Island 5.23 Pulteney Point Vancouver Island Removed from analysis incomplete data set Port Alice Vancouver Island 4.77 Great Central Lake Vancouver Island 3.27 Rumble Vancouver Island 6.68 Rumble North Vancouver Island Removed from analysis incomplete data set Franklin Range Vancouver Island Conclusions BC Hydro included summary files for each monitoring station that provided information about known gaps in the data, including explanations if known. Due to the number of known gaps in data collected at Mount Wartenbe and Rumble North, the 29
39 data sets were deemed incomplete for annual averaging and excluded from this analysis. Data validation and verification was performed for each remaining datasets. A range test was performed on all wind speed data to highlight values outside the 0 to 25 m/s range. Suspect values were examined and either retained or rejected depending on their context in the data set. Data sets from all monitoring stations produced data recovery rates between 97% and 100%. The accuracy of the monitoring equipment used in the data collection program was assumed to adhere to the standards specified by the manufacturer. See Section 8.3 Monitoring Equipment for more details on the assumed accuracy of monitoring equipment. In general, some uncertainty exists in these datasets, however based on the station summary files provided by BC Hydro, assumed accuracy of monitoring equipment, the data recovery rates, and the industry standard wind shear calculation utilized, the results are considered accurate enough for the purposes of this report (see Chapter 8 Sources of Error for more detail). Based on the reasonable accuracy of the modeled map and the collected data, the following chapter attempts to validate the BC Predicted Wind Speed Map by comparing wind speeds at monitoring station locations. 30
40 Chapter 5.0 Map Comparison 5.1 Introduction The previous chapters have briefly addressed the accuracy of the modeled BC Predicted Wind Speed Map and observed data. This chapter attempts to further validate the modeled map by comparing the average annual wind speeds from the collected data to the location on the modeled map. Although the model has been proven effective for mapping large areas, the question remains on whether it is suitable for selecting promising project sites. The purpose of this exercise is to be able to determine if the map is a reliable tool for identifying prospective wind sites. 5.2 Comparison of Model Map to Collected Data For this report, a map was prepared to show the wind resource in the province as predicted by the model overlaid with the monitoring station locations. The modeled map was georeferenced in Manifold, a GIS software program, by georegistering known coordinates of the province. The BC Hydro monitoring station locations were added to the map. For presentation in this report, the prepared map was divided into three regional sections; Figure 5.1 displays the Peace Region, Figure 5.2 displays Vancouver Island, and Figure 3.2 displays the Eastern and Southern Interior region. The North Coast is not included in this comparison because the only monitoring station in that region was omitted from this study. 31

41 Figure 5.1 Monitoring stations overlaid on modeled map on Vancouver Island. 32

42 Figure 5.2 Monitoring stations overlaid on modeled map in the Peace Region. 33

43 Figure 5.3 Monitoring stations overlaid on modeled map in the Eastern and Southern Interior Region 34
44 A visual inspection was performed to identify the predicted annual average wind speed at each monitoring station according to the BC Predicted Wind Speed Map legend. The wind speed range observed at the centre of the MET tower location circles was used. These values were noted and compared to calculated annual average wind speeds from Chapter 4. The results are presented in Table 5.1. Table 5.1 Comparison of modeled annual average predicted wind speed to measured wind speed Site Name Region Measured Wind 65 m (m/s) Modeled Wind Speed 65 m (m/s) Does measured wind speed fit in modeled range (Y/N) Bald Mountain Interior to 8 Y Chilko Lake Interior to 6 Y Merritt Interior to 6 Y Ashcroft Interior to 6 Y Mount Hays North Coast Removed from data set n/a Bear Mountain Peace Region to 6 N (too high) Bessborough Peace Region to 6 Y Aasen Peace Region to 6 Y Erbe Peace Region to 6 Y Mount Wartenbe Peace Region Removed from data set n/a Alert Bay Vancouver Island to 6 Y Jordan River Vancouver Island to 6 Y Pulteney Point Vancouver Island Removed from data set n/a Port Alice Vancouver Island to 6 Y Great Central Lake Vancouver Island 3.27 <4 Y Rumble Vancouver Island to 6 N (too high) Rumble North Vancouver Island Removed from data set n/a Franklin Range Vancouver Island to 6 Y The wind speeds measured at the monitoring stations fit within the range of the predicted wind speed model at 12 of 14 (86%) sites included in this analysis. In both 35
45 cases where the measured wind speed was outside the predicted wind speed range, the model under predicted. 5.3 Conclusion In addition to the potential inaccuracies in the predicted wind speed map and the collected and adjusted data, another source of imprecision comes from the georeferencing process (see Chapter 8 Sources of Error for more detail). The measured wind speeds have matched the predicted wind speeds at most locations. A visual inspection of the map has identified that annual average wind speeds comfortably fit within the ranges predicted by the modeled wind speed map at 86% of wind monitoring stations. In those cases where the values fell outside the range, the model underpredicted. It can be said that the model provides a conservative estimate of the local wind speed at the 65m height. Although a comparison was not possible in the North Coast region due to removal of the site from the data set, the ability of the model to predict wind speeds at the remaining sites was sufficient to assume reasonable accuracy of the map in general. Therefore it can be concluded that the BC Predicted Wind Speed Map can be used for prospecting potential wind sites. 36
46 Chapter 6.0 Economic Analysis 6.1 Introduction The economic feasibility of wind farm projects is dependent on a number of factors, including available wind resource, proximity to the grid, site accessibility, and the value of the power purchase agreement. For this chapter, RETScreen, an economic analysis software program, was used to perform feasibility studies for 10 MW SOP projects (NRCAN, 2005). Analyses have been conducted for each of the four promising regions Vancouver Island, North Coast, Peace, and Interior regions to determine the wind speed required for projects signing into 20 or 40 year SOP contracts to achieve 0% or 8% internal rate of return (IRR). For each analysis, the input wind speed was adjusted until the appropriate IRR was calculated. The IRR was used as a measure to determine the financial viability of a project. The higher the IRR, the more financially viable the project is. A 0% IRR has been chosen to determine wind speeds that will allow the project to break even; this case is only possible where external investment is not required. Based on personal industry experience, an 8% IRR is considered low but reasonable for community-based, small projects to receive financing. The results of these analyses will be applied in the next chapter to identify areas on the BC Wind Map where 10 MW SOP projects could be economically feasible. 37
47 Development costs for wind projects in British Columbia are just being realized by developers building the first wind farms that have yet to become operational. Therefore, costs specific to BC are largely unknown, especially those costs for small SOP wind projects. The costs assumed in these analyses are based upon industry experiences when developing 10 MW projects in Ontario. Assumptions that have been made in this analysis are addressed below RETScreen the Tool The RETScreen International Renewable Energy Project Analysis Software was developed by Natural Resources Canada (NRCAN, 2005). It is a feasibility analysis modelling tool that uses a series of spreadsheets in Excel whereby you insert weather, project, costs and other information to assess project feasibility. RETScreen is used by planners and decision-makers in the wind industry. The user can choose from a selection of wind turbine models and manufacturers. Included in the RETScreen package are wind speed distributions that can be chosen to reflect the local wind regime. 6.2 RETScreen Analysis Introduction The analyses investigated five Enercon E82 wind turbines at a hub height of 80 meters for a 10 MW sized project suitable for the Standing Offer Program. This is a feasibility study and input variables were the same for each region with the exception of weather information and the avoided cost of energy (power payment price). It is important to 38
48 note that costs and financing structure can be expected to vary significantly for individual wind farm projects. All monetary values are presented in 2008 Canadian dollars. The RETScreen analysis sheets for each region to acquire 0% and 8% IRR in 20 year and 40 year periods are included in Appendix C Analysis Discussion The following sections describe the different worksheets in the RETScreen Excel model. Some sections include a table summarising the input values and assumptions for their use Energy Model The energy model section was adjusted to represent known or modeled site characteristics. Wind speeds were adjusted as the analysis required (meeting 0% and 8% IRR). Table 6.1 displays the input values in the energy model section and provides a justification of values. 39
49 Table 6.1 Values and assumptions summary for RETScreen energy model section. Section and Heading Value Justifications, Assumptions, and Comments Site Conditions Annual average wind speed variable Adjusted to reach IRR goals Wind shear exponent 0.2 Appropriate value for rough terrain. (also found to be average value for monitoring stations) Average atmospheric pressure Vancouver Island North Coast Eastern and Southern Interior Peace Region Annual average temperature Vancouver Island North Coast Eastern and Southern Interior Peace Region System Characteristics Grid type 98 kpa 97 kpa 88 kpa 91 kpa 9 ºC 5 ºC 4 ºC 1 ºC Based on RETScreen Database- Average pressure was calculated for each region using all regional weather stations from database Based on RETScreen Database- Average temperature was calculated for each region using all regional weather stations from database Central-Grid Requirement of SOP Array losses 5% No other turbines present Airfoil soiling and/or icing losses 2% Other downtime losses 2% Miscellaneous losses 4% Typical value for areas not heavily influenced by waterbodies Typical value, but could later be refined by manufacturer based on maintenance contract Assumed losses due to unforeseen circumstances Equipment Data The equipment data page summarizes the technical characteristics specific to the chosen turbine. The turbine details as well as its associated power curve were taken from the manufacturer s website and input into RETScreen. The equipment used in the analyses is the Enercon E82 turbine. It is a 2 MW turbine with a rotor blade diameter of 82 m, a swept area of 5281 m 2, and hub height of 80 m. A Weibull shape factor, k-factor, of 2.5 was used and considered suitable because it 40
50 represents a value that lies between inland and coastal regions. The k-factor is expected to vary between different potential sites. Furthermore, the same average wind speed can have very different wind speed distributions. The decision to assume the same k-factor of 2.5 for all potential sites was made due to time restraints; the complexity of analysis to determine an accurate k-factor for each region would have required more time than was available Cost Analysis The values in the cost analysis were derived from either industry standards 1 or quotes from hardware manufacturers. Estimated costs are subject to uncertainty and variability of hardware availability, cost of raw materials, and currency exchange rates. The costs used in the RETScreen analyses represent current economics and exchange rates. RETScreen divides the analysis into subsections according to when the cost is incurred. A description of the types of costs in the cost analysis section is provided below, while input values and the reasoning behind them are provided in summary Table 6.2. Capital Costs The first subsection of the capital costs are those fees associated with the feasibility study. This section corresponds to the consulting fees for the project. The values were taken from standard engineering contracts between developers and a competitive consulting company in Ontario. Development and Engineering costs represent the stage 1 Industry standards were learned by the author while working for Wind Energy Engineering consulting company based in Ontario with an office in BC with current experience in prospecting. 41
51 of the project prior to construction. Items such as permitting, project management consulting, and detailed engineering work are included in this section. The costs presented in the Energy Equipment and Balance of Plant sections were part of a package provided by Enercon including many of the construction details, such as foundation, turbine erection, and geotechnical investigation. Annual Costs Annual costs represent the expenses that a project will incur every year. Enercon provides a 12 year maintenance package that is a function of power produced. Other expenses include insurance, land use costs, and site visits. Periodic Costs Periodic costs are large recurring lump sum costs associated with replacement of machinery and major repair work such as delamination. 42
52 Table 6.2 Values and assumptions summary for RETScreen cost analysis section. Section and Heading Value Justifications, Assumptions, and Comments Initial Costs Feasibility Study Site investigation 8,000 Based on site-appropriate consulting fees Wind resource assessment 55,000 Based on site-appropriate consulting fees Environmental assessment 160,000 Based on site-appropriate consulting fees - Includes cost associated with pre and post construction monitoring Preliminary design 25,000 Based on site-appropriate consulting fees Detailed cost estimate 21,000 Based on site-appropriate consulting Project management 10,000 Based on site-appropriate consulting fees Development PPA negotiation 15,000 Assumes time required to obtain Standing Offer Contract (based on similar process in Ontario) Permits and approvals 80,000 Includes Zoning & Official Plan Amendments, Ministry of Transportation Applications, Crown Land applications, potential payments to First Nations groups, and Consultation Time Land survey 6,000 Cost associated with survey, admin, etc. Project financing 6,000 Assumes financing will be arranged "In-House" by developers Legal and accounting 12,000 Includes turbine purchase contract & negotiation, maintenance contract & negotiation Project management 45,000 Assumes task will be handled by consultant Travel and accommodation 10,000 For development admin, etc Engineering Assumes turbine location will be established after Feasibility Wind turbine(s) micro-siting 5,000 Study is complete Mechanical design - Limited to a review of plans/specs determined by Enercon as part of "Turnkey" type package Electrical design 100,000 Based on industry experience in Ontario Civil design 25,000 Foundation and Design Included in Enercon as part of "Turnkey" type package. Cost associated with consultation review of soil and road spec. Tenders and contracting 15,000 Assumes some difficulty due to small size of project. Assumes one general all-purpose wind energy construction contractor. Construction supervision 90,000 Assumes 5 months of construction of road/consultation/site trips continued... 43
53 Table 6.2 con t Section and Heading Value Justifications, Assumptions, and Comments Initial Costs Energy Equipment Wind turbine(s) 2,340,000 per MW Based on quote from Enercon Transportation - Included in turbine cost Balance of Plant Road construction 240,000 Est. based on 6 km of road and a cost of $45,000 / km Transmission line 725,000 Est. based on 5 km to grid connection and a cost of $145,000/km (5 km utilized in scope of Chapter 7 ) Substation 180,000 Substation Costs - Typical for a single substation in Ontario (one substation assumed to connect to 69 kv or lower line this utilized in scope of Chapter 7). HONI Costs 500,000 Cost covers BC Hydro upgrade costs - conservative estimate based on Ontario experience Miscellaneous Training 12,000 Estimated value, external to what Enercon provides (SCADA, Switchhouse Maintenance) Commissioning 20,000 Cost associated with public opening, technical review by BC Hydro, etc. Contingencies 515,300 Assumed 2% of annual costs Interest during construction 328,504 Assumed 5 months of construction at 6% interest Annual Costs O & M Land lease 5,000 Assumed 2% of gross revenue (GH, 2008) Property taxes 22,000 Project assumed to be on Crown Land where federal taxes do not apply. However land will also be part of Regional District where taxes would likely apply. A conservative estimate applied here based on Ontario experience. Insurance premium 50,000 Based on an estimate of 10,000 per turbine, (Industry Standard, reduction due to O&M package). Transmission line maintenance 9,050 Based on an industry standard of 1% of total cost of lines. Assumes proponent owns line. Parts and labour 92,911 Covers the cost of telecom and SCADA Travel and accommodation 3,000 Cost of traveling to Site per year General and administrative 16,377 Assumption for operation of farm/re-occuring consultation costs Other - O&M varies with wind speed Cost of Enercon's O&M plan, assumes 1.48 exchange rate, O&M a function of power output (Enercon price quote) Contingencies continued... varies with wind speed Assumes 4% of annual costs 44
54 Table 6.2 Concluded. Section and Heading Periodic Costs Value ($CAN) Blade Repair 500,000 Justifications, Assumptions, and Comments Every 15 years blade maintenance is conducted and one blade replaced (assumes $250,000 for blade replacement and $250,000 of blade repair over 15 years) Turbines 23,400,000 Every 21 years turbines (10 MW) need to be replaced RETScreen Financial Summary The input parameters in this section of the RETScreen analysis include the project life, inflation and avoided cost of energy. The project life was adjusted to 20 and 40 years to match the two options for potential SOP contract periods. The wind speed was also adjusted to achieve an IRR of 0% or 8%. The SOP payment and EERP funding parameters were input in this section. The base price in the SOP ranges depended on project location (see Section BC SOP). An additional Environmental Attributes Price is also available for projects that receive Environmental Certification. This additional price was included for this analysis, however not all developers will be eligible for this additional payment. Final prices depend on time of delivery diurnal and monthly which were not taken into consideration in this analysis. Escalation rates for diurnal and monthly periods were all averaged together. The average value for all the escalation adjustments was 100%, therefore only the base rates, excluding any escalation, were considered in the financial analyses. The total of the regional base price plus the Environmental Attributes price was input for the avoided cost of energy. The ecoenergy funding was input for the RE 45
55 production credit. The RE production credit duration is terminated after 10 years and was reflected in the analysis. Table 6.3 displays the input values for the financial summary section and provides a justification of values. Table 6.3 Values and assumptions summary for RETScreen financial summary section. Section and Heading Avoided cost of energy Vancouver Island North Coast Eastern and Southern Interior Peace Region Value $/kwh $/kwh $/kwh $/kwh Justifications, Assumptions, and Comments Assumes regional Standing Offer + Environmental Attributes Payment Prices EERP Funding 0.01 $/kwh Assumes EERP funding Energy cost escalation rate 0.5% Based on Standard Offer Program Rules Inflation 2.50% Standard Assumption Discount rate 10% Standard Assumption Project life 20 and 40 years According to SOP terms Debt Ratio 75% Assumed Debt Interest Rate 7.0% Assumed Debt Term 15 years Assumed Base Case Results The regional wind speeds that were found to achieve IRRs of 0% and 8% in 20 and 40 year terms are summarised in Table 6.4. In all cases, lower wind speeds were able to reach the IRR goals in 20 year terms compared to 40 year terms. Lower wind speeds were profitable on Vancouver Island compared to the other regions and had the highest payment price. However, the relationship between payment price and wind speed was not found to be inversely proportional as was expected having input identical costs into RETScreen. (see section 6.3 Discussion). For example, the Southern and Eastern Interior 46
56 region required the highest wind speeds to reach IRR goals but had the second highest payment price of all regions. Table 6.4 Summary of wind speeds to achieve 0% and 8% IRRs in 20 and 40 year SOP terms. Region Wind Speed (m/s) at 65 metres (scaled to using the power law) Expected IRR IRR = 0% IRR = 8% SOP Payment Contract term 20 years 40 years 20 years 40 years Price ($/kwh) Vancouver Island North Coast Southern and Eastern Interior Peace Sensitivity Analysis RETScreen was used to conduct a sensitivity analysis for each scenario to determine how SOP payment price and project lifetime affect the financial outcome. While the financial inputs into the RETScreen model were based on industry standards and educated approximations, it is still reasonable to expect some inaccuracy with assumptions and variations in costs from project to project. The sensitivity analysis is a valuable tool that can reveal significant sensitivities of a project to particular variables. The sensitivity analysis looked at percent changes in capital costs and annual costs compared to changes in the avoided cost of energy. Table 6.5 shows the IRR for a 10% increase in payment price, a decrease of 10% in the capital costs and a decrease of 10% in the annual costs. 47
57 Table 6.5 Sensitivity analysis of payment price, capital, and annual costs. Vancouver Island (base pay = ) North Coast (base pay = ) Southern and Eastern Interior (base pay = ) Peace (base pay = 0.073) Project Lifetime Base Case IRR (%) Payment Price increased by 10% (IRR (%)) Capital Costs reduced by 10% (IRR (%)) Annual Costs reduced by 10% (IRR (%)) The sensitivities analyses of each scenario produced nearly identical results in all studied regions. A review of the sensitivity analysis revealed that scenarios were more sensitive to payment price rather than initial costs and more sensitive to initial costs than annual costs. 6.3 Discussion The RETScreen analysis revealed that Vancouver Island, the region eligible for the greatest payment price in the SOP, has the greatest potential for reaching IRR goals at lower wind speeds. An interesting observation was that the payment price did not relate inversely to project profitability; while the payment price for the remaining three studied regions were quite similar to each other, the highest of the three, the eastern and southern interior region, required the greatest wind speeds to reach IRR goals. This observation can be explained by regional variations in atmospheric pressure. In regions 48
58 with higher atmospheric pressure, such as the coastal and lowland regions of Vancouver Island and the North Coast, there is more energy in the wind used by the turbine. Consequently, the inland, often mountainous Southern and Eastern Interior region with an average annual atmospheric pressure of approximately 88 kpa required greater wind speeds than the higher pressure Peace region (atmospheric pressure of 91 kpa) and North Coast region (atmospheric pressure of 97 kpa) that receive lower power payment prices to reach IRR goals. Vancouver Island has several variables that promote potential wind farm developments higher power payment price and higher atmospheric pressure. The RETScreen analysis revealed that the 20-year SOP contract terms with BC Hydro were more profitable than 40-year terms. This was largely due to the removal of the EERP payment of one cent per kilowatt hour after year ten; the cost of replacing the turbines in year 21 was not recovered as quickly with a reduced power payment price. Finally, the sensitivity analysis indicated the sensitivity of the project feasibility to SOP payment price and costs. The greatest sensitivity was to the payment price. An 8% IRR is considered quite low for financing of a commercial project, but was considered reasonable for the scale of SOP projects and the purpose of the program. However, this analysis revealed that a slight increase in the payment price can make a marginal project much more realistic. For example, an increase in the payment price for Vancouver Island from $8.73/MWh to $9.713/MWh increased the IRR from 8.1% to 13.2% in a 20-year term. Therefore, an increase in the price BC Hydro is offering in the SOP would 49
59 be essential to encourage developers to consider projects that will undoubtedly have difficulty inspiring investment if the price remains the same. 50
60 Chapter 7.0 SOP Site Prospecting 7.1 Introduction The purpose of this chapter is to utilise the BC Predicted Wind Speed Map to identify prospective SOP wind project sites in the different regions using the findings of the financial analysis. The financial analysis revealed the wind speeds required to achieve internal rates of return of 0% and 8% if participating in the BC Hydro Standing Offer Program. The map was then used to locate where wind speeds are high enough to make a project economically feasible. The prospective areas are listed and illustrated in tables and figures below. 7.2 Prospecting Scope In order to conduct the prospecting, several project characteristics were assumed to keep project costs down and to narrow the scope of the exercise. To reduce construction costs, it was assumed that the project would connect to the 69 kv transmission line and therefore require only a single substation to step up the power generated by the wind farm. Connection to distribution lines was not considered because it would have been too costly and time-consuming to acquire this information for the purposes of this report. It was also assumed that the project would be located within 5 km of the 69 kv transmission line in order to reduce the costs for the electrical tap line. Increasing the distance from the grid increases transmission costs as well as electrical losses. Studies have suggested that a wind farm must be within 16 km of transmission lines, while it is ideal the proximity to be within 800 m (University of 51
61 Nebraska, 1996; Wasatch Wind, 2004). Accordingly, a 5 km buffer area representing the maximum distance to the 69 kv transmission line has been used in the figures in the following section. Finally, the four promising regions Vancouver Island, North Coast, Peace, and Eastern and Southern Interior were the areas of focus. 7.3 Prospective areas in promising regions The basis for regional prospecting of wind sites was the development of a map. Manifold GIS Software was used to overlay the 69 kv transmission lines acquired from BCTC onto the BC Wind Atlas. A 5 km buffer was generated around the transmission lines. A visual inspection was conducted to locate the wind speeds listed in Table 6.4 within the buffered area using the wind speed range legend. Initial inspection indicated that wind speeds above 8 m/s at 65 metres did not exist anywhere near to the 69 kv transmission line. This immediately excluded projects that could produce an 8% IRR under any contract duration or 0% IRR under a 40-year contract, with the exception of Vancouver Island. Only eight potential locations, two in each region were identified as prospective areas for wind projects in BC under the SOP that could produce a 0% IRR or 8% IRR. The approximate centre point of these areas, the topography of the area, and the nearest town are listed in Table
62 Table 7.1 Prospective wind project sites in BC under SOP. Region (IRR%) Coordinates Nearest Town Topography Lat Long Vancouver Island (0% and 8%) North Coast (0%) Peace Region (0%) Southern and Eastern Interior (0%) Port Hardy Coastal Forested Ridge Lake Cowichen Forested Ridge Port Essington Mountain Range Ridley Coastal Forested Ridge Telechick Fragmented Inland Forest Bonnet Hill Forested Hills Kamloops Mountain Range East Kootenay Mountain Range The prospective areas for wind development in the Vancouver Island, North Coast, Peace and Southern and Interior regions are displayed in Figures 7.1, 7.2, 7.3, and 7.4 respectively. A white circle has been used to guide the viewer to the locations on the maps. The prospective areas are appropriately located near the coast and/or on ridges or mountaintops. In reality, the steepness of the terrain will influence the selection of suitable sites, however the logistics of this were not considered in this study. 53

63 Figure 7.1 Prospecting in Vancouver Island. 54

64 Figure 7.2 Prospecting in the North Coast. 55

65 Figure 7.3 Prospecting in the Peace Region. 56

66 Figure 7.4 Prospecting in the Eastern and Southern Interior region. 57
67 Chapter 8 Sources of Error 8.1 Introduction The assumptions made and equipment utilized and referenced in this report have inevitably introduced error into the study. The potential sources of error that exist relate to the MesoMap system, monitoring equipment used in data collection, wind shear calculations, and the georeferencing process. These sources of error are briefly discussed in the following sections. 8.2 MesoMap System The MesoMap system has been validated and tested more widely than any other wind mapping system currently in use (AWST,?b). Independent testing and validation of the MesoMap system has determined mean wind speed accuracy typically in the range of 5-7%. To produce the BC map, a very large area was studied which automatically introduces potential for error each time data is manipulated. Some other sources of error include uncertainty of surface property assumptions and errors in the land cover databases (AWST,?). Therefore, there is assumed to be some inaccuracy in the resolution of the model. 58
68 8.3 Monitoring Equipment The accuracy of the calculated annual average wind speeds at monitoring stations was inevitably reduced by measurement system accuracy. The specifications for accuracy of the meteorological equipment as indicated by the manufacturer were assumed to be met during the data collection program coordinated by BC Hydro. The accuracy of each type of sensor is outlined in Table 8.1. The cumulative errors that could have existed in the monitoring systems at maximum specified inaccuracy would not have had significant impacts on the accuracy of collected data. Table 8.1 Accuracy of Monitoring Equipment used at Monitoring Stations Equipment Type Campbell Scientific (CS) CR10 datalogger Accuracy ± 0.2% of FSR (full scale range) (CS, 1992) CS CR10X datalogger ± 0.14% (CS, 2006) CS CR510 ±0.13% (CS, 2004) NRG Symphonie datalogger NRG Maximum #40 anemometer NRG #200P vane CS - RM Young WindMonitor Continued % of FS (1024 counts) (NRG, 2008a) To within 0.1 m/s for wind speed range 5 m/s to 25 m/s (NRG, 2007a) Potentiometer linearity within 1% (NRG, 2004) Wind Speed: ±0.2 m/s (or 1% of reading) Wind direction: ±3 (CS, 2007a) Summary of Accuracy (if available/required) Sum of analog input: ± 0.1% of Resistance measurements: ± 0.03% of FSR, and Period averaging measurements: ± 0.01% of reading Sum of analog input: ± 0.1% of FSR Resistance measurements: ± 0.02% of FSR, and Period averaging measurements: ± 0.01% of reading 59
69 Table 8.1 concluded. CS 107 Temperature sensor (in shield) NRG #110S temperature sensor (in shield) NRG #BP20 Barometer NRG relative humidity sensor NRG IceFree III heated Anemometer Steinhart-Hart Error: <±0.01 C (-35 to +50 C) Interchangeability error: <±0.2 C (0 to +50 C) increasing to ±0.4 C at - 40 C (CS, 2007b) Total error ± 1.1 C maximum (NRG, 2007b) ± 1.5 kpa (15 mb) max. uncorrected offset (NRG, 2008b) ± 5% RH from 5 to 95% RH (at 25 C) (NRG, 2007c) 99.7% of sensors fall within 4.3% of stated transfer function (based on over 800 samples) (NRG, 2004) Offset: ± 0.8 C maximum Nonlinearity: ± 0.33 C maximum 8.4 Collected Data Quality Data sets from all monitoring stations produced data recovery rates between 97% and 100%. Compounded with the potential for reduced accuracy from monitoring station equipment as identified in Table 8.1 above, the data quality was still considered high for this report. 8.5 Wind Shear Calculations Wind shear calculations were used to adjust the candidate data to a 65 metre hub height in order to compare values to ranges illustrated in the BC Predicted Wind Speed Map. The wind shear calculations used the following power law expression: v / v o = (h / h o ) α. The resultant mean wind speeds at hub height can be inaccurately predicted when using 60
70 such a power law; errors can be compounded in logged data by extrapolation. In this report, the potential for compounding error introduced by assuming a value for α was reduced in twelve of the fourteen monitoring stations analysed in this report because they were calculated based on collected data from sensors at two heights and not assumed. 8.6 Georeferencing Another source of imprecision could have been introduced by the georeferencing process. Georeferencing was used when the modeled map was georegistered in Manifold GIS software using known coordinates throughout the province. The exact amount of error that was introduced by this process is difficult to quantify, however a visual inspection of land features such as mountains, rivers, and island boundaries on both the BC Predicted Wind Speed Map and Google Earth demonstrated that they lined up impressively. 61
71 Chapter 9 - Discussion The analyses in this report have revealed the weakness of the BC Hydro Standing Offer Program with its current payment prices. Very few potential sites for wind power development were identified in the regions of British Columbia acknowledged as having the greatest potential. The average annual wind speeds that would be required to attain a reasonable return on investment are exceptionally high. The Ontario Power Authority initiated a very similar program called the Standard Offer Program in May, 2007 for projects up to 10 MW (OPA, 2008). In comparison to the BC SOP, projects in Ontario are paid a base rate of 11 cents per kilowatt hour with the opportunity for an additional 3.52 cents per kilowatt hour for projects that can demonstrate their reliability to deliver power during peak hours. There has been greater than expected interest in this program that has left the regulator scrambling to catch up and limiting development while transmission line upgrades are completed. The positive reception of the program reflects the developer s satisfaction with the payment price. If they are seriously interested in promoting green energy and achieving their vision for clean energy leadership, an increase in the payment price of the SOP is required. Developing wind projects not only produces power using a clean and renewable resource to contribute to a diversified energy mix; it also can benefit BC by creating jobs creation and strengthening rural economies. 62
72 9.1 Further Work The analyses conducted in this report were limited by assumptions that were made in light of the duration to complete them and by budgetary constraints namely to acquire maps and collected data. In the absence of deadlines and with greater access to resources, the following work could be performed to complete a more thorough and detailed study on the feasibility of the BC Hydro SOP: Analysis of all eight regions being offered variable base payment prices under the SOP; Acquisition and analysis of long-term meteorological data collected from more monitored sites throughout BC to compare with model; o Improve strength in verification of modeled map with collected data; Comparison of collected meteorological data with new mesoscale wind data study commissioned by BC Hydro; Analysis of other characteristics of wind in addition to wind speed specifically wind direction to assess predominant wind regimes; Completion of additional RETScreen analyses to include all regions; Assessment of a variety of wind distribution k-factors to determine effect on RETScreen feasibility analyses; Additional prospecting to assess connections of wind projects of variable distances to a variety of transmission and distribution lines; 63
73 Consultation with developers and government representatives to gain insight into impressions of the SOP and ideas for improvement; Detailed discussion on ideas for improving the SOP and the feasibility of those ideas. 64
74 Chapter 10 Conclusion and Recommendations The financial analysis revealed that the BC Hydro Standing Offer Program does not provide an adequate payment price to encourage development of small wind projects. Unless a developer can acquire turbines at a greatly reduced cost, there is currently very limited opportunity for small wind projects in the province. Vancouver Island does hold some promise being the only region with great wind speed potential and high enough payment price to produce an 8% IRR. An 8% IRR is considered relatively low from the perspective of the bank, but was considered in this report as a lower range suitable for smaller, community-based projects. Realistically, the IRR would be required to be at least 12% to be considered for project financing. Consequently, sites identified as having the potential to generate enough power to break even financially (0% IRR) could not even be considered at present unless the developer had a personal source of funding. The revelation that funding a small wind farm under the SOP is inherently prohibitive contradicts the spirit of a program that was intended to encourage construction of community-based projects. It is highly recommended that BC Hydro increase the base payment prices to at least 11 cents per kilowatt hour at the two year review period, if not sooner. The BC Predicted Wind Speed Atlas can be used by developers with confidence as a preliminary prospecting tool for identifying areas of good wind potential to initiate assessment. On its own it does not reach its full potential, but when coupled with transmission lines, as was done in this report, the developer has the ability to narrow their search to regions that are within a reasonable proximity to the grid. Developers 65
75 seriously interested in constructing a wind project in BC should conduct analyses with greater resolution maps and at least one year of data collected on-site to investigate potential areas in greater detail. 66
76 References AWS Truewind. (?). Description of the MesoMap System. [Online]. Available at: [Accessed January 10, 2008]. AWS Truewind. (?b). MesoMap Brochure. [ attachment]. British Columbia Government. (2008). Project Information Centre. [Online]. Available at: [Accessed August 12, 2008]. BC Hydro. (2008). Standing Offer Program Draft Program Rules. [Online]. Available at: [Accessed February 20, 2008]. BC Hydro. (2008b). Clean Power Call. [Online]. Available at: [Accessed May 19, 2008]. BC Hydro. (2008c). BC Hydro LTAP Resource Options Update. [Online]. Available at: [Accessed May 12, 2008]. BC Hydro British Columbia Predicted Wind Speed Map. [Online]. Available at: [Accessed 20 February 2008]. British Columbia, Ministry of Agriculture and Lands (MAL). (2008a). Integrated Land Management Bureau Applications and Reasons for Decisions. [Online]. Available at: [Accessed June 25, 2008]. British Columbia, Ministry of Agriculture and Lands (MAL). (2008b). Wind Power Projects Crown Land Tenure Program. [Online]. Available at: [Accessed June 25, 2008]. British Columbia, Ministry of Energy, Mines, and Petroleaum (MEMP). (2007). BC Energy Plan. [Online]. Available at: [Accessed June 25, 2008]. British Columbia Transmission Corporation (BCTC). (April, 2008). Wind Integration Project Transmission Planning Study - Stage 1 Study Report. System Planning and Performance Assessment; BC Transmission Corporation. British Columbia Wind Energy Association (BCWEA) (2005). BC Communities Can Reap Millions in Investmentsfrom Wind Energy. [Online]. Available at: [Accessed March 13, 2008]. 67
77 CDA International Ltd.. (2008). Manifold System. [Online]. Available at: [Accessed August 5, 2008]. Campbell Scientific (CS). (1992). Eppley PSP Instruction Manual. [Online]. Available at: [Accessed November 14, 2008]. Campbell Scientific (CS). (2004). CR510 Specifications. [Online]. Available at: [Accessed November 14, 2008]. Campbell Scientific (CS). (2006). CR10X Measurement and Control System. [Online]. Available at: [Accessed November 14, 2008]. Campbell Scientific (CS). (2007a). Wind Speed and Direction Sensors: Wind Monitor, Wind Monitor-MA,05305 Wind Monitor-AQ. [Online]. Available at: [Accessed November 14, 2008]. Campbell Scientific (CS). (2007b). Temperature Probes: Models 107 and 108.[Online] Available at: [Accessed November 14, 2008]. Canadian Wind Energy Association (CANWEA). (2008). Canada s Current Installed Capacity. [Online]. Available at: [Accessed July 21, 2008]. Deveau, S (2004). Green Power Experts Give B.C. Low Marks. [Online]. The Tyee. Available at: [Accessed March 13, 2008]. Garrad Hassan (GH) Canada Inc. (February, 2008). Assessment of the Energy Potential and Estimated Costs of Wind Energy in British Columbia. NRCan (2005). RETScreen International Ver [Online]. Available at: [Accessed January 5, 2005]. NRG. (2003). NRG IceFree3 Anemometer User Manual. [Online]. Available at: -FG2440manual.pdf [Accessed November 14, 2008]. NRG. (2004). Specifications NRG #200P Wind Direction Vane. [Online]. Available at: pecs.pdf [Accessed November 14, 2008]. 68
78 NRG. (2007a). Specifications NRG #40C Anemometer. [Online]. Available at: specs.pdf [Accessed November 14, 2008]. NRG. (2007b). Specifications NRG #110S Temperature Sensor. [Online]. Available at: pecs.pdf [Accessed November 14, 2008]. NRG. (2007c). Sepcifications Relative Humidity Sensor. [Online]. Available at: pecs.pdf [Accessed November 14, 2008]. NRG. (2008a). User s Manual: Symphonie Data Logger and Accessories. [Online]. Available at: honieman_rev_5.06.pdf [Accessed November 14, 2008]. NRG. (2008b). Specifications BP20 Barometric Pressure Sensor. [Online]. Available at: spec.pdf [Accessed November 14, 2008]. Ontario Power Authority (OPA). (2008). Ontario s Standard Offer Program. [Online]. Available at: [Accessed September 10, 2008]. University of Nebraska (1996). An Introduction to Wind Power for Nebraskans.[Online]. Available at: [Accessed August 12, 2008]. Wasatch Wind. (2004). Land Owners. [Online]. Available at: [Accessed August 12, 2008]. 69
79 APPENDIX A British Columbia Predicted Wind Speed Map
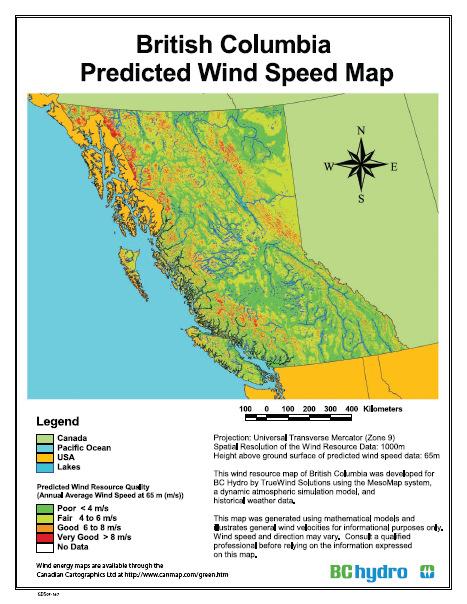
80