ewater s Mission: Build a new integrated modelling capability for Australia Dr Robert Carr, 30 May 2012
|
|
|
- Audra Holt
- 5 years ago
- Views:
Transcription
1 ewater s Mission: Build a new integrated modelling capability for Australia Dr Robert Carr, 30 May 2012
2 Why a new modelling capability? Higher expectations for Integrated Water Resources Management Policy and Governance Greater focus on water use efficiency (eg. tradable rights, growing cities and virtual transfers, environmental water) Need to address Ecological outcomes and Climate uncertainty Nationally consistent framework, integrating: Balance of human and environmental needs Conjunctive surface and groundwater use Rural and urban supply Water use and reuse Both planning and operational requirements Trading of Entitlements and Allocations
3 Source - high level capability Catchment to Estuary simulation capability Runoff and constituent generation in upland areas Transport through regulated and unregulated systems Representation of urban and rural areas, including newer urban infrastructure options Link to ecological function including environmental watering demands and ecological response models Adapt to new knowledge to last ~20 years Combining the various strands of ewater and partner product development to enable whole system analysis


4 Built upon TIME a library of modelling tools A software framework for developing eco-hydrological models based upon the Microsoft.NET framework. Designed to support the creation, testing and end-user delivery of environmental simulation models. Supports the management, manipulation and presentation of a variety of data types, as well as support for testing, integrating and calibrating simulation models. Underpins a range of spatial and temporal modelling systems including the toolkit models (

5 Flexible Structure Alternate runoff conceptualisations 8 models + observed runoff + user defined plugins

6 Flexible Structure Nodes representing management functions, key structures, points of interest

7 Flexible Structure Alternate transport representations for flow, water quality constituents and ownership link routing models
8 Flexible Structure Catchment export methods to suit data availability f(q,c, ) Catchment Export Methods

9 Flexible Structure Export filters to represent land management actions (7 filter models)
10 Flexible Structure Decay of constituents instream or within reservoirs 3 models
11 Flexible Structure Represent demand as a time series, a recurring pattern or a model
12 Options for Customising Source 1. Expression Editor Powerful math and logic language built into Source (MS Excel-style formulae) 2. Custom Functions User defined extensions to the Expression Editor 3. Plugins Open ended system for changing the algorithms, user interface or operation of Source 4. External Scripting Batch runs, optimisation, links to other systems
13 Expression Editor Ability to calculate mathematical expressions within Source using system variables Has the same syntax as Excel Large set of common used functions (trigonomic, statistical, logical) Piecewise Linear, Patterns and Time of Evaluation Custom Functions Extend the language of the expression editor Reuse common logic Written in C# and loaded as a plugin
14 Expression Editor
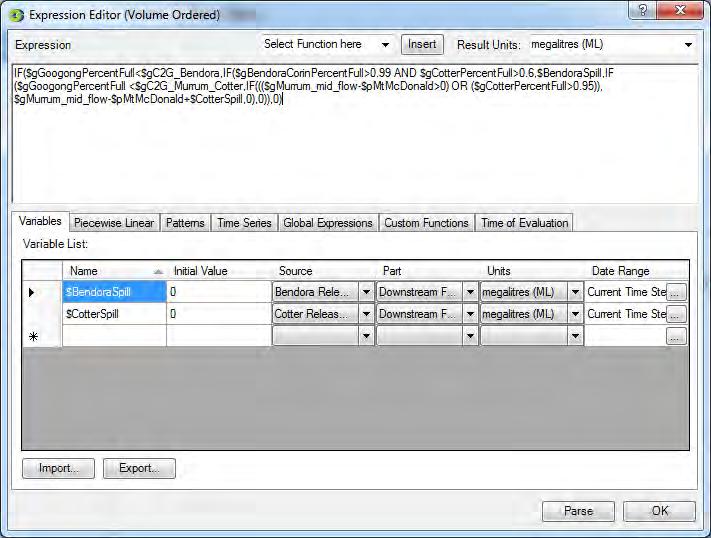
15 Expression Editor

16 External Scripting and Multi-Core Capability Run Source from the command line, from an OpenMI compliant system or over the network Manipulate model using user defined and named variables Run simulations in parallel Link to other models, run with optimisers, link to corporate systems Run entire simulation records or step by step to handle feedback

17 Linking Source with other models Detail only where needed or data supports fine scale analysis Operational Models Data Cube for Real-time Model Plugins Target Areas of Risk Open Source Proprietary Models Value Added Analysis Vulnerability and Loss


18 Common Model Platform with three modes Managers Planners Operators Decision Support System
19 Benefits of ewater Modelling Approach Existing Science and Models are recognised and preserved existing stakeholders engaged in new community of practice Open Framework public good/integrity ensured Geographical and Process Gaps can be filled using standard tools while new Research is undertaken. Model-Generated Uncertainty can be evaluated Water Management Policy can be expressed and impacts understood Supports integrated planning and operations
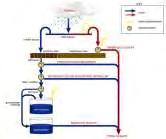
20 Source for rivers

21 Functionality Built in demand models: Environmental demand Crop/agriculture demand Time series demand Fixed patterns Additional demand models: User defined equations User defined models External models Built in water resource assessment and allocation systems: Simple accounting Annual accounting Continuous accounting Continuous sharing

22 Functionality cont. Different inflow choices: Time series Other model User-defined model or equation Hydrologic flow routing: Various options Provides attenuation and travel time Travel time considered in both order and flow phases Fixed patterns Other features: Ownership Constituents Wetlands Groundwater interaction
 Water sharing and planning River operations including flood and drought Conjunctive use (groundwater and surface water resource) Risk assessment (Climate change and")
23 Types of applications Unregulated systems: Yield analysis Impacts of land use change Water quality Flood and drought analysis Regulated systems (urban and rural): Reliability of supply Trade-offs (irrigation/urban/environment) Water sharing and planning River operations including flood and drought Conjunctive use (groundwater and surface water resource) Risk assessment (Climate change and variability) Water quality Forecasting water resources and water accounting
24 Groundwater/Surface Water Interaction

25 Impacts of groundwater pumping on rivers From: Evans R. (2007). The impact of groundwater use on Australia s rivers ~ Exploring the technical, management and policy challenges. Land and Water Australia, Canberra.
26 SW/GW exchange flux (ML/day) GWSWIT Link Model versus MODFLOW Date 24/8/92 12/3/93 28/9/93 16/4/94 2/11/94 21/5/95 7/12/ Modflow Link model ve = Gaining, -ve = Losing
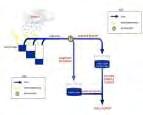
27 Source for Urban Systems
28 Source Urban When applied in a regional urban context, replicates cities trunk supplysystems and will dynamically distribute water through the operational rules or the use of network linear programming (NETLP).
29 Source Urban Functionality Urban Water User Demand Centralised Sources of Water Decentralised Sources of Water (up-scaling Issues) Wastewater Recycling Centralised Stormwater Harvesting Desalination Plants Rainwater Tanks Restriction and Trigger Curves

30 MUSIC music (Model for Urban Stormwater Improvement Conceptualisation) is designed to help urban stormwater professionals visualise and compare possible strategies to tackle urban stormwater hydrology and pollution impacts. Key features: Pollutant modelling Water balance Stormwater harvesting Stormwater reuse Life cycle costing Treatment devices: Bioretention Media filtration Infiltration Wetland Gross Pollutant Trap Swale Pond


31 Urban Developer Lot to Suburban Scale Water Efficiency Planning Tool explore water sensitive urban design strategies for new or retrofit urban developments; represent all three urban water cycle service networks potable, waste and stormwater; deal with probabilistic demands and end-use simulation; perform continuous simulation and simulation of multiple replicates at once; integrate systems at a range of scales; simulate individual end-uses at the household scale at sub-daily time steps, for multiple households; explore recycling and re-use loops;


32 Basin Scale Integrated Planning and Operation Ecology Groundwater Cities & Towns Irrigation Local Use & Reuse Analysis
33 MUSIC Optimisation Insight Show tradeoff between pond configuration and reuse demand for a given reduction target Pond Location and Distribution Objective function = reduction target at outlet Pond Sizes as decision variables Generate Cost of options Site-Specific Configuration Ponds at nominal sizes in all potential locations Local Climate Inputs
34 Hydrological analysis of ecological water needs
35 What are the main drivers of River Health & Ecological Condition? 1. Biota Biodiversity, endangered species, pests 2. Water Quality Nutrients, toxicants, temperature 3. Habitat Physical, hydraulic 4. Flow regime Ecologically important hydrology
36 Three step process 1. How does ecology respond to flow? (Eco Modeller) Flow Ecology 2. What changes in flow regime is required? (eflow Predictor) 3. Set eco-demand in hydrological model (Source) Flow &Ecology
37 Commence to fill trigger Volume of additional flow Flow days
38 Flood / Fresh Rule What time of year is important? How often should it occur? Continuous flood, add up short floods or specify a number of floods How long should it last? Flow threshold? natural drought? If multiple small spells, is there a minimum duration? If multiple spells should there be a gap between them? Are there maximum rates of rise and fall restrictions? Days Rate (ML/D) Percentage daily percentage change
39 LAND USE CLIMATE Demand ECOLOGICAL ASSETS DAMS & WEIRS CITIES Demand IRRIGATION Demand
40 Insight Analysing Tradeoffs 1. Multi Objective Optimisation of scenarios 1. There is no one right answer 2. Pareto Optimality 2. Visualize tradeoffs between criteria 3. Decision Variables defined by User 3. Discard inferior solutions objectively
41 Visualising Tradeoffs Pareto Optimal Front
42 Balancing Flood Risk and Water Security in South-East Queensland
43 South-East Queensland Water Management Several Different Organizations involved: Bureau of Meteorology Australia's national weather, climate and water agency. SEQWater is the bulk water supply provider and manages catchments, water storages, and treatment services. Queensland Water Commission responsible for sustainable water supplies. SEQ Grid Manager Operations and Sales of Water. Brisbane City Council Flood Warnings. Department of Environment and Resource Management - conserves, protects and manages Queensland s environment and natural resources
44 Need to Generate Consensus and Agreement Management model represents major policy elements Management of Flood Storage Climate forecast impacts Flood Damage Impacts Water Demand and Security alternative supplies Impact of release strategies Use information from all stakeholders Demonstrate Tradeoffs between multiple alternatives
45 Management/Policy Level Model Storage Flood Release Water Supply Flood Damage
46 40 Year Simulation incl 1974 Flood Event 6000 Wivenhoe Inflow (m3/s) Inflow (m3/s)

47 User-Defined Objectives and Decision Variables
48 Results of Tradeoff Analysis Minimum Storage % over Simulation Period Flood Damage vs Minimum Storage Pct 60% Trigger 40% PRW Trigger Brisbane Flood Damage $Millions Unable to Significantly Reduce Flood Damage without Security Impacts Non-Dominated Solution
49 A Conversation about Water with a Common Point of Truth Owners Environment Urban Irrigation Climate and Resources Floods & Droughts Surface Water Environmental Assets Ground water Climate Change Land Use and Agriculture Planning, Analysis & Operations Social Impacts Economics Operational Constraints Environmental Impacts Outcomes Policy Implementation Compliance

50