V I L L A G E O F S O U T H R U S S E L L
|
|
|
- Sherman Morton
- 5 years ago
- Views:
Transcription


1 V I L L A G E O F S O U T H R U S S E L L
2
3
4
5 T ABLE OF C ONTENTS 1. Executive Summary Background PART I: 2016 Pavement Condition PART II: 2018 Current Backlog PART III: Maintenance & Rehabilitation (M&R) Program PART IV: Comparative Analysis Appendix M APS 1: Village of South Russell Location in the NOACA Region : 2016 Village of South Russell Pavement Condition F IGURES 1: 2016 South Russell Pavement Network Condition Chart by Lane-Miles : The PCR Acceptable Level and Need Year Relation : Average PCR Comparison by the Constraint Scenarios and by Year T ABLES 1: Selected Pavement Treatments and Their Planning Level Costs : 2016 South Russell Pavement Network Condition : 2016 Village of South Russell Pavement Condition Listing : Performance Comparison of the Constraint Scenarios A PPENDIX The 2018 Current Backlog Pavement Treatment List The Maintain 15% Deficiency Pavement Treatment List The Maintain an Average Network PCR of 80 Pavement Treatment List The M&R Pavement Treatment List The Maintain Lowest Standard PCR Pavement Treatment List P age
6 E XECUTIVE S UMMARY The 2016 Ohio Department of Transportation (ODOT) pavement database has 3,626 segment records for the Northeast Ohio Areawide Coordinating Agency (NOACA) region. The NOACA region has a total of 3,330 centerline miles of roadways including freeways and federal-aid highways which is equivalent to 8,561 lane-miles. The regional segment average Pavement Condition Ratings (PCR) is about 77. In the Village of South Russell there are 4.65 centerline miles of federal-aid roads, which are equivalent to 9.30 lane-miles within the village boundary that include State Route 306 (SR 306). The 2016 ODOT pavement database has four segment records for the Village of South Russell roadway system. Each record comprises of several fields of various information and measures such as Street name, Length (miles), Lane-miles length, Number of Lanes, Function Class, Pavement Condition Ratings (PCR), etc. According to the PCR measure, about 56 percent of pavement the lane-miles are currently in the Good to Very Good condition. The rest of the lane-miles are in the Fair status and demand some kind of preventive maintenance treatments. This pavement study includes four parts: Part I: The 2016 pavement network condition, Part II: The 2018 backlog, Part III: The Maintenance and Rehabilitation (M&R) program, Part IV: The Comparative analysis. Considering the five-year study period of , this pavement study focuses on the required preventive maintenance treatments and some rehabilitation techniques rather than reconstruction. Part I of this study analyzes the 2016 pavement network condition and tabulates the important information of all the four road segments in the Village of South Russell. In Part II, the backlog is defined as the cost of pavement rehabilitation of all roads within one year (2018) and bringing the average network PCR to 80. Backlog is a snapshot or relative measure of outstanding rehabilitation work. Part III introduces the optimal preventive maintenance and rehabilitation strategy for each segment and its recommended implementation year based on the NOACA maintenance decision tree. Finally, Part IV compares the backlog and the M&R program with the NOACA transportation asset management strategies. All these strategies were compared regarding their costs, the average network PCR and percent of the lane-miles below the acceptable level. 2 P age
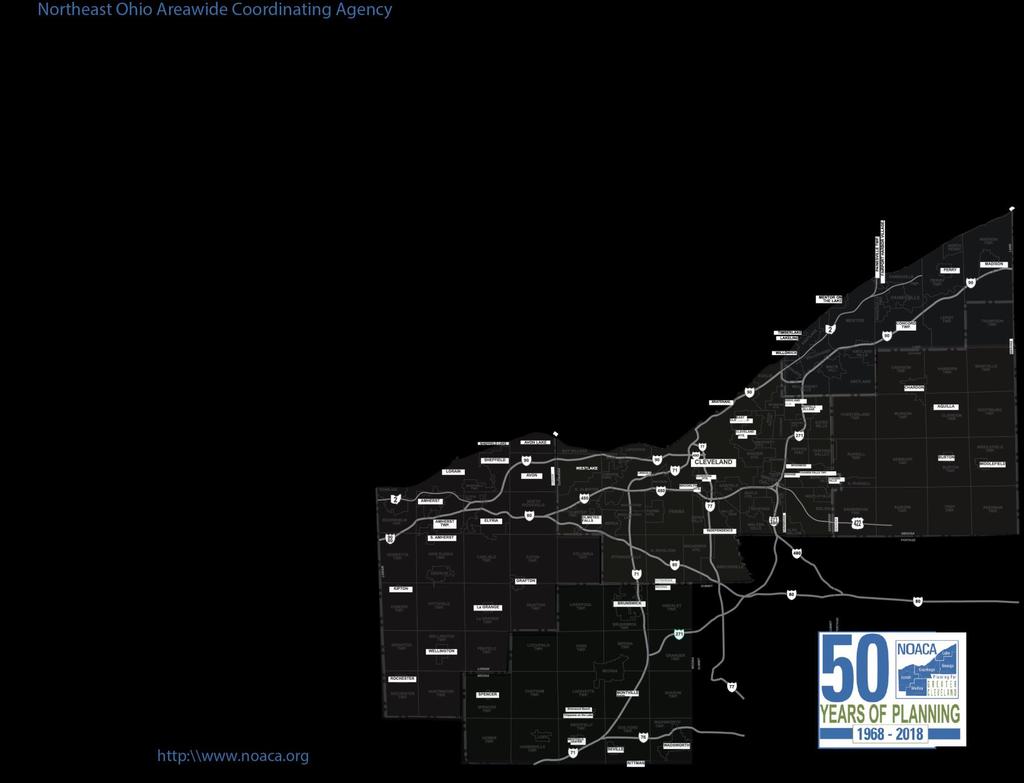
7 B ACKGROUND Disputes over education created South Russell Village. Residents in the southern part of Russell Township had wanted one large school building to replace many one-room schools. They petitioned the Russell Board of Education and were turned down. In 1923 these residents seceded and formed South Russell Village. They also petitioned to be accepted into the Chagrin Falls school system and students began attending Chagrin Schools in Russell Township was settled in 1818 by settlers from New England and was called the West Woods. Farming, cheese making, and service industries, including-grist mills, saw mills, and a blacksmith shop were local businesses. The Village of South Russell was incorporated in 1923, and as of 2015, it was the last village in Geauga County to have done so. As of the Northeast Ohio Areawide Coordinating Agency (NOACA) 2015 estimates, the village had a population of 3,800 and employment of 1,280. The Village of South Russell includes State Route 306 (SR 306). Cleveland-Hopkins International Airport is the nearest airport. Map 1 illustrates the Village of South Russell location in the NOACA region. 3 P age B ACKGROUND


8 Map 1: Village of South Russell Location in the NOACA Region 4 P age B ACKGROUND
9 For the purpose of this study: Pavement Reconstruction is defined as the replacement or reestablishment of the original pavement structural capacity by the placement of the equivalent or increased pavement structure. Reconstruction may utilize either new or recycle materials for the reconstruction of the complete pavement structure. Pavement Rehabilitation is defined as resurfacing, restoration, and rehabilitation (3R) work consisting of structural enhancements that extend the service life of an existing pavement and/or improve its structural capacity. Rehabilitation techniques include restoration treatments and/or structural overlays. This may include partial recycling of the existing pavement, placement of additional surface materials, and/or other work necessary to return an existing pavement to a condition of structural or functional adequacy. Preventive Maintenance is considered as cost effective treatments to an existing roadway system and its appurtenances that preserves the system, delays future deterioration, and maintains or improves the functionality condition of the system without increasing structural capacity. Projects that address deficiencies in the pavement structure or increase the structural capacity of the facility are not considered preventive maintenance. Maintaining the roadways in a state of good repair is essential and experience has shown that, over time it is less expensive to invest in preventive maintenance and/or rehabilitation in an ongoing basis rather than in reconstruction of pavement that has deteriorated to a poor condition. This pavement study analyzes the current status of the South Russell pavement network condition and considers the five-year study period of It mainly focuses on the required roadway pavement preventive maintenance treatments and some rehabilitation techniques rather than reconstruction. The 2016 Ohio Department of Transportation (ODOT) pavement database was used as the input data and RoadMatrix software was utilized as the NOACA Pavement Management platform. Seven roadway pavement preventive maintenance and rehabilitation treatments were considered in the South Russell pavement network analysis for the study period and Table 1 illustrates the selected treatment and their associated planning level costs. 5 P age B ACKGROUND
10 Table 1: Selected Pavement Treatments and Their Planning Level Costs Maintenance Treatment Type Cost per SQ FT (2016$) Estimated Cost per 12- FT lane-mile (2016$) Crack Fill ,100 Joint Repair ,200 Crack Fill and Slurry ,300 Preventive Maintenance Minor ,700 Micro Pave Type Surface Treatment ,700 Selective Patch, Mill and 1.5 O/L , inch Hot Mix Mill and Overlay ,400 Pavement Maintenance Treatment Definitions Crack Fill: it is the placement of asphalt emulsion into non-working cracks to reduce water infiltration and to reinforce the adjacent pavement. Slurry Seal: a mixture of fine aggregate, asphalt emulsion, water, and mineral filler, used when the primary problem is excessive oxidation and hardening of the existing surface. Slurry seals are used to retard surface raveling, and improve surface friction. Joint Repair: used to remove deteriorated concrete pavement long joint/crack repairs. It minimizes infiltration of surface water and incompressible material into the joint system. 6 P age B ACKGROUND
11 Preventive Maintenance (Minor): typically applied to pavements in good condition having significant remaining service life. Examples of minor preventive treatments include asphalt crack sealing, chip sealing, slurry or micro-surfacing, thin and ultra-thin hot-mix asphalt overlay, and concrete joint sealing. Micro Pave (Type II Surface Treatment): consist of the application of a mixture of water, asphalt emulsion, aggregate (very small crushed rock), and chemical additives. It is used to treat surfacing and rut filling on roads that get moderate to heavy levels of traffic. 2.0in Hot Mix Mill & Overlay: applied as a maintenance treatment. Thin overlays should only be placed on structurally sound pavements. That is because they offer little structural improvement, but they can renew the surface in terms of functional performance (i.e., ride quality). Selective Patching, Mill & 1.5 O/L: it is primarily done to extend the life of a roadway. Patch mill and overlay projects are designed to remove damaged portions of the roadway and replace it with new smooth pavement. This report includes the following four parts: I. The 2016 status of the South Russell pavement network condition, II. III. IV. The 2018 backlog treatment list, The optimal preventive maintenance and rehabilitation strategies, and The comparative analysis. 7 P age B ACKGROUND
12 PART I : 2016 P AVEMENT C ONDITION In order to provide an accurate assessment of the current status and further pavement analyses, the pavement network is required to be divided into homogeneous discrete sections in terms of surface distress, traffic volumes, pavement structure, etc. The 2016 ODOT pavement database has four segment records for the Village of South Russell roadway system. Each record comprises of several fields of various information and measures such as Street name, Length (miles), Lane-miles length, Number of Lanes, Function Class, Pavement Condition Ratings (PCR), etc. Based on the utilized ODOT database, there are 4.65 centerline miles of federal-aid eligible roads which are equivalent to 9.30 lane-miles in the Village of South Russell. The total area of roadway is 865,815 Sq. Ft. The PCR measure is a qualitative description of the structural state of the pavement. The PCR values span a spectrum of descriptive narrative ranging from Very Good to Very Poor. Each roadway segment is scored from 0 to 100 with 0 representing completely distressed pavement and 100 indicating perfect pavement condition. The lane-mile weighted average of the Village of South Russell segment PCRs is about 80. Table 2 and Figure 1 summarize the 2016 South Russell pavement network conditions by percentages of roadway lane-miles length. Table 2: 2016 South Russell Pavement Network Condition Pavement Condition PCR Range Lane-Miles Percent of Lane-Miles Very Poor % Poor % Fair to Poor % Fair % Good % Very Good % 8 P age P A RT I

13 Figure 1: 2016 South Russell Pavement Network Condition Chart by Lane-Miles 4.02 miles 43.2% 1.14 miles 12.3% 4.14 miles 44.5% Very Poor, 0-39 Poor, Fair to Poor, Fair, Good, Very Good, As indicated, about 56 percent of the pavement lane-miles are currently in the Good to Very Good condition and the lane-mile weighted average PCR also represents a Good condition. The rest of the lane-miles are in the Fair status and demand some kind of preventive maintenance treatments. Map 2 illustrates the 2016 South Russell roadway pavement condition for each segment record and Table 3 tabulates the 2016 South Russell pavement condition listing. 9 P age P A RT I


14 Map 2: 2016 Village of South Russell Pavement Condition 10 P age P A RT I
15 Table 3: 2016 Village of South Russell Pavement Condition Listing ROAD NAME FROM TO FUNCTION CLASS BELL RD SR 306 BELL RD WASHINGTON ST HEMLOCK RD GEAUGA/CUYAHOGA COUNTY LINE DAISY LANE CUYAHOGA/GEAUGA COUNTY LINE SOUTH RUSSELL ECL LANE- MILES PCR MAJOR COLLECTOR SR 306 MAJOR COLLECTOR CUYAHOGA/GEAUGA COUNTY LINE MINOR ARTERIAL HAZELWOOD DRIVE MAJOR COLLECTOR P age P A RT I
16 P ART II: 2018 C URRENT B ACKLOG The backlog is defined as the cost of pavement rehabilitation of all roads within the current year (2018) and bringing the average network PCR to 80. Backlog is a snapshot or relative measure of outstanding rehabilitation work. The backlog not only represents how far behind the pavement network is in terms of its present physical condition, but also its cost value serves as a benchmark to measure the impact of various funding strategies. Additionally, the current backlog offers a basis for comparison to future and/or past year s backlogs. The backlog strategy does not utilize any pavement preventive maintenance treatments, but instead considers rehabilitation or reconstruction treatments. This strategy achieves the average network PCR 80, and also maintains all the pavement conditions above the minimum acceptable level. In this study, the minimum acceptable PCR for the arterial roadway function class is 55 and for the major and minor collector is 50. The Appendix includes all the backlog pavement treatments. As illustrated, the 2018 backlog treatment list includes segments which their 2018 PCRs are below the minimum acceptable level and are recommended with various reconstruction treatments. There is one segment in the 2018 backlog list with the total of 4.14 lane-miles. The 2018 backlog cost of the recommended treatments is approximately 800 thousand dollars. 12 P age P A RT II
17 P ART III: M AINTENANCE & R EHABILITATION (M&R) P ROGRAM In order to estimate the preventive maintenance and rehabilitation requirements of a pavement network over a period of time, the first step is to determine the Need Year or when a pavement segment requires rehabilitation. The Need Year of a pavement is defined as the year in which the pavement condition falls below a critical level. Pavement condition of a road segment deteriorates under traffic, climate, etc. and consequently its PCR value is reduced. Without any treatments and depending on the deteriorating factors, pavements perform differently and Figure 2 depicts the typical acceptable level and Need Year relation for several road segments. As shown, the definition of the acceptable level is a critical factor in determining the Need Year for any road segment. In this study, the critical level is set by the minimum acceptable PCR. As mentioned earlier, In the NOACA region, the minimum acceptable PCR for the arterial roadway function class is 55 and for the major and minor collector is 50. Figure 2: The PCR Acceptable Level and Need Year Relation Pavement Performance Curves PCR Index Acceptable Level Need Year 2018 Analysis Periods P age P A RT III
18 The second step is to determine any feasible preventive maintenance and/or rehabilitation strategies based on a decision tree approach. The M&R program determines the optimal preventive maintenance and rehabilitation strategy for each segment and its recommended implementation year based on the considered decision tree. The Appendix includes all the M&R treatments for the identified segments with the implementation year in the period of 2018 to 2022 and the M&R program cost includes all the deferred maintenance cost. 14 P age P A RT III
19 PART IV: C OMPARATIVE A NALYSIS The current NOACA transportation asset management policy includes two strategies Maintain 15% Deficiency: this strategy attempts to maintain the total lane-miles with PCR below the acceptable level no more than 15%. Maintain an Average Network PCR of 80: applies a set of maintenance treatments in order to keep the roadway network average PCR more than, or equal to 80 over the study period. This section compares the discussed backlog and the M&R program treatments with the NOACA transportation asset management strategies. In addition to the above strategies, this comparative analysis considers another scenario as the minimum benchmark. The Maintain Lowest Standard PCR treatment strategy is based on the minimum PCR thresholds of 55 for arterials and 50 for collectors and a set of annual budget constraints. The annual budget constraints are calculated in three steps: First, the segments with the M&R recommended implementation in each specific analysis year are selected. Second, a subset of the selected segments which their Need Years are in the analysis period are identified. It should be noted that the selected segments with the Need Year beyond the analysis period are excluded from the budget constraint calculation. Third, the M&R treatment costs for the identified segments in the second step, are added together to provide an annual budget constraint for this scenario. As discussed, all the above scenarios apply a decision tree approach to determine technically feasible maintenance and rehabilitation strategies for each segment requiring rehabilitation during the five-year period. Table 4 summarizes the comparison results of all the above scenarios over the five-year period for the Village of South Russell. In this table, the 5-Year Total Required Dollars column shows the accumulation of the annual costs over five years calculated based on inflation-adjusted dollars for each strategy. Also, the Network average PCR is the lane-mile weighted average. 15 P age P A RT IV
20 Table 4: Performance Comparison of the Constraint Scenarios Maintenance Strategy Strategy Group 5-Year Total Required Dollars Network Average PCR Network PCR at the End of the 5-Year Period Percent of Pavement below the Minimum PCR 2018 Current Backlog Maintain 15% Deficiency Maintain an Average Network PCR of Backlog 785, % NOACA Transportation Asset Management Targets % 223, % M&R Program Maintain Lowest Standard PCR Scenarios 223, % % Note: The backlog required budget is for the year of 2018 only. The Appendix lists all the treatments with their implementation years in the period of 2018 to 2022 for the above maintenance strategies. Figure 3 illustrates the annual network average PCR for the discussed maintenance and rehabilitation strategies. It should be noted that the backlog scenario has only one value of 92.9 for P age P A RT IV
21 Figure 3: Average PCR Comparison by the Constraint Scenarios and by Year Average PCR % Deficiency PCR = 80 M&R Lowest Standard PCR Do Nothing Year 17 P age P A RT IV
22 Currently, there are three segments with a total of over five lane-miles in the Very Good and Good conditions. On the contrary, there is one segment with a length of over four miles in the Fair condition. Due to this dichotomy, the M&R program and the Maintain an Average PCR of 80 scenario require an accumulated budget of less than a quarter million dollars and result in a network average PCR of 70 at the end of the analysis period. On the other hand, the Maintain 15% Deficiency and the Maintain Lowest Standard PCR scenarios do not recommend any treatments and their network average PCRs are just a few points less than that of the M&R program. As a result of the current good pavement condition, there will not be any pavements below the minimum acceptable PCR in any scenarios at the end of the five-year period. It should be noted that the backlog cost as the benchmark is over three times more than the M&R program budget and although its 2018 network average PCR is higher than that of the M&R program, it does not include any maintenance treatments. This will result in the average PCR decreasing to lower than any of the discussed maintenance scenarios at the end of the analysis period. In order to maintain the current good pavement condition, it is recommended to invest on the annual pavement maintenance program with much smaller budget than the reconstruction treatments with high costs. 18 P age P A RT IV
23 A PPENDIX 2018 Current Backlog Pavement Treatment List ROAD NAME FROM TO RECOMMENDATION TREATMENT BELL RD SR 306 (CHILLICOTHE RD) SOUTH RUSSELL ECL LANE- MILES TREATMENT COST 2.0IN. HOT MIX MILL & OVERLAY ,125 REQUIRED BACKLOG BUDGET (2018$) $785, P age A PPENDIX
24 Maintain 15% Deficiency As indicated in Table 4, the Maintain 15% Deficiency cost is zero and therefore, this strategy does not recommend any pavement maintenance treatments. 20 P age A PPENDIX
25 Maintain an Average Network PCR of 80 Pavement Treatment List ROAD NAME FROM TO RECOMMENDED TREATMENT WASHINGTON ST DAISY LANE CUYAHOGA/GEAUG A COUNTY LINE/ RIDGEWOOD DR PREVENTATIVE MAINTENANCE MINOR LANE- MILES IMPLEMENTATION COST (2019$) YEAR , THE 2019 REQUIRED BUDGET FOR THE MAINTAIN AN AVERAGE NETWORK PCR OF 80 STRATEGY $35,630 ROAD NAME FROM TO RECOMMENDED TREATMENT HEMLOCK RD CUYAHOGA/GEAUGA COUNTY LINE/HICKORY HILL LN LANE- MILES IMPLEMENTATION COST (2020$) YEAR HAZELWOOD DRIVE CRACK FILL & SLURRY , THE 2020 REQUIRED BUDGET FOR THE MAINTAIN AN AVERAGE NETWORK PCR OF 80 STRATEGY $10,622 ROAD NAME FROM TO RECOMMENDED TREATMENT BELL RD GEAUGA / CUYAHOGA COUNTY LINE SR 306 (CHILLICOTHE RD) LANE- MILES IMPLEMENTATION COST (2022$) YEAR CRACK FILL & SLURRY , THE 2022 REQUIRED BUDGET FOR THE MAINTAIN AN AVERAGE NETWORK PCR OF 80 STRATEGY $177,022 Note: The Maintain an Average Network PCR of 80 strategy does not have any pavement maintenance treatments with the recommended implementation years of 2018 and P age A PPENDIX
26 M&R Program Pavement Treatment List ROAD NAME FROM TO RECOMMENDED TREATMENT WASHINGTON ST DAISY LANE CUYAHOGA/GEAUG A COUNTY LINE/ RIDGEWOOD DR PREVENTATIVE MAINTENANCE MINOR LANE- MILES IMPLEMENTATION COST (2019$) YEAR , THE 2019 REQUIRED BUDGET FOR THE M&R PROGRAM $35,630 ROAD NAME FROM TO RECOMMENDED TREATMENT HEMLOCK RD CUYAHOGA/GEAUGA COUNTY LINE/HICKORY HILL LN LANE- MILES IMPLEMENTATION COST (2020$) YEAR HAZELWOOD DRIVE CRACK FILL & SLURRY , THE 2020 REQUIRED BUDGET FOR THE M&R PROGRAM $10,622 ROAD NAME FROM TO RECOMMENDED TREATMENT BELL RD GEAUGA / CUYAHOGA COUNTY LINE SR 306 (CHILLICOTHE RD) LANE- MILES IMPLEMENTATION COST (2022$) YEAR CRACK FILL & SLURRY , THE 2022 REQUIRED BUDGET FOR THE M&R PROGRAM $177,022 Note: The M&R Pavement Treatment program does not have any pavement maintenance treatments with the recommended implementation years of 2018 and P age A PPENDIX
27 Maintain Lowest Standard PCR As indicated in Table 4, the Maintain Lowest Standard PCR cost is zero and therefore, this strategy does not recommend any pavement maintenance treatments. 23 P age A PPENDIX
28 This page has been intentionally left blank.
29
30