CALPUFF PT-Source Modeling
|
|
|
- Paul West
- 5 years ago
- Views:
Transcription
1 CALPUFF PT-Source Modeling VT-MD-NESCAUM / MANE-VU RPO Study Status of VT Modeling effort Paul Wishinski & Dan Riley VTAPCD MANE-VU TSC Meeting Washington, DC September 30, 2004
2 Purposes of this Modeling Study (a joint effort involving VT APCD, MD DEP, and NESCAUM) 1. Further the application of CALPUFF as a modeling tool for regional impact assessments through testing of model on large domain inclusive of most major point sources of SO2 and NOx. (with emphasis on large EGU sulfur emissions impacts) 2. Develop a modeling platform for use in preliminary evaluation of individual BART Eligible sources in the northeastern U.S. : re contributions to regional haze for the MANE-VU RPO. 3. Create a modeling platform that might be used to prioritize strategy modeling runs to be done later using CMAQ / REMSAD.
3 CALPUFF MODEL SETUP CALPUFF_v5.711_ BETA version DOMAIN compatible with standard RPO Projection. (This BETA version dated June 25, 2003 was found to be necessary if input of hourly variable CEMS emission rates, contained in a PTEMARB.dat file, are being used. ) Params.dat file was edited to accommodate a large number of sources, a large number of ozone and surface met stations and a large number of precipitation stations. parameter(mxpuff= ) MAX PUFFS on Grid parameter(mxnx=250,mxny=250,mxnz=12) METEOROLOGY XYZ Grid max# parameter(mxnxg=250,mxnyg=250) COMPUTATIONAL XY Grid max# parameter(mxrec=10000) MAX Discrete Receptors parameter(mxss=980,mxus=99,mxps=1500) MAX Surf/Rawind/Precip Stations parameter(mxpt1=3500,mxpt2=3500) MAX Pt(const) Pt(variable) Srcs parameter(mxarea=10000) MAX Area Srcs parameter(mxoz=600) MAX Ozone Monitors
4 Vermont CALPUFF Modeling Study REGIONAL DOMAIN 70 x 64 grid at 36 km allows inclusion of source regions affecting all Class I areas in the northeast portion of DOMAIN SW corner of grid: 33.5 North Latitude & 98.2 West Longitude Grid projection is Lambert Conformal. Domain is consistent with RPO projection specifications. MEASURED METEOROLOGY UTILIZED FOR REGIONAL DOMAIN 2002 has been processed utilizing NWS data sets meteorological inputs consist of 700 surface stations : 30 radiosonde stations : 1100 precipitation sites Upper Air Radiosonde Data When possible, existing soundings with missing data were filled to allow their use Surface Weather Data - The Integrated Surface Hourly Observations (ISHO) Dataset from NCDC was utilized. No Canadian Data Available. Precipitation Data - Data from the NCDC CD: US Hourly Precipitation Data (TD3240 format), was utilized. (A laborious process because of the number of stations involved.)
 LCP x:y (-108:-720) (0,0) point for Lambert Conformal Projection 40 Deg N : -97 Deg W LCP x:y")
5 CALMET MET DOMAIN (Blue) / CALPUFF COMPUTATIONAL DOMAIN (Green) LCP x:y (-108:1404) Domain was agreed upon by participants in Dec 2003 LCP x:y (2520:1404) LCP x:y (-108:-720) (0,0) point for Lambert Conformal Projection 40 Deg N : -97 Deg W LCP x:y (2520:-720)
6 Emission Inputs for First Phase CALPUFF runs completed in September 2004 DOMAIN-WIDE SOURCES Annual 2002 Emissions in TONS Source Type SOx NOx PM2.5 *U.S. EGUs (778 with CEMS Data) 7,460,961 2,833,981 n/a Canadian NPRI Inventory 52 Stacks 859, ,945 15,513 U.S. NEI Stacks 2,423, ,824 18,753 U.S. NEI km GridAreas 1,288,298 1,143, ,548 TOTALS included in Current Runs 12,032,636 4,593, ,814 * Hourly variable emissions were used in evaluations to date. CEMS data does not include Stack Temperature. Default was set at 422 K. Some combined points in database do not have Stack Velocity. Default set at m/sec based on average of points with data NEI point source Information used for Phase I testing only: will be replaced with 2002 NEI data when available NEI Point Source Data file was read source by source: If Annual SO2 for a source was greater than Tons for any source in DOMAIN, source was modeled as a PT. If Annual SO2 for a source was greater than 10.0 Tons for any source within 100 Km of any of 51 Northeastern IMPROVE or FRM PM2.5 monitoring sites, source was modeled as a PT.

7 Red Circles represent EGUs with year 2002 CEMS hourly SO2 & NOx data that was used to create individual point source inputs for CALPUFF runs. Green Circles represent Canadian Point Sources for which 2002 SO2, NOx & PM2.5 emissions data was modeled as individual point sources.
8 Non-CEMS U.S. Emissions in Domain extracted from 1999NEI for Phase I Tons of Emissions : NEI 1999 Pts > 100 SO2 modeled as Points State #Pts SO2 NOx PM2.5 Tons of Emissions : NEI 1999 Pts < 100 SO2 as 20km Grid Squares State #Grids SO2 NOx PM2.5 AL AR CT DC DE GA IA IL IN KY MA MD ME MI MN MO MS NC ND NH NJ NY OH OK PA SC SD TN VA VT WI WV RI TX DOMAIN AL AR CT DC DE GA IA IL IN KY MA MD ME MI MN MO MS NC ND NH NJ NY OH OK PA SC SD TN VA VT WI WV RI TX DOMAIN

9 1999 NEI pt sources aggregated as 20km Area source squares Yr 1999 SO2 Tons in 20km Area Source NOTE: 1999 NEI AREA SOURCES were NOT included in Modeling
10 Monitoring Sites at which CALPUFF EVALUATION is being performed 20 IMPROVE sites with every 3 rd day 24-hr SO4 / NO3 SITE LAT LON X Domain(km) Y Domain(km) HT (m) ACAD HT meters (model terrain) = ADPI HT meters (model terrain) = BRIG HT meters (model terrain) = BRMA HT meters (model terrain) = CABA HT meters (model terrain) = CACO HT meters (model terrain) = COHI HT meters (model terrain) = DOSO HT meters (model terrain) = GRGU HT meters (model terrain) = JARI HT meters (model terrain) = LYBR HT meters (model terrain) = MKGO HT meters (model terrain) = MOMO HT meters (model terrain) = MOOS HT meters (model terrain) = OLTO HT meters (model terrain) = PMRF HT meters (model terrain) = PRIS HT meters (model terrain) = QURE HT meters (model terrain) = SHEN HT meters (model terrain) = WASH HT meters (model terrain) = Note: the IMPROVE sites are Rural, except for the WASH1 site. This Modeling will not model local urban sources well enough to be able to expect good results at urban PM2.5 sites.

11 20 Improve Monitoring Sites (with 100 km radius circles) To be used in Evaluation of 24-hr SO4 CALPUFF Impacts Yr 1999 SO2 Tons in 20km Area Source


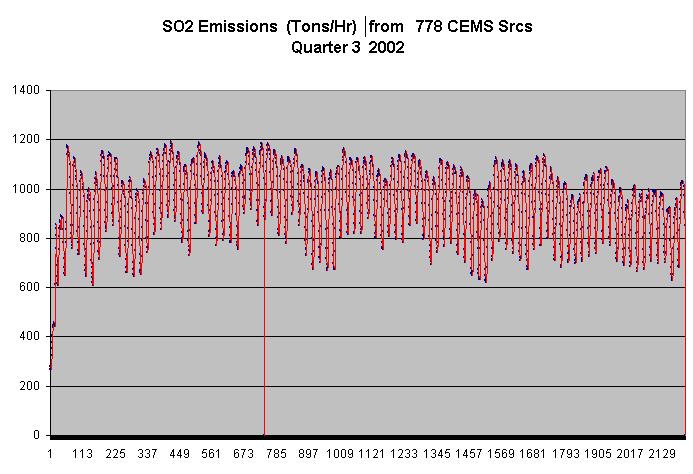

12 Hourly Variation during CEMS EGUs

13 Detail of Hourly Variation Jul 18 -> Aug CEMS EGUs
14 Individual CEMS Facility SO2 Emissions Hourly Variation > 25.0 Tons/Hr > 25.0 Tons/Hr > 15.0 Tons/Hr > 12.5 Tons/Hr 7.5 -> 10.0 Tons/Hr 5.0 -> 7.5 Tons/Hr 2.5 -> 5.0 Tons/Hr < 2.5 Tons/Hr
15 Single Source CALPUFF MODELING RUNS All 778 of the EGUs with CEMS data for 2002 have been modeled individually in order to allow them to be ranked relative to their Sulfate Ion impacts at the Class I areas in the domain. Because Phase I modeling was conducted using meteorology that may still be adjusted after more detailed evaluation has been completed and using preliminary assumptions for monthly background ammonia and H2O2, these rankings are not yet considered final and may change. PHASE I ASSUMPTIONS FUTURE CONSIDERATIONS Monthly Ammonia Constant 1.0 ppb Variable ppb Monthly H2O2 Constant 1.0 ppb Variable by season 0.7 -> 2.0 Nite-time SO2 loss rate Constant 0.2 %/hr Variable by season 0.1 -> 0.3
16 Time Series Animations Hourly or running 24-Hourly concentration isopleths for Single Source runs allow a more comprehensive examination of an individual source s impact potential during the annual period modeled (2002) In particular, these allow a visual comparison of relative impact potential between sources of different overall EMISSION SIZE at different DISTANCES.

17 July September 2002 Running 24-hr Ave SO4 Model Run for Single CEMS Src ORIS Code 03406C10 103,341 Ton/Yr EGU 1465 Km from LYBR
18 July September 2002 Running 24-hr Ave SO4 Model Run for Single CEMS Src ORIS Code ,727 Ton/Yr EGU 893 Km from LYBR
19 July September 2002 Running 24-hr Ave SO4 Model Run for Single CEMS Src ORIS Code ,506 Ton/Yr EGU 371 Km from LYBR
20
21 As part of the Single Source aspect of the modeling study, The CEMS hourly data allowed us to examine whether impacts predicted might be different if the CEMS data were not available and an assumed annual (or seasonal) average rate were used instead.


22 D Ton/Yr EGU 893 Km from LYBR D Ton/Yr EGU 371 Km from LYBR 1hr SO4 Modeled LYBR Period Covered ~ Hr 870 to 1300 in Quarter Constant Ave Rate SO2 Emission Variable CEMS SO2 Rate Ug/m3 D03407C Ton/Yr EGU 1258 Km from LYBR D03406C Ton/Yr EGU 1465 Km from LYBR
23 Single Source outputs of concentration and deposition impact can be easily combined ; To represent impacts from different combinations of sources.
24 Hourly SO4 Ion Concentration Isopleths 10 Largest (Annual SO2 Emissions) CEMS Database EGUs
 CEMS Database")
25 Hourly SO4 Ion Concentration Isopleths 70 Largest (Annual SO2 Emissions) CEMS Database EGUs


26 Hourly SO4 Ion Concentration Isopleths Compares Largest CEMS Database EGUs
27 FULL DOMAIN-WIDE EMISSION CALPUFF MODELING RUNS For Evaluation of Modeling System To Date: Preliminary results from runs with CALMET derived MET fields have been evaluated at 20 IMPROVE sites for modeled sulfate ion based on combining the impacts from ALL Identified Sources of sulfur and nitrogen compound emissions described earlier. 1) 24-Hr Modeled vs Monitored SO4 Ion 2) Monthly Ave Modeled vs Monitored SO4 Ion 3) Quarterly (3-month) Modeled vs Monitored SO4 Ion
28 First Half of July 2002 Running 24-hr Ave SO4 Model Run for 778 CEMS EGU Srcs & 198 Canadian Point Srcs
29 Groupings of Sources were run in CALPUFF for an entire year (2002) of meteorology with only secondary particulate forms from the sulfur chemistry (SO4) saved for use in model evaluation against IMPROVE-type measurements. The groupings were run to produce individual.con file outputs which could be post-processed using CALSUM to obtain TOTAL impacts from all modeled sources at each of 72 discrete receptors. This approach also allows an initial contribution assessment to be performed. The individual output.con files produced for each of 4 Qrtrs included: 778 Individual files of hourly impact from each of the CEMS data EGUs. 32 Individual files of hourly impact due to PT sources in each state within the domain; developed from 1999 NEI point sources > 100 Tns SO2. 33 Individual files of hourly impact due to Area sources in each state within the domain; developed from 1999 NEI point source file residuals. 1 file for Canadian PT sources from 2002 NPRI (National Pollutant Release Inventory) run as 52 point sources with surrogate stack data (all but 3 run at 150 meter stack ht, but 3 large smelters were run at 350 meter stack ht)
30 LYBR Modeled SO4-24-Hr Impacts Time Periods "underpredicted" in PURPLE SO4 Ion ~ ug/m3 11/4/ /10/ /16/ /22/ /28/ /4/ /10/ /16/ /22/2002 1/2/2002 1/8/2002 1/14/2002 1/20/2002 1/26/2002 2/1/2002 2/7/2002 2/13/2002 2/19/2002 2/25/2002 3/3/2002 3/9/2002 3/15/2002 3/21/2002 3/27/2002 4/2/2002 4/8/2002 4/14/2002 4/20/2002 4/26/2002 5/2/2002 5/8/2002 5/14/2002 5/20/2002 5/26/2002 6/1/2002 6/7/2002 6/13/2002 6/19/2002 6/25/2002 7/1/2002 7/7/2002 7/13/2002 7/19/2002 7/25/2002 7/31/2002 8/6/2002 8/12/2002 8/18/2002 8/24/2002 8/30/2002 9/5/2002 9/11/2002 9/17/2002 9/23/2002 9/29/ /5/ /11/ /17/ /23/ /29/ Monitored Modeled LYBR Modeled SO4-24-Hr Impacts Time Periods "overpredicted" in BLUE SO4 Ion ~ ug/m3 10/29/ /4/ /10/ /16/ /22/ /28/ /4/ /10/ /16/ /22/2002 1/2/2002 1/8/2002 1/14/2002 1/20/2002 1/26/2002 2/1/2002 2/7/2002 2/13/2002 2/19/2002 2/25/2002 3/3/2002 3/9/2002 3/15/2002 3/21/2002 3/27/2002 4/2/2002 4/8/2002 4/14/2002 4/20/2002 4/26/2002 5/2/2002 5/8/2002 5/14/2002 5/20/2002 5/26/2002 6/1/2002 6/7/2002 6/13/2002 6/19/2002 6/25/2002 7/1/2002 7/7/2002 7/13/2002 7/19/2002 7/25/2002 7/31/2002 8/6/2002 8/12/2002 8/18/2002 8/24/2002 8/30/2002 9/5/2002 9/11/2002 9/17/2002 9/23/2002 9/29/ /5/ /11/ /17/ /23/2002 Modeled Monitored
31 Weekly Running Averages for SO4 Ion Modeled vs Monitored at LYBR IMPROVE Site SO4 Ion ~ ug/m 3 1/2/2002 1/8/2002 1/14/2002 1/20/2002 1/26/2002 2/1/2002 2/7/2002 2/13/2002 2/19/2002 2/25/2002 3/3/2002 3/9/2002 3/15/2002 3/21/2002 3/27/2002 4/2/2002 4/8/2002 4/14/2002 4/20/2002 4/26/2002 5/2/2002 5/8/2002 5/14/2002 5/20/2002 5/26/2002 6/1/2002 6/7/2002 6/13/2002 6/19/2002 6/25/2002 7/1/2002 7/7/2002 7/13/2002 7/19/2002 7/25/2002 7/31/2002 8/6/2002 8/12/2002 8/18/2002 8/24/2002 8/30/2002 9/5/2002 9/11/2002 9/17/2002 9/23/2002 9/29/ /5/ /11/ /17/ /23/ /29/ /4/ /10/ /16/ /22/ /28/ /4/ /10/ /16/ /22/2002 Modeled Monitored 3 per. Mov. Avg. (Modeled) 3 per. Mov. Avg. (Monitored)
32 MKGO Modeled SO4-24-Hr Impacts Time Periods "overpredicted" in BLUE 1/2/2002 1/8/2002 1/14/2002 1/20/2002 1/26/2002 2/1/2002 2/7/2002 2/13/2002 2/19/2002 2/25/2002 3/3/2002 3/9/2002 3/15/2002 3/21/2002 3/27/2002 4/2/2002 4/8/2002 4/14/2002 4/20/2002 4/26/2002 5/2/2002 5/8/2002 5/14/2002 5/20/2002 5/26/2002 6/1/2002 6/7/2002 6/13/2002 6/19/2002 6/25/2002 7/1/2002 7/7/2002 7/13/2002 7/19/2002 7/25/2002 7/31/2002 8/6/2002 8/12/2002 8/18/2002 8/24/2002 8/30/2002 9/5/2002 9/11/2002 9/17/2002 9/23/2002 9/29/ /5/ /11/ /17/ /23/ /29/ /4/ /10/ /16/ /22/ /28/ /4/ /10/ /16/ /22/ MKGO Modeled SO4-24-Hr Impacts Time Periods "underpredicted" in PURPLE Modeled Monitored 1/2/2002 1/8/2002 1/14/2002 1/20/2002 1/26/2002 2/1/2002 2/7/2002 2/13/2002 2/19/2002 2/25/2002 3/3/2002 3/9/2002 3/15/2002 3/21/2002 3/27/2002 4/2/2002 4/8/2002 4/14/2002 4/20/2002 4/26/2002 5/2/2002 5/8/2002 5/14/2002 5/20/2002 5/26/2002 6/1/2002 6/7/2002 6/13/2002 6/19/2002 6/25/2002 7/1/2002 7/7/2002 7/13/2002 7/19/2002 7/25/2002 7/31/2002 8/6/2002 8/12/2002 8/18/2002 8/24/2002 8/30/2002 9/5/2002 9/11/2002 9/17/2002 9/23/2002 9/29/ /5/ /11/ /17/ /23/ /29/ /4/ /10/ /16/ /22/ /28/ /4/ /10/ /16/ /22/2002 Monitored Modeled
33 Weekly Running Averages for SO4 Ion Modeled vs Monitored at MKGO IMPROVE Site SO4 Ion ~ ug/m 3 1/2/2002 1/8/2002 1/14/2002 1/20/2002 1/26/2002 2/1/2002 2/7/2002 2/13/2002 2/19/2002 2/25/2002 3/3/2002 3/9/2002 3/15/2002 3/21/2002 3/27/2002 4/2/2002 4/8/2002 4/14/2002 4/20/2002 4/26/2002 5/2/2002 5/8/2002 5/14/2002 5/20/2002 5/26/2002 6/1/2002 6/7/2002 6/13/2002 6/19/2002 6/25/2002 7/1/2002 7/7/2002 7/13/2002 7/19/2002 7/25/2002 7/31/2002 8/6/2002 8/12/2002 8/18/2002 8/24/2002 8/30/2002 9/5/2002 9/11/2002 9/17/2002 9/23/2002 9/29/ /5/ /11/ /17/ /23/ /29/ /4/ /10/ /16/ /22/ /28/ /4/ /10/ /16/ /22/2002 Modeled Monitored 3 per. Mov. Avg. (Monitored) 3 per. Mov. Avg. (Modeled)
34 Weekly Running Averages for SO4 Ion Modeled vs Monitored at ADPI IMPROVE Site SO4 Ion ~ ug/m 3 1/2/2002 1/8/2002 1/14/2002 1/20/2002 1/26/2002 2/1/2002 2/7/2002 2/13/2002 2/19/2002 2/25/2002 3/3/2002 3/9/2002 3/15/2002 3/21/2002 3/27/2002 4/2/2002 4/8/2002 4/14/2002 4/20/2002 4/26/2002 5/2/2002 5/8/2002 5/14/2002 5/20/2002 5/26/2002 6/1/2002 6/7/2002 6/13/2002 6/19/2002 6/25/2002 7/1/2002 7/7/2002 7/13/2002 7/19/2002 7/25/2002 7/31/2002 8/6/2002 8/12/2002 8/18/2002 8/24/2002 8/30/2002 9/5/2002 9/11/2002 9/17/2002 9/23/2002 9/29/ /5/ /11/ /17/ /23/ /29/ /4/ /10/ /16/ /22/ /28/ /4/ /10/ /16/ /22/2002 Modeled Monitored 3 per. Mov. Avg. (Monitored) 3 per. Mov. Avg. (Modeled)
35 Weekly Running Averages for SO4 Ion Modeled vs Monitored at BRMA IMPROVE Site SO4 Ion ~ ug/m 3 1/2/2002 1/8/2002 1/14/2002 1/20/2002 1/26/2002 2/1/2002 2/7/2002 2/13/2002 2/19/2002 2/25/2002 3/3/2002 3/9/2002 3/15/2002 3/21/2002 3/27/2002 4/2/2002 4/8/2002 4/14/2002 4/20/2002 4/26/2002 5/2/2002 5/8/2002 5/14/2002 5/20/2002 5/26/2002 6/1/2002 6/7/2002 6/13/2002 6/19/2002 6/25/2002 7/1/2002 7/7/2002 7/13/2002 7/19/2002 7/25/2002 7/31/2002 8/6/2002 8/12/2002 8/18/2002 8/24/2002 8/30/2002 9/5/2002 9/11/2002 9/17/2002 9/23/2002 9/29/ /5/ /11/ /17/ /23/ /29/ /4/ /10/ /16/ /22/ /28/ /4/ /10/ /16/ /22/2002 Modeled Monitored 3 per. Mov. Avg. (Monitored) 3 per. Mov. Avg. (Modeled)
36 Weekly Running Averages for SO4 Ion Modeled vs Monitored at ACAD IMPROVE Site SO4 Ion ~ ug/m3 1/2/2002 1/8/2002 1/14/2002 1/20/2002 1/26/2002 2/1/2002 2/7/2002 2/13/2002 2/19/2002 2/25/2002 3/3/2002 3/9/2002 3/15/2002 3/21/2002 3/27/2002 4/2/2002 4/8/2002 4/14/2002 4/20/2002 4/26/2002 5/2/2002 5/8/2002 5/14/2002 5/20/2002 5/26/2002 6/1/2002 6/7/2002 6/13/2002 6/19/2002 6/25/2002 7/1/2002 7/7/2002 7/13/2002 7/19/2002 7/25/2002 7/31/2002 8/6/2002 8/12/2002 8/18/2002 8/24/2002 8/30/2002 9/5/2002 9/11/2002 9/17/2002 9/23/2002 9/29/ /5/ /11/ /17/ /23/ /29/ /4/ /10/ /16/ /22/ /28/ /4/ /10/ /16/ /22/2002 Modeled Monitored 3 per. Mov. Avg. (Monitored) 3 per. Mov. Avg. (Modeled)
37 Weekly Running Averages for SO4 Ion Modeled vs Monitored at MOOS IMPROVE Site SO4 Ion ~ ug/m 3 1/2/2002 1/8/2002 1/14/2002 1/20/2002 1/26/2002 2/1/2002 2/7/2002 2/13/2002 2/19/2002 2/25/2002 3/3/2002 3/9/2002 3/15/2002 3/21/2002 3/27/2002 4/2/2002 4/8/2002 4/14/2002 4/20/2002 4/26/2002 5/2/2002 5/8/2002 5/14/2002 5/20/2002 5/26/2002 6/1/2002 6/7/2002 6/13/2002 6/19/2002 6/25/2002 7/1/2002 7/7/2002 7/13/2002 7/19/2002 7/25/2002 7/31/2002 8/6/2002 8/12/2002 8/18/2002 8/24/2002 8/30/2002 9/5/2002 9/11/2002 9/17/2002 9/23/2002 9/29/ /5/ /11/ /17/ /23/ /29/ /4/ /10/ /16/ /22/ /28/ /4/ /10/ /16/ /22/2002 Modeled Monitored 3 per. Mov. Avg. (Monitored) 3 per. Mov. Avg. (Modeled)
38 Modeled Modeled vs Monitored vs Ave Monthly Ave SO4 Monthly Ion at 20 IMPROVE-type SO4 Monitoring Ion at Sites 20 IMPROVE 3 months July - September Included Monitoring Sites 3 Months July September y = x R 2 = Monitored SO4 Ion ~ ug/m Modeled SO4 Ion ~ ug/m3
39 14 12 Modeled vs Monitored Ave Monthly SO4 Ion at 20 IMPROVE-type Monitoring Sites All 12 months January - December Included Modeled vs Monitored Ave Monthly SO4 Ion at 20 IMPROVE Monitoring Sites 12 Months January December 2002 y = x R 2 = Monitored SO4 Ion ~ ug/m Modeled SO4 Ion ~ ug/m3

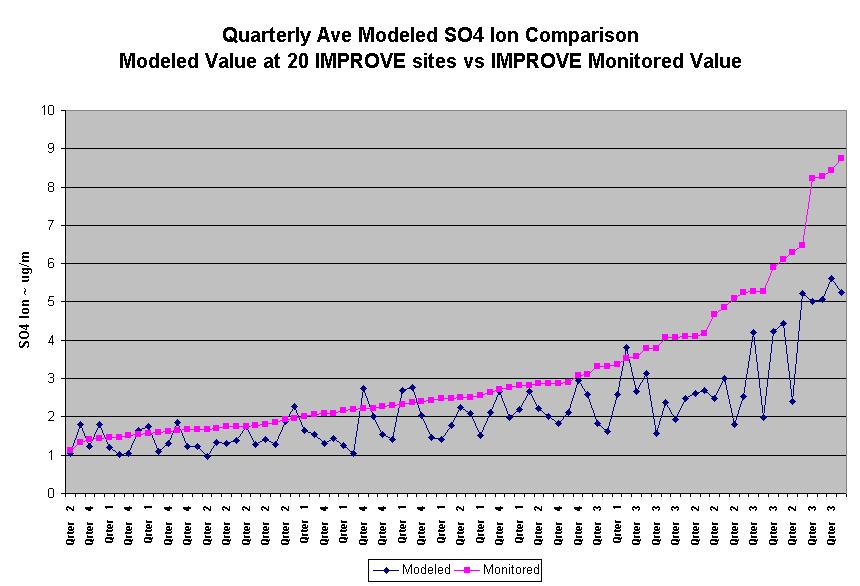
40 Modeled vs Monitored Ave Quarterly SO4 Ion at 20 IMPROVE Monitoring Sites 12 Months January December 2002

41
42
43 NEXT STEPS 1. Attempt to improve the components of the source emissions inputs for sources other than the CEMS EGU sources. 2. Continue to evaluate the CALMET produced meteorological fields based on closer examination of the patterns of the CALPUFF results in conjunction with the default settings and assumptions used in producing the fields. 3. Evaluate the CALPUFF model using CASTNET data (weekly analyses) as well as the FRM fine particulate matter measurement data (full year of daily 24-Hr measurements). 4. Drive CALPUFF with 2002 meteorology created using MM5 (ERM work) as well as fields generated using ETA model archived upper air data (EDAS) at 80 km grid spacing.