Best Practices of Flood Hazard Mapping in Japan
|
|
|
- Kellie Thornton
- 5 years ago
- Views:
Transcription


1 FACING ABNORMAL FLOOD DISASTERS: NEW VISION FOR APEC ECONOMIES Da Nang, Viet Nam, July 28 29, 2011 Best Practices of Flood Hazard Mapping in Japan Kenichiro KOBAYASHI and Kaoru TAKARA Disaster Prevention Research Institute and GCOE-ARS Kyoto University 2011/7/28


 Info.")
2 A non-structural measure flood hazard map Flood hazard maps are a tool to show inundation risk areas, evacuation sites, etc. to residents in an easy-to-understand way based on inundation risk area maps produced by river administrators. The maps aims to help residents quick and safe evacuation. The hazard map making become mandatory by the ammendament of Flood Control Law in 町 Inundation risk area map (by river administrators) Info. dissemination routes Underground space distribution Useful tips & items for evacuation Inundation risk areas & depths Names & locations of evacuation sites Contact info. -Public offices - Hospitals -Lifeline facilities - Other offices


3 東海水害 Flood in (2000.9) Nagoya (2000.9) Inner water River water


4 Flood in Fukuoka(1999.6)
 Hakata JR Station 7:30 a.m.")
5 Flood in Fukuoka (2003.7) Hakata JR Station 7:30 a.m. July 19,2003


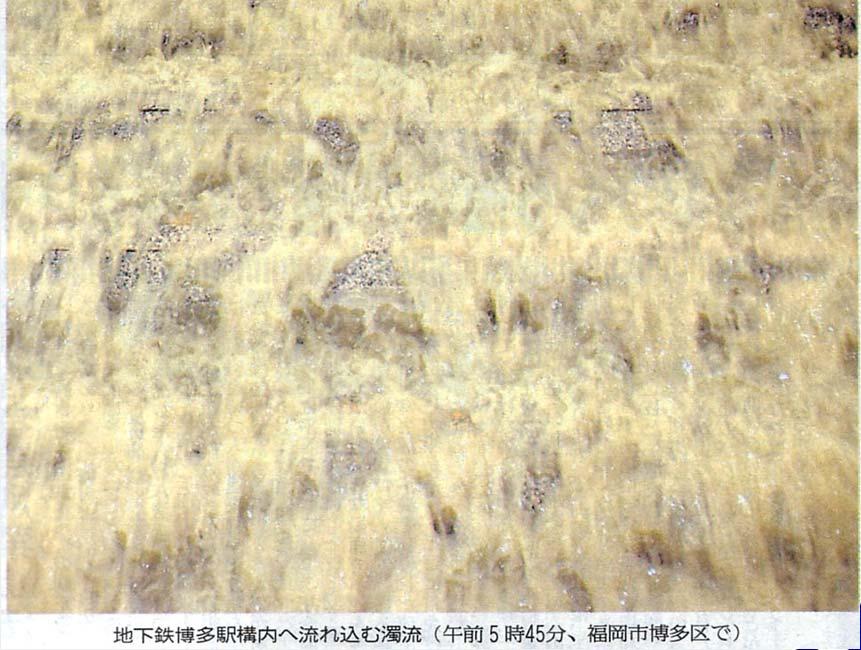
6 Water flow into underground space 99 Fukuoka 99 Fukuoka 03 Fukuoka (Yomiuri Newspaper)
7 Preparedness: Hazard Maps in Municipalities in Japan (as of March 2011) Hazard Maps prepared Available on Internet Tsunami Flood 1,170 1,020 Landslide/debris flow Earthquake High tide Volcano Eruption Inland water inundation
8 Preparedness: Hazard Maps Tsunami: 357 (available on Internet: 249) Flood: 1,170 (available on Internet: 1,020) After MLIT web
 (including debris flow and sediment hazard) After MLIT")
9 Preparedness: Hazard Maps Landslides: 701 (available on Internet: 508) Earthquake: 670 (available on Internet: 389) (including debris flow and sediment hazard) After MLIT web
10 Preparedness: Hazard Maps High tide: 101 (available on Internet: 79) Volcano: 78 (available on Internet: 2) (including debris flow and sediment hazard) After MLIT web

11 Manual of flood hazard map preparation (Japanese version) _gaiyou.pdf
12 Manual of flood hazard map preparation (English version) FNet.pdf

13 What is hazard map? Possible inundation area is shown Evacuation information is described The head of local municipality is the main actor of the preparation /hm_gaiyou.pdf

14 Necessary items in the hazard map Common items In principle, common items must be put to all the hazard maps, i.e. this is the minimum requirement of the hazard maps The communication method of flood forecasting and evacuation information Possible Inundation area Possible damage form The location of the weather/water level information Dangerous area at the time of evacuation Evacuation area ou.pdf


15 How to make an hazard map; the example of Inazawa city ( 稲沢市 ), Aichi Prefecture, Japan Assume the dike break point A, B at a river across the Inazawa city Simulate the flood inundation area and depth from the A or B with the 100-year rainfall Superpose the inundation areas and depths of the two simulations

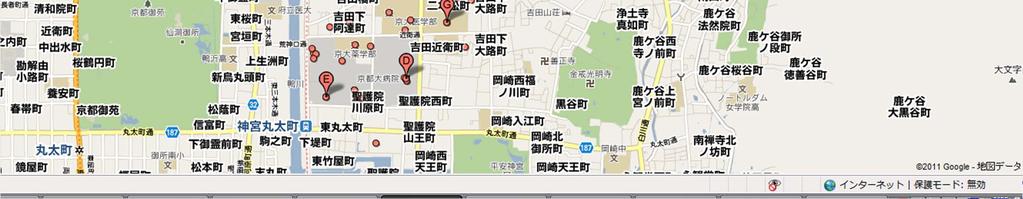
16 Where is Kyoto University Main Campas?


17 Inundation of Kyoto University is not severely predicted Evacuation sites need to be checked for risks of inundation and sediment-related disasters.
 Vertical")
 Foot care Side")

18 What should be cared for the evacuation? Less belongings Play shoe (not high boot) Vertical evacuation (to the 2 nd floor) Stop the fire origin Walk evacuation (not by car) Foot care Side ditch/manhole Help elderly and disability people 3WB_sakyo_joho_mizu.pdf


19 Whole town hazard map Machigoto marugoto hazard map a06/05/050703_.html

20 Our Activities: Ryuou Town Ryuou Town Located in the middle to downstream region of the Hinogawa river Large part of the town is surrounded by Yukinoyma in the east, Kagamiyama in the west, hilly terrain in the south and the Hinogawa river in the north Town area: 44.52km 2, population:13674(male:7529, female: 6145), 5045 households(as of March 1, 2008)

21 Flood Inundation simulation (movie)


22 Utilizing GIS vector data Raster type water depth overlaid on the vector map Integrated result
23 The relation between the house damage ratio and the inundation depth Inundation depth Ground slope Chisui Keizai Chousa Manual (2005 version)


24 The relationship between the crop damage ratio and the inundation depth + duration Inundation depth Inundation duration Rice field Crop field Chinese cabbage Chisui Keizai Chousa Manual (2005 version)
: 2.")

 House value (Shiga) :1519 USD/m 2 House area (Ryuou")

25 Economic loss Economic loss Annual rice yield (Shiga): kg/m 2 Rice price per Kg (Shiga): 2.89 USD/kg Paddy field area: 3419 m 2 Water depth: 2.5 m, crop damage:37 % Economic loss of the crop: =1920 USD Following: Chisui Keizai Chousa Manual (2005 version) House value (Shiga) :1519 USD/m 2 House area (Ryuou post office): 376 m 2 Water depth: 0.71 m, House damage ratio:20.5 % Economic loss of the building: = USD Following: Chisui Keizai Chousa Manual (2005 version)


26 A workshop with people and a local government for discussing flood simulation in a river basin

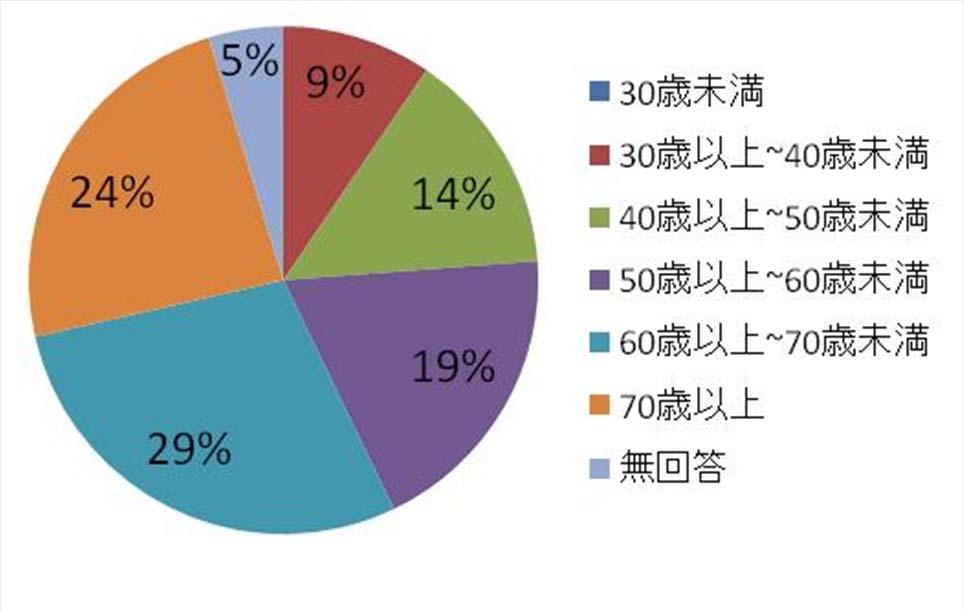
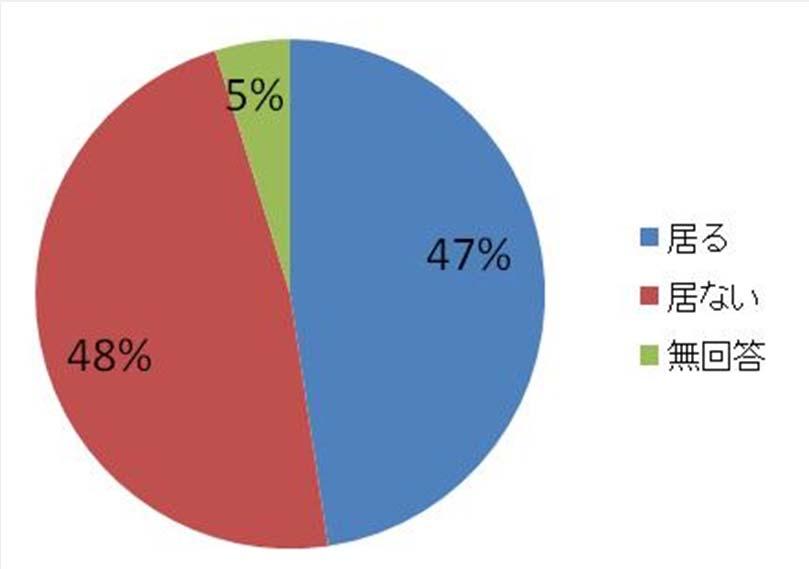

27 Attributes of respondents Age # of family members Handicapped persons Day time residents
28 Discussions at Workshop The damage of the paddy rice is different according to the season. It is totally damaged by 1- hr inundation before the spike of the paddy rice grows. The evaluation should be weeklybasis according to the growth of the spike. It is also different by the type. Paddy rice has still resistance against water. Vegetables such as cabbage is very week (0 or 100). A paddy field damage (e.g USD) is affordable. The damage of cars or buildings are much harder. Inundation depth of Yuge (3.1m) is probably correct but the countermeasure has already been taken. The houses in Yuge is built on high foundation. To save human life by leading the floods to paddy field is acceptable. Paddy field can be used for the disaster prevention purpose. Water gate is controlled by community. The gate closes when the water level becomes higher. The simulation result is different from the Hazard map published by Ryuou Town. It should be clearly explained. House economic damage is too big. It was USD for example.


")


.")


29 Projection of future Climate Rainfall after 100years is projected to increase 10 to 30% (max. 50%) Increasing rate in northern area is bigger. A Future rainfall amounts were projected as a median value in each region of Average rainfall in period Average rainfall in period The maximum daily precipitation in the year GCM20 (A1B scenario). B Flood Safety Level Decline of flood safety level 現計画Present 東道A B 北海北Increasing rainfall intensity will make the flood safety level significantly lower than present 29