Return on Investment with Smart Irrigation Technology South Florida Landscape Irrigation Symposium Homestead, FL, May 1, 2014
|
|
|
- Joshua Higgins
- 5 years ago
- Views:
Transcription

1 Return on Investment with Smart Irrigation Technology South Florida Landscape Irrigation Symposium Homestead, FL, May 1, 2014 Michael D. Dukes, Ph.D. P.E. C.I.D. & Stacia L. Davis, M.E. E.I.T. Agricultural & Biological Eng. University of Florida-IFAS
2 UF/IFAS Center for Landscape Conservation and Ecology Mission To protect and conserve Florida's natural resources through research-based sustainable urban landscape practices. Vision To be the leading source of science-based information on horticulture and the urban environment in Florida. clce.ifas.ufl.edu
3 How Much Water Can Be Saved? *Toilets: *Dishwasher: *Washing Machine: 2,484 gal/yr 288 gal/yr 5,220 gal/yr Irrigation Scheduling (25%): 18,837 gal/yr 240% of all indoor *DeOreo et al California Single-family Water Use Efficiency Study

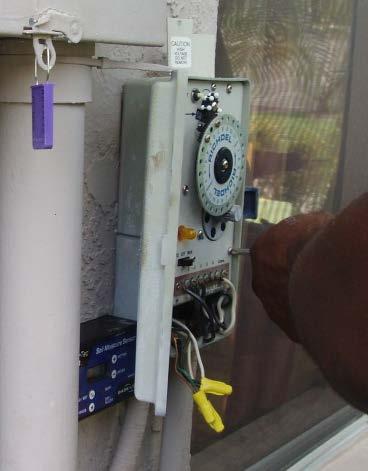
4 Smart Controllers From Irrigation Association Smart Water Application Technologies (SWAT) committee (2007) Smart controllers estimate or measure depletion of available plant soil moisture in order to operate an irrigation system, replenishing water as needed while minimizing excess water use. A properly programmed smart controller requires initial site specific set-up and will make irrigation schedule adjustments, including run times and required cycles, throughout the irrigation season without human intervention.
 Evapotranspiration (ET) based")

5 Smart Water Application Technologies (SWAT) Soil moisture controllers (SMS) Evapotranspiration (ET) based controllers Irrigation controllers that respond to conditions in the irrigated system to automatically adjust to plant needs

6 Soil Moisture Sensor Controller

7 ET Controllers Can determine runtimes and days Programming is key! Soil type Plant type Microclimate Application rates Slope
 2,294 sites/3,112 smart controllers: 6% Savings 384 sites: 16.")
8 Smart Controllers Nationally Colorado ET controller study (Aquacraft, 2002; Aquacraft, 2003) After 3 years, there were no actual water savings due to 5 of 7 sites being historical under-irrigators California ET controller study (Mayer et al., 2009) 2,294 sites/3,112 smart controllers: 6% Savings 384 sites: 16.4% savings after year 3

9 Problem: Water conservation programs make smart controllers available to everyone indiscriminately Increased irrigation can occur when smart controllers are implemented in an already conservative environment Objective: Evaluate methodologies for identifying single-family home utility customers capable of benefiting from implementing smart controllers Photo by Michael Gutierrez
")
10 Hillsborough County Water Resource Services (HCWRS)
11 HCWRS Targeting Cooperators Targeted areas selected based on historical water use analysis Top 50% of water users in Hillsborough County High water use by homeowners in top 25 th to 75 th percentile Communities selected: Apollo Beach Riverview Valrico Participant selection 2,000 4,000 letters mailed to qualifying irrigators across the three communities Interested participants responded to the letter by taking a survey

12 HCWRS Technology & Expt. Design Outcome to solicitation 68 responses to survey After on-site irrigation evaluations, 36 participants were selected Treatments 21 received Toro Intelli-Sense ET controllers 15 were comparisons, no changes made Number of homes in each treatment Location ET Controller Comparison Apollo Beach 7 6 Riverview 5 3 Valrico 9 7


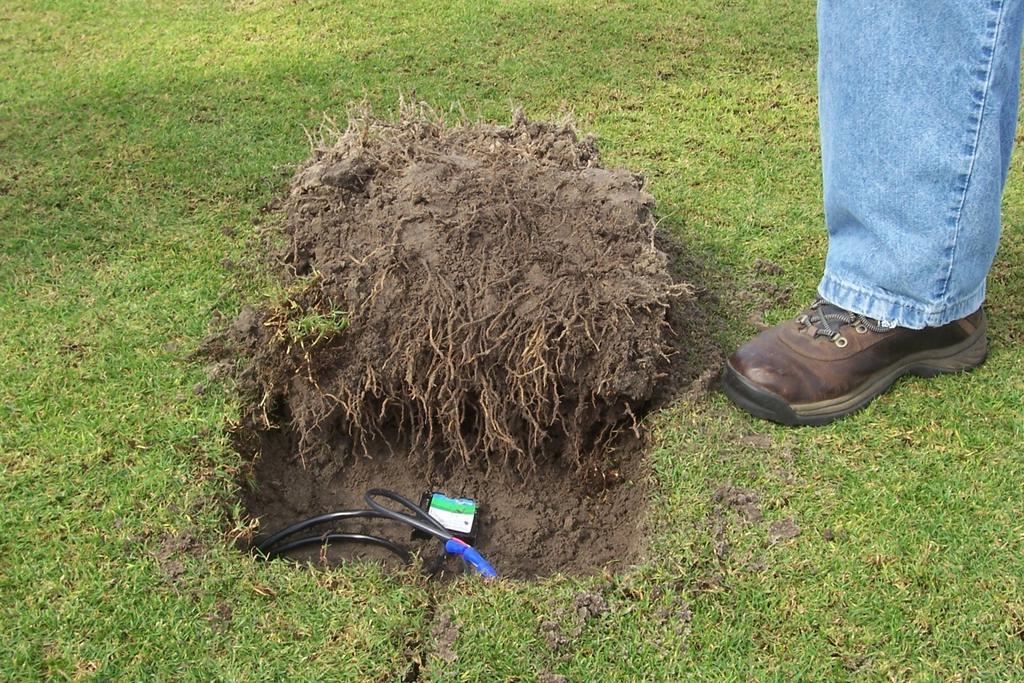
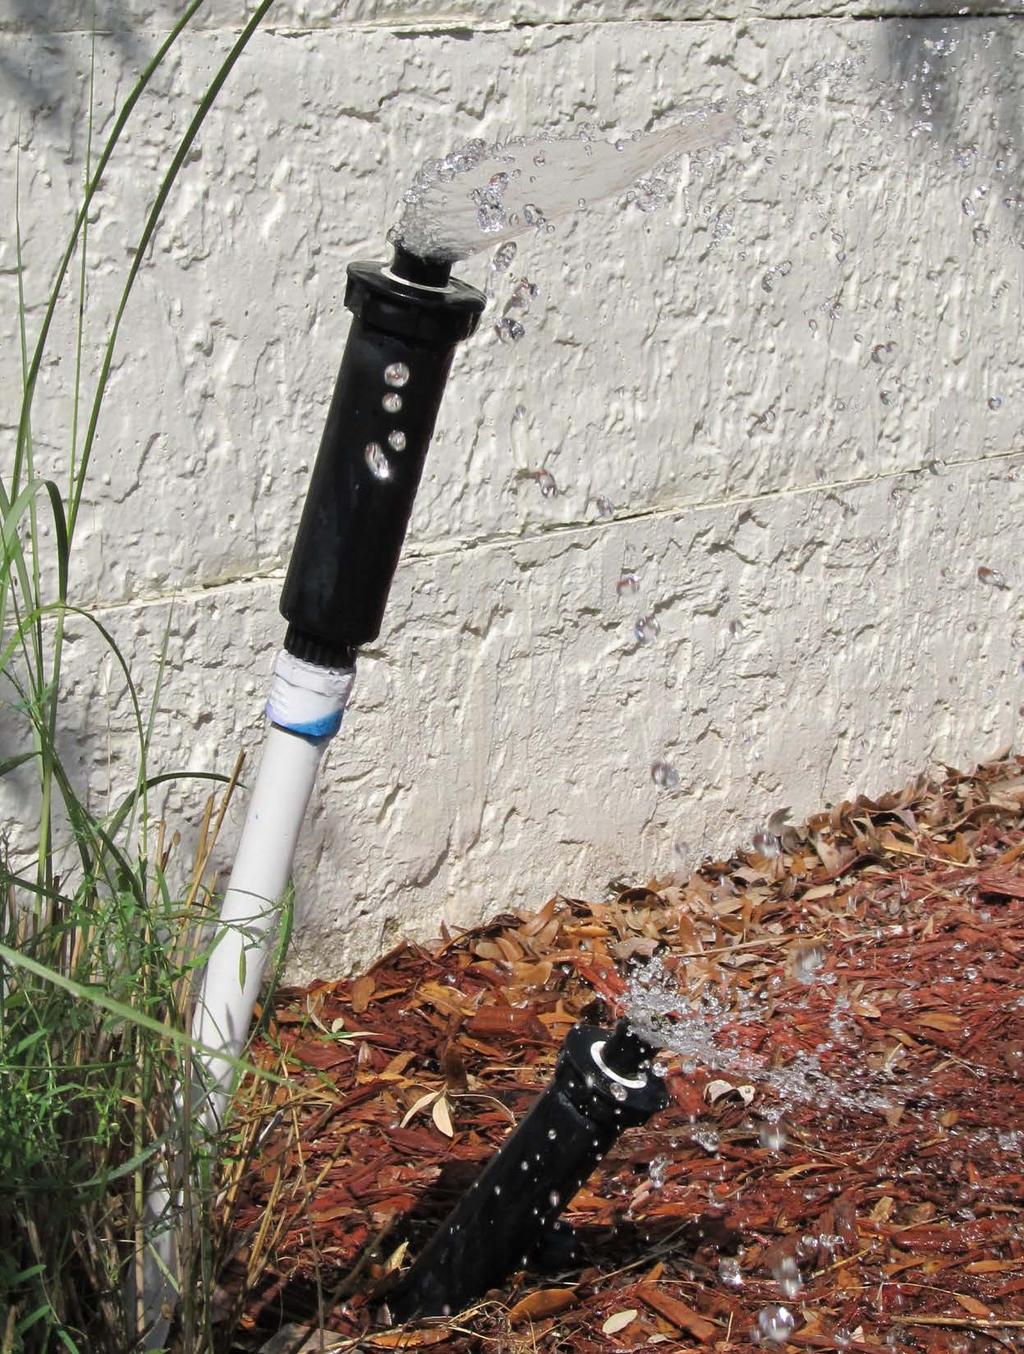
13 Irrigation Inspection: The System Review Activate all zones Observe and document which components are not operating correctly The Sprinkler System Review form can help with recording and reporting


14 Low Pressure
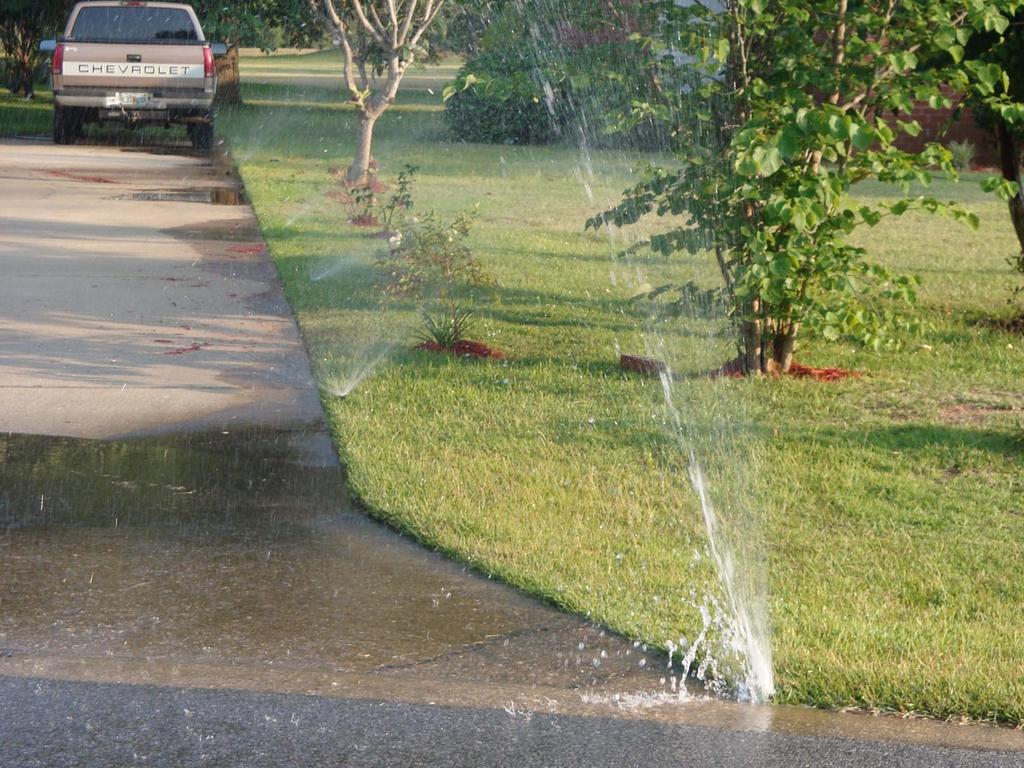
15 Broken Sprinklers


16 Promote Efficient Irrigation Bad Seals

17 Mismatched Sprinklers Promote Efficient Irrigation

18 HCWRS Data Collection Data Collection (February 2009 January 2011) Automatic meter recording (AMR) devices Data collected at 15 minute intervals Irrigation was separated from indoor water use Assumption of lower flow rates for indoor appliances
19 Orange County Utilities (OCU)
20 OCU Targeting Cooperators 35,000 Number of customers 28,000 21,000 14,000 7,000 Theoretical limit = 3 in month -1 Area where potential cooperators were identified 7,407 possible participants 1.5 times theoretical limit = 4.6 in month -1 4 times theoretical limit = 12 in month More Estimated irrigation (mm month -1 )


21 OCU Technologies & Expt. Design Treatment ET ET+Edu SMS SMS+Edu Comparison Rain Bird ESP- SMT Rain Bird ESP- SMT Baseline WaterTec S100 Baseline WaterTec S100 Technology -- Locations Installed Number Installed Monitored: 1 Dec 2011 through 30 Nov 2012 (12 months)


22 OCU Education Groups ET+Edu treatment Reprogrammed for site specifics 5 minute tutorial Total Count = 38 Total Locations = 9 SMS+Edu treatment Inserted into soil column at 3 inch depth Reprogrammed for 0.25 per event, 2 events per day, 3 d/wk 5 minute tutorial Total count = 38 Total locations = 9


23 OCU Irrigation Measurement AMR devices Dedicated flow meter to measure irrigation only Records hourly irrigation volumes Monthly downloads


24 OCU Weather Stations Installed in each regional treatment location. Two additional rain gauges were installed for homes significantly farther away from the weather station.


25 Materials and Methods Saturation Field Capacity Maximum Allowable Depletion Permanent Wilting Point


26 Materials and Methods ET C Rain Saturation Field Capacity RZWWS Maximum Allowable Depletion 0 Permanent Wilting Point
27 ET Controllers Goal to maintain soil water between FC (upper limit) and MAD (lower limit) Soil water (mm) FC = 12% MAD = 50% RAW PWP = 4%
28 Monthly Application Ratios 1 Did they apply what they needed before the study? 0 4 Pre-Ratio Did they apply more/less than before the study? Did they apply what they needed during the study? Post-Ratio Ratio Difference = Post-Ratio Pre-Ratio

29 Historical Compared to GIR Minimum of 5 years per cooperator HCWRS OCU 6.9 B 6.0 C 8.3 A 6.4 C 7.3 B 2.4 a 1.9 b 1.5 c 1.5 c 2.0 ab 2.1 ab


30 Study Compared to Historical HCWRS OCU 1.1 a 1.1 a 0.79 b 0.63 b 0.87 b 0.88 A 0.93 A 0.71 B 0.63 B 0.51 B 0.27 c

31 Treatment Compared to GIR HCWRS OCU 4.3 A 3.3 B 2.8 B 2.9 B 2.0 C 1.1 a 0.79 b 0.30 c 0.68 b 0.91 ab 0.91 ab
32 Utility Tiered Rates HCWRS Tier Volume Range (gal) Cost ($) 1 0 5, ,001 15, ,001 30, , Wastewater 0 8, OCU Tier Volume Range (gal) Cost ($) 1 0 3, ,501 10, ,501 20, ,501 30, , Wastewater 0 14, ,300 ft 2 Irrigated Area 4,800 ft 2
33 Annual Water Savings Annual Savings (gal) Annual Savings (gal) Apollo Beach Riverview Valrico 0 ET ET+Edu SMS SMS+Edu Treatment Treatment
34 Return on Investment Purchase and installation prices of $400 and $600 for SMS and ET controllers, $600 respectively $600 $500 $500 Annual Savings $400 $300 $200 Annual Savings $400 $300 $200 $100 $100 $0 Treatment $0 ET ET+Edu SMS SMS+Edu Treatment Payback Period (months)
35 Research Based Irrigation Savings Potential Irrigation Savings (%) Rainy Dry No data No data No data No data
36 Conclusions Identifying excessive irrigators prior to smart controller implementation was beneficial in reducing irrigation Already conservative irrigators resulted in no change or increased irrigation Combining targeted selection of homeowners with a water conservation program would maximize water savings

37 Questions?