Beginning the Treatment Journey
|
|
|
- Anna Sutton
- 5 years ago
- Views:
Transcription


1 Beginning the Treatment Journey The City of Meridian s Path to Bring Online Their First Drinking Water Treatment Plant Perrin Robinson/CH2M Clint Worthington/City of Meridian Enoch Nicholson/CH2M PNWS AWWA 2016 Boise, Idaho May 2016 May the Source be with You
2 Presentation Overview Background and History Pilot Testing Design and Construction Startup and Operations Key Lessons Learned 2
3 Background and History 3

4 Meridian Water System Background Population 85, Wells 47 MGD Supply 12 Wells exceed SMCL for Iron/Manganese Well 21 4
5 Brown Water Iron and Manganese oxidized and precipitated out by chlorine Aesthetic Concerns Staining of laundry Discoloration of plumbing fixtures Rusty taste and color to water Operational Concerns Precipitate in the distribution system Promote growth of iron and manganese bacteria Reduce pipeline capacities Clogging of meters and valves 5
6 Brown Water History Past Slightly lower chlorine residuals in the system Customer expectations not as concerned with brown water Ability to utilize wells with better water quality Present Slightly higher chlorine residuals Build-up in pipes over time Customer expectation increase 6
7 Decision to Treat Customer service expectations /City s elevated focus on customer service Drilling out of it gets us into other contaminates Better understanding of treatment technology and its cost Coupling treatment with unidirectional flushing to clean pipes in the distribution system Pilot Testing 7


8 Why Well 21 Located in the largest pressure zone Higher levels of iron/manganese Larger producer in the pressure zone 8
9 Well 21 History Constructed in 2000 Water rights for 2,020 gpm Deep well consisting of: 18-inch diameter steel from surface to 590 feet below ground surface (bgs) 10-inch diameter alternating steel and screen from 557 feet bgs to 806 feet bgs Pump drawdown test at 1,760 gpm and total drawdown of 42 feet to a resulting water surface elevation of ~62 feet bgs Primary production well until water quality concerns emerged and then moved to a backup well 9
10 Well 21 Water Quality Issues Constituent Historical Level SMCL Ammonia as N, mg/l Iron, mg/l Manganese, mg/l Hydrogen Sulfide/Sulfate Enough to Smell/Taste 10
11 Pilot Testing 11
12 Free Chlorine Residual (mg/l) Pilot Testing Round 1 CHLORINE GREEN SAND PYROLUSITE GPM/SF Chlorine Dose (mg/l) 12
13 Pilot Testing Round 1 Well 21 Pilot Testing Taste and Odor Panel Results Objectionable Moderate Noticeable None 1 Day 2 Days 3 Days Chlorine Rotten Egg Metallic 13


14 Well Zone Water Chemistry Determination Cleaning and redevelopment of the well Spinner logging performed Depth-specific sampling performed 14
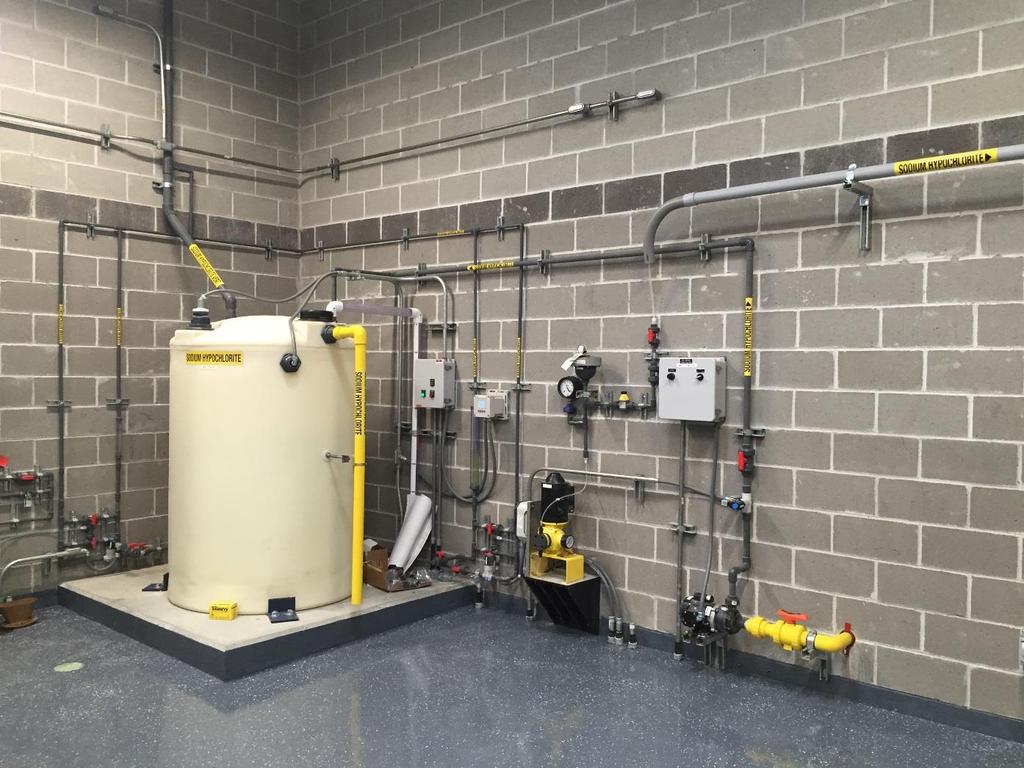
15 Pilot Testing Round 2 15
16 Pilot Testing Round 2 16
17 Intensity of Metallic Taste and Odor (0 to 3 scale) Pilot Testing Round 2 Metallic Taste and Odor mg/l chloramine target 0.4 mg/l free chlorinetarget 0.8 mg/l free chlorine target Days after Chlorination 17
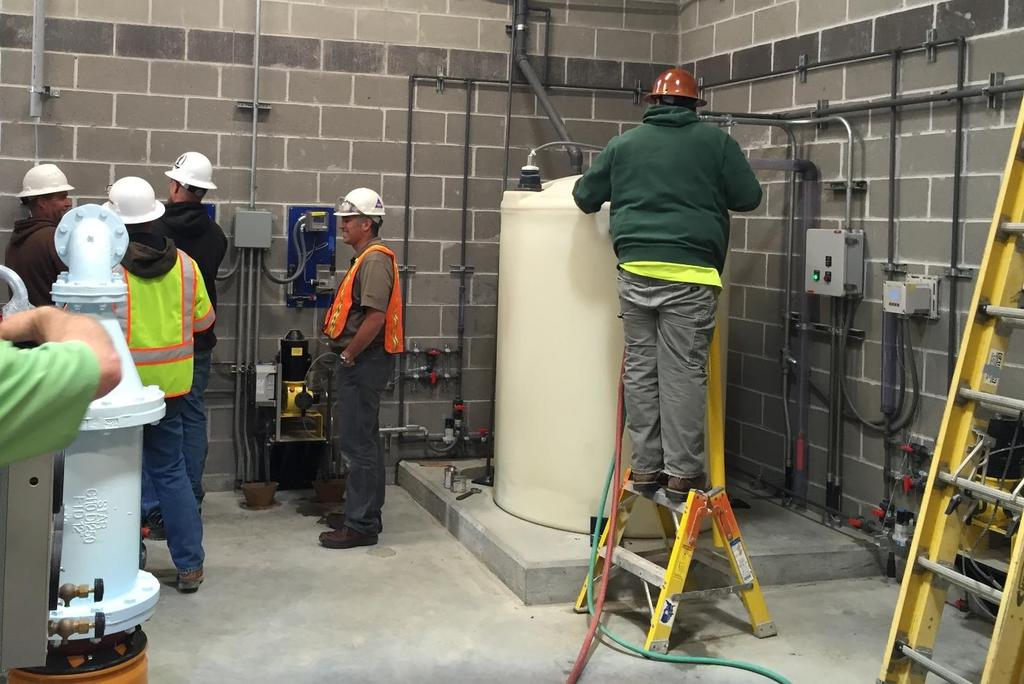
18 Intensity of Taste and Odor (0 to 3 Scale) Pilot Testing Round 2 Chlorine/Chloramine Taste and Odor Chlorine Metallic/Bitter % 20% 40% 60% 80% 100% Blend Ratio - Percent of Chlorinated Water Added to Chloraminated Water 18
19 Pilot Testing Round 2 Outcomes and Path Forward Periodic well redevelopment is beneficial More consistent water quality, especially ammonia Lower occurrence of reduced sulfur Both chlorine and permanganate were good oxidants Both treatment regimes produced good tasting water and confirmed loading rate of 10 gpm/sf Recommended using free chlorine for both oxidation and for residual maintenance targeting free chlorine residual of 0.8 mg/l Provide space in facility for potential future permanganate feed system 19
20 Design and Construction 20

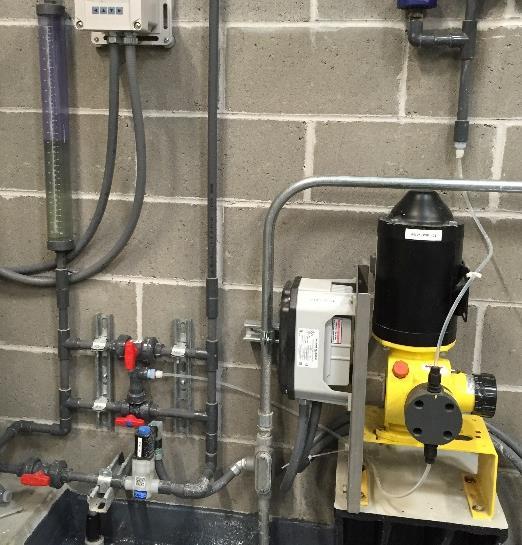
21 Treatment Equipment Preselection 21
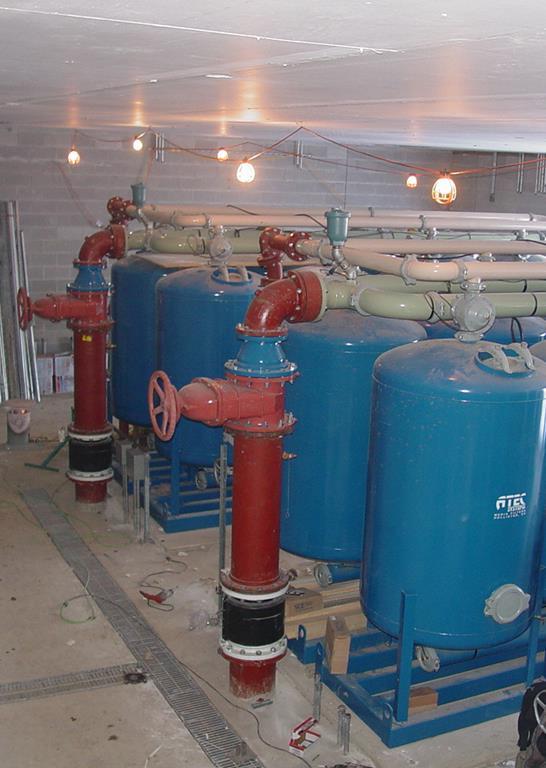
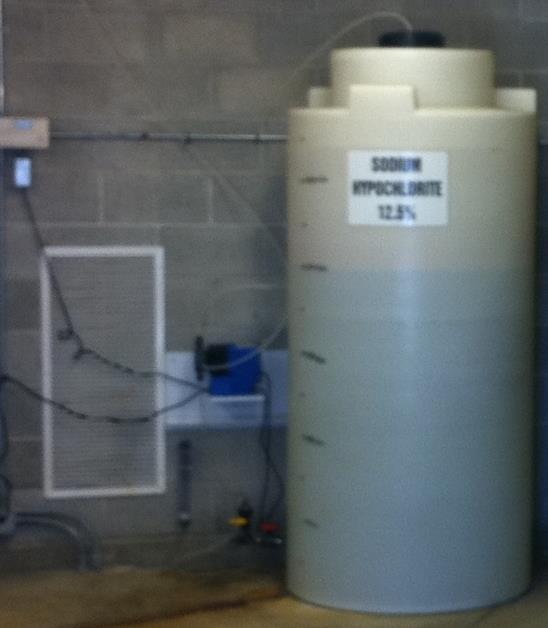
22 Facility Design New Treatment Room Uncovered Double Wall Bulk Hypochlorite Tank 22 Original Well Building
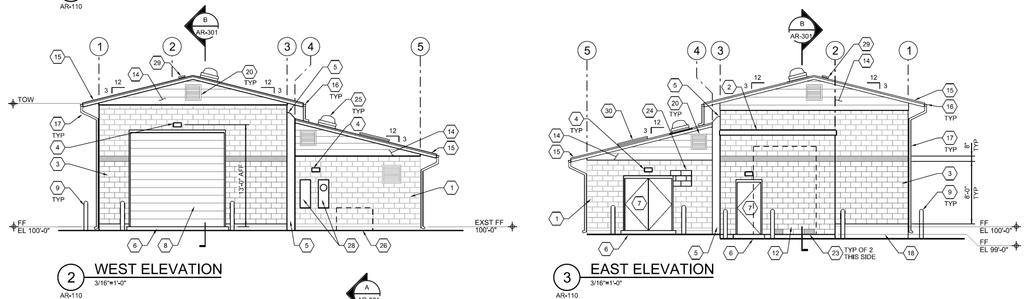
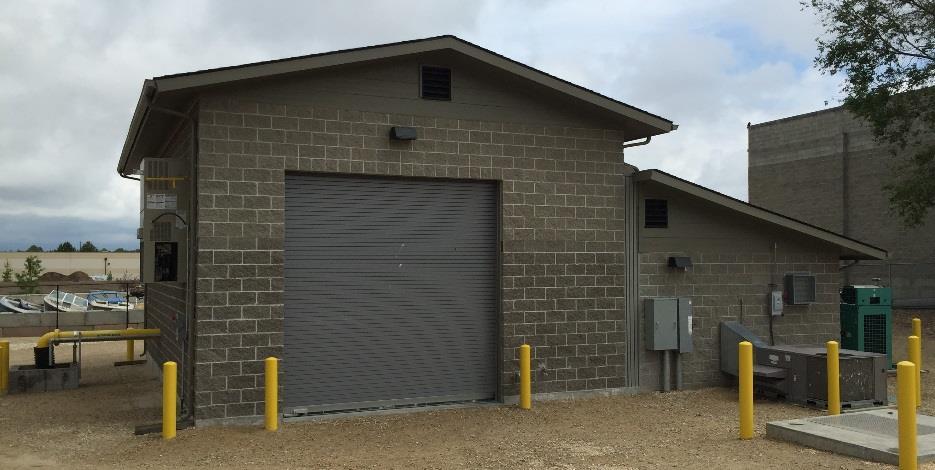
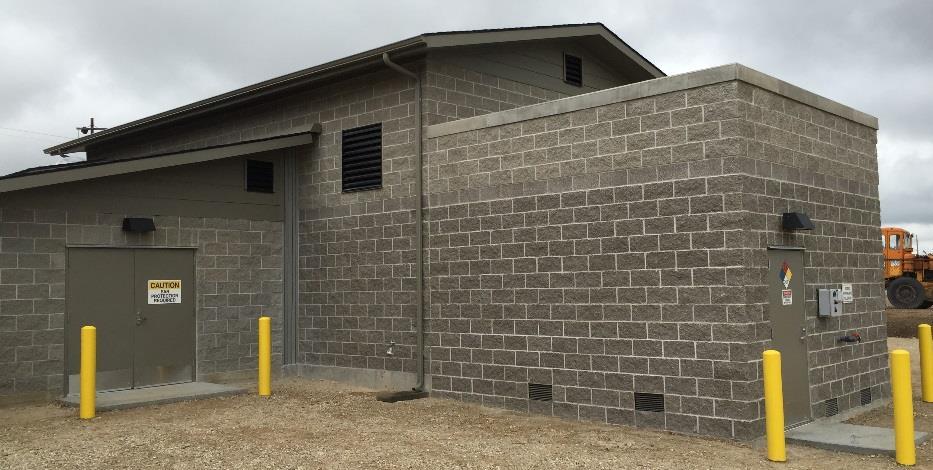
23 Integration with Existing Structure 23
24 Contractor Experience 24
25 Startup and Operations 25
26 Coordination During Startup Orchestrated Collaboration was Key 26

27 Operational Requirements During Testing 27

28 Operator Training 28
29 Operational Data Iron and Manganese Total Chlorine Free Chlorine Iron Manganese Treated Finished Raw Treated Raw Treated Finished Water Water Water Water Water Water Water mg/l mg/l mg/l mg/l Minimum Maximum Average Constituent Iron, mg/l Manganese, mg/l Historical Level SMCL

30 Operational Data Backwash Frequency Dependent upon flow rates through the filter based on system demands At full flow of 1,600 gpm, backwash cycles once every 24 hours Lower flows result in longer duration between backwash cyclesup to 3 days 30
31 Benefits Reduction in customer complaints Less water required to administer City s distribution system flushing program flushed 200 more hydrants with the same quantity of water Overall: Clearer, higher quality water 31
32 Key Lessons Learned 32

33 #1 Nice to have s are sometimes worth it 33

34 #2 Bubbles, Bubbles, Bubbles 34
35 #3 Loading Filter Media into the Vessel is No Simple Matter Confined space entry rigged a temporary hoist system from the ceiling Manufacturer recommended lifted media bag-by-bag How? Small diameter access hatches Conveyor was the trick 35

36 #4 Collaboration is Essential 36

37 #5 Flexibility is a Necessity 37
38 Thank You Perrin Robinson Clint Worthington - cworthington@meridiancity.org Enoch Nicholson Enoch.Nicholson@ch2m.com