Fsub. patersongroup. Phase II - Environmental Site Assessment Vacant Property 900 Albert Street Ottawa, Ontario. Prepared For
|
|
|
- Lindsey McKenzie
- 5 years ago
- Views:
Transcription

1 Geotechnical Engineering Fsub Environmental Engineering Hydrogeology Geological Engineering Materials Testing Building Science Phase II - Environmental Site Assessment Vacant Property 900 Albert Street Ottawa, Ontario Archaeological Services Prepared For Trinity Development Group Inc. Paterson Group Inc. Consulting Engineers 154 Colonnade Road South Ottawa (Nepean), Ontario Canada K2E 7J5 Tel: (613) Fax: (613) January 25, 2016
2 Table of Contents EXECUTIVE SUMMARY... iii 1.0 INTRODUCTION Site Description Property Ownership Current and Proposed Future Uses Applicable Site Condition Standard BACKGROUND INFORMATION Physical Setting Past Investigations SCOPE OF INVESTIGATION Overview of Site Investigation Media Investigated Phase I Conceptual Site Model Deviations from Sampling and Analysis Plan Impediments INVESTIGATION METHOD Subsurface Investigation Soil Sampling Field Screening Measurements Groundwater Monitoring Well Installation Field Measurement of Water Quality Parameters Groundwater Sampling Analytical Testing Residue Management Elevation Surveying Quality Assurance and Quality Control Measures REVIEW AND EVALUATION Geology Groundwater Elevations, Flow Direction, and Hydraulic Gradient Fine-Medium Soil Texture Soil - Field Screening Soil Quality Groundwater Quality Quality Assurance and Quality Control Results Phase II-ESA Conceptual Site Model CONCLUSIONS STATEMENT OF LIMITATIONS January 25, 2016 Page i
3 List of Figures Figure 1 - Key Plan Drawing PE Test Hole Location Plan Drawing PE Soil Analytical Testing Plan PHC (F 1 -F 4 )/BTEX Drawing PE Soil Analytical Testing Plan VOCs Drawing PE Soil Analytical Testing Plan PAHs Drawing PE Soil Analytical Testing Plan Metals Drawing PE Soil Analytical Testing Plan SAR/EC Drawing PE Groundwater Analytical Testing Plan PHC (F 1 -F 4 )/BTEX Drawing PE Groundwater Analytical Testing Plan VOCs Drawing PE Groundwater Analytical Testing Plan PAHs Drawing PE Groundwater Analytical Testing Plan Metals Drawing PE Groundwater Analytical Testing Plan Chloride Drawing PE Groundwater Contour Plan Overburden Monitoring Wells Drawing PE Groundwater Contour Plan Bedrock Monitoring Wells Drawing PE Cross-Section A-A Drawing PE Cross-Section B-B List of Appendices Appendix 1 Sampling and Analysis Plan Symbols and Terms Soil Profile and Test Data Sheets Laboratory Certificates of Analysis January 25, 2016 Page ii
4 EXECUTIVE SUMMARY Assessment A Phase II-Environmental Site Assessment (ESA) was conducted for the property at 900 Albert Street (formerly 801 Albert Street), Ottawa, Ontario. The Phase II-ESA consisted of the drilling of 13 boreholes, the excavation of 10 test pits, and the installation of 13 groundwater monitoring wells to assess soil and groundwater quality at the subject site. Soil samples were obtained from the boreholes and test pits and were screened using visual observations and vapour measurements. Site soils consist of fill over an intermittent layer of silty clay, underlain by glacial till and interbedded limestone and shaley limestone bedrock. Based on the screening results, various samples were selected for analysis of benzene, toluene, ethylbenzene, and xylenes (BTEX) and petroleum hydrocarbons, fractions 1 through 4 (PHCs F 1 -F 4 ), metals, volatile organic compounds (VOCs), polycyclic aromatic hydrocarbons (PAHs), electrical conductivity (EC) and sodium adsorption ratio (SAR). Based on the analytical results, some of the fill material at the subject site exceeds the MOECC Table 3 standards for metals, PAHs, and PHCs. Three groundwater samples and two duplicate samples were collected from the monitoring wells installed in BH1, BH2 and BH3 and analyzed for PHCs, VOCs, metals, and PAHs. All groundwater samples exceeded MOECC Table 3 standards for chloroform, and the concentration of 1,1,2-trichloroethane exceeded the MOECC Table 3 standard in the groundwater sample collected from the monitoring well installed in BH3. The presence of chloroform is interpreted to be the result of the use of municipally-treated water used during the drilling program. A second groundwater sampling event was subsequently completed in July Four groundwater samples were analyzed for VOCs. Although a general decrease in chloroform concentrations were noted, chloroform concentrations in the groundwater samples collected from the monitoring wells installed in BH2 and BH4 exceeded the MOECC Table 3 standards. All other VOC concentrations were in compliance with the Table 3 standards. A third groundwater sampling event was completed in December Nine groundwater samples were collected from the monitoring wells installed in BH9-15 through BH17-15 and were analyzed for a combination of PHC (F 1 -F 4 ), BTEX, VOC, PAH, metals, sodium and chloride parameters. The concentration of PHC (F 2 ) exceeded the MOECC Table 3 standard in the groundwater sample collected from the January 26, 2016 Page iii
5 monitoring well installed in BH Concentrations of chloroform exceeded the MOECC Table 3 Standards in the groundwater samples collected from the monitoring wells installed in BH11-15, BH14-15 and BH The presence of chloroform is interpreted to be the result of the use of municipally-treated water used during the drilling program. Recommendations Based on the above results, metals, PAH, and PHC concentrations in soil and PHC (F 2 ) concentrations in groundwater at the subject site exceed the applicable MOECC Table 3 standards. It is our understanding that the proposed development consists of three residential towers, a 10 storey office building and retail galleria with three levels of underground parking. It is our recommendation that an environmental site remediation program, consisting of the excavation and off-site disposal of all contaminated soil, be completed concurrently with site redevelopment. Soil It is recommended that impacted soil from the property be removed as part of the site redevelopment program. Any impacted soil removed from the site during redevelopment will require disposal at an approved waste disposal facility. It is recommended that Paterson personnel be present onsite during the soil excavation program to direct excavation activities in the areas where impacted material has been identified or is expected to exist. Also, confirmatory soil samples will be collected upon completion of the soil remediation program to ensure that the site meets the MOECC Table 3 standards. Groundwater Depending upon the volume of impacted groundwater encountered, several options may be available to treat the groundwater. The removal of impacted groundwater from the site by a licensed pumping contractor would be a feasible option for smaller volumes, while an on-site treatment system would likely be more economical for larger volumes over a longer period of time. An on-site treatment system would discharge to the City of Ottawa sewer system. Prior to discharging treated groundwater to the municipal sewer system, a Sanitary Sewer Agreement will be required from the City of Ottawa s Sewer Use Program. It is recommended that groundwater monitoring wells be installed upon completion of the site remediation program to ensure that the site meets the MOECC Table 3 standards. January 26, 2016 Page iv
6 1.0 INTRODUCTION At the request of Trinity Development Group, Paterson Group (Paterson) carried out a Phase II-Environmental Site Assessment (ESA) of the property at 900 Albert Street (formerly 801 Albert Street), in the City of Ottawa, Ontario. The purpose of this Phase II-ESA was to address concerns identified in the Phase I- ESA, including the historical presence of rail lines and associated buildings on the subject site. 1.1 Site Description Address: Legal Description: 900 Albert Street, Ottawa, Ontario. Parts 1 through 12, Registered Plan 4R-26480, in the City of Ottawa, Ontario. Property Identification Number: Location: The subject site is located on the south side of Albert Street, to the west of City Centre Avenue. The subject site is shown on Figure 1 - Key Plan following the body of this report. Latitude and Longitude: 45 24' 34" N, 75 43' 13" W. Configuration: Site Area: Irregular hectares (approximate). 1.2 Property Ownership The subject property is currently owned by Trinity Properties Investments Inc. Paterson was engaged to complete the Phase II-ESA at the subject site by Trinity Development Group. Paterson s contact at Trinity is Mr. Ryan Moore. Mr. Moore can be reached by telephone at (416) January 26, 2016 Page 1
7 1.3 Current and Proposed Future Uses The subject site was originally developed as a rail yard in the early 1900s. In the 1960s, the rail yard was decommissioned, and the site served as a snow dump until the 1990s. The site has been vacant and unused since that time. It is our understanding that the proposed development consists of three residential towers, a 10 storey office building and retail galleria with three levels of underground parking. 1.4 Applicable Site Condition Standard The site condition standards for the property were obtained from Table 3 of the document entitled Soil, Ground Water and Sediment Standards for Use Under Part XV.1 of the Environmental Protection Act, prepared by the Ontario Ministry of the Environment and Climate Change (MOECC), April The MOECC Table 3 standards are based on the following considerations: Coarse-grained soil conditions Non-potable groundwater conditions Residential land use Soil results were also compared to Table 1 of the document entitled Soil, Ground Water and Sediment Standards for Use Under Part XV.1 of the Environmental Protection Act, prepared by the Ontario Ministry of the Environment and Climate Change (MOECC), April The MOECC Table 1 background standards represent the criteria for any excess soil generated on-site to be considered as clean fill for off-site disposal, and are presented for comparison purposes. January 26, 2016 Page 2
8 2.0 BACKGROUND INFORMATION 2.1 Physical Setting The subject site is located on the south side of Albert Street, to the west of City Centre Avenue (formerly Champagne Avenue North). At the time of the Phase I ESA, the subject site was vacant and covered with trees, grass, and brush. A gravel access road was present along the south boundary of the subject site. Site drainage consisted primarily of infiltration. Sanitary and storm sewers are present on the subject site. An embankment sloping downward from Albert Street is present along the north boundary of the subject site, and the remainder of the subject site slopes gently downward in a westerly direction towards the O- Train tracks. 2.2 Past Investigations The following reports were available for review: Phase I-II-Environmental Site Assessment, Scott at Champagne Property, City of Ottawa, prepared by Oliver, Mangione, McCalla and Associates (A Division of Trow), dated February Phase II-Environmental Site Assessment, Vacant Commercial Property, Scott Street at Champagne Avenue North, Ottawa, Ontario, prepared by John D. Paterson and Associates Limited, dated May 8, Phase I-Environmental Site Assessment, Vacant Property, Inersection of Scott Street and Champagne Avenue, Ottawa, Ontario, prepared by Trow Associates Inc., dated December Consolidated Report, Geotechnical Investigation, Proposed Residential Development, 801 Albert Street, Ottawa, Ontario, prepared by Trow Associates Inc., dated February 10, Consolidated Report, Geotechnical Investigation (Draft), Proposed Commercial Development, 801 Albert Street, Ottawa, Ontario, prepared by EXP, dated March 2, Phase I-Environmental Site Assessment, Vacant Property, 801 Albert Street, Ottawa, Ontario, prepared by Paterson, dated June 23, January 26, 2016 Page 3
9 The above-noted reports, and additional information in Paterson s files, provide an outline of the investigative work done at the subject site and neighbouring properties. The 1998 and 2001 environmental reports identified concentrations of lead, boron, copper, and benzo[a]pyrene in site soils which exceeded the CCME and Ontario Ministry of the Environment Table B standards in effect at the time. Groundwater samples were in compliance with applicable standards. The locations of boreholes, monitoring wells, and test pits from previous investigations are shown on Drawing PE Test Hole Location Plan, appended to this report. Based on the results of the previous investigations, it is our opinion that fill material impacted with metals and PAHs is present on-site. January 26, 2016 Page 4
10 3.0 SCOPE OF INVESTIGATION 3.1 Overview of Site Investigation The initial 2014 subsurface investigation conducted as a component of this Phase II-ESA consisted of the drilling of 3 boreholes (BH1 through BH3) and the excavation of 10 test pits (TP1 through TP10) at the subject site. A fourth borehole (BH4) was subsequently drilled at the subject site in Boreholes were drilled through overburden soils to a maximum depth of m below ground surface. Groundwater monitoring wells were installed in all four of the boreholes. Test pits were excavated to the maximum practical reach of the backhoe given soil conditions. The 2015 supplemental subsurface investigation consisted of the drilling of nine boreholes (BH9-15 through BH17-15) and the installation of nine groundwater monitoring wells. 3.2 Media Investigated During the subsurface investigation, soil samples and groundwater samples were obtained and submitted for laboratory analysis. The rationale for sampling and analyzing these media is based on the Contaminants of Potential Concern identified in the Phase I ESA. Contaminants of concern for soil and groundwater are metals, polycyclic aromatic hydrocarbons (PAHs), benzene, toluene, ethylbenzene, and xylenes (BTEX), petroleum hydrocarbons, fractions 1 through 4 (PHCs F 1 -F 4 ), and volatile organic compounds (VOCs), as well as electrical conductivity (EC) and sodium adsorption ratio (SAR) in soil and sodium and chloride in groundwater. 3.3 Phase I Conceptual Site Model Geological and Hydrogeological Setting Based on information from the Geological Survey of Canada and subsurface investigations at the subject site, the site is located in an area of silty clay underlain by glacial till, with the bedrock surface encountered between 5 and 14 m below existing ground surface. Groundwater was encountered at depths ranging from 1.8 to 7.7 m below existing grade. Subsurface conditions encountered during the Phase II-ESA are discussed in greater detail in Subsection 5.1. January 26, 2016 Page 5
11 Contaminants of Potential Concern Based on the past and current uses of the subject site, the following Contaminants of Potential Concern (CPCs) have been identified: VOCs this suite of parameters includes chlorinated solvents (tetrachloroethylene, trichloroethylene, dichloroethylenes, and vinyl chloride) associated with de-greasing and dry cleaning. These parameters were selected as CPCs for the Phase I-ESA study area due to the presence of the Brown s Cleaners depot to the south of the subject site. Chlorinated solvents may be present in the soil matrix as well as in the dissolved phase in the groundwater system. BTEX this suite of parameters includes benzene, toluene, ethylbenzene, and xylenes (BTEX), associated with gasoline. These parameters were selected as CPCs for the Phase I-ESA study area based on the historical presence of the oil house on the subject site as identified by the Fire Insurance Plans. BTEX may be present in the soil matrix as well as in the dissolved phase in the groundwater system. Metals this suite of parameters encompasses various metals for which MOECC standards exist. Metals may be present in the soil matrix or dissolved in site groundwater. Metals were selected as CPCs for the Phase I- ESA property based on the historical presence of the rail lines on the subject site. PHCs F 1 -F 4 this suite of parameters encompasses gasoline (Fraction 1), diesel and fuel oil (Fraction 2), and heavy oils (Fractions 3 and 4). PHCs F 1 - F 4 were selected as CPCs for the Phase I-ESA property based on the historical presence of the oil house identified on the subject site by the FIPs. Gasoline and diesel are commonly used motor vehicle fuels, and dieselfraction hydrocarbons were commonly used as heating oil. Heavy oils may be present in the form of lubricants and transmission or hydraulic fluids. PHCs may be present in the soil matrix, sorbed to soil particles, as well as in free or dissolved phase in the groundwater system. PHCs are generally considered to be LNAPLs light non-aqueous phase liquids, indicating that when present in sufficient concentrations above the solubility limit, they will partition into a separate phase above the water table, due to their lower density. January 26, 2016 Page 6
12 PAHs this suite of parameters encompasses various complex hydrocarbons, commonly associated with coal and/or combustion. PAHs were selected as a CPC for the site based on the historical presence of the rail lines on the subject site. PAHs may be present in the soil matrix or dissolved in site groundwater. EC, SAR, sodium and chloride were selected as a CPC for the site based on the historical use of the subject site as a snow dump. The mechanisms of contaminant transport within the site soils include physical transportation and leaching. Physical transportation includes any intentional or unintentional movement or distribution of soil by physical means. Contamination arising from localized spills or runoff from the washing area on-site may be physically transported by vehicle movement or site grading. Leaching may occur in areas where the ground surface consists of grass or gravel; precipitation infiltrating in these areas may transport surficial contaminants into lower strata. As such, this mechanism represents a potential pathway for soil contaminants to migrate into site groundwater. The mechanisms of contaminant transport within the groundwater system include advection, dispersion, and diffusion. Advection and dispersion will be the dominant mechanisms of contaminant transport in soils with higher hydraulic conductivities, such as sands, gravels, silts, and some glacial till soils, whereas diffusion will dominate in soils with lower hydraulic conductivity, such as clays. Buildings and Structures There are currently no buildings or structures present at the subject site. Water Bodies There are no water bodies on the subject site or within the Phase I study area. The closest water body is the Ottawa River, located approximately 320 m to the west of the site. Areas of Natural Significance No areas of natural significance were identified on the site or in the Phase I study area. January 26, 2016 Page 7
13 Drinking Water Wells A search of the MOECC water well database returned 62 water well records within the Phase I-ESA study area, of which two are drinking water wells and the remainder are monitoring wells. Based on the availability of municipal water within the Phase I-ESA study area, these drinking water wells are no longer considered to be in use. Neighbouring Land Use Neighbouring land use in the Phase I-ESA study area is currently commercial and residential. Land use is shown on Drawing PE Surrounding Land Use Plan in the Phase I-ESA. Potentially Contaminating Activities and Areas of Potential Environmental Concern Potentially contaminating activities at the Phase I-ESA property include the historical presence of rail lines, an oil house and a snow dump on the subject site. Additional Potentially Contaminating Activities were present within the Phase I-ESA study area. Based on their separation distance and/or their inferred down-gradient or cross-gradient location with respect to the subject site and previous investigations, the majority of the off-site PCAs are not considered to represent Areas of Potential Environmental Concern with respect to the subject site. The exception is the Brown s Cleaners depot to the south of the subject site, which is considered to be an APEC with respect to the subject site. Assessment of Uncertainty and/or Absence of Information The information available for review as part of the preparation of this Phase I- ESA is considered to be sufficient to conclude that Potentially Contaminating Activities are present at the subject site. The presence of potentially contaminating activities was confirmed by a variety of independent sources. As such, the conclusions of this report are not affected by uncertainty which may be present with respect to the individual sources. 3.4 Deviations from Sampling and Analysis Plan The Sampling and Analysis Plan for this project is included in Appendix 1 of this report. Trip blanks were not submitted during VOC sampling events. January 26, 2016 Page 8
14 3.5 Impediments The borehole locations were constrained by the presence of underground services at the subject site, however adequate site coverage was obtained. No other physical impediments or denial of access were encountered during the Phase II-Environmental Site Assessment. January 26, 2016 Page 9
15 4.0 INVESTIGATION METHOD 4.1 Subsurface Investigation The initial 2014 subsurface investigation was conducted between June 4 and 11, 2014, and consisted of drilling 3 boreholes and the excavation of 10 test pits on the subject site. A fourth borehole was drilled on July 24, A total of 9 additional boreholes were drilled between November 13 and 18, The boreholes and test pits were placed to provide general site coverage for environmental and geotechnical purposes and to address the Areas of Potential Environmental Concern identified in the Phase I-ESA Conceptual Site Model. The boreholes were drilled using a truck-mounted CME 55 power auger drill rig. The drilling contractor was George Downing Estate Drilling of Hawkesbury, Ontario. The excavation contractor was George W. Drummond of Ottawa, Ontario. Drilling and test pit excavation occurred under full-time supervision of Paterson personnel. Borehole locations are shown on Drawing PE Test Hole Location Plan, appended to this report. 4.2 Soil Sampling A total of 141 soil samples were obtained from the boreholes and test pits by means of split spoon sampling, the sampling of shallow soils directly from auger flights, and grab sampling from test pits. Split spoon samples were taken at approximate 0.76 to 1.52 m intervals. The depths at which split spoon, auger flight, and grab samples were obtained from the boreholes and test pits are shown as SS, AU, and G respectively on the Soil Profile and Test Data Sheets, appended to this report. Upon refusal of the augers, the boreholes were advanced into bedrock using a diamond coring system. Rock core samples were recovered, and are shown as RC on the Soil Profile and Test Data Sheets. Site soils consist of crushed stone and silty sand fill over an intermittent layer of silty clay, underlain by glacial till and interbedded limestone and shale bedrock. The fill material consists of silty sand with crushed stone, metal and wood debris, coal, and ash. The glacial till material consists of a silt, sand and clay matrix with gravel, cobbles, and boulders. Bedrock was encountered at depths varying from 5.6 to 10.7 m below existing grade. Based on available mapping, bedrock at the subject site is interpreted to be interbedded limestone and black limestone of the Verulam formation. January 26, 2016 Page 10
16 4.3 Field Screening Measurements All soil samples collected were submitted to a preliminary screening procedure, which included visual screening for colour and evidence of metals, as well as screening with an RKI Eagle combustible gas detector and/or a MiniRae photoionization detector (PID). The detection limit of the RKI Eagle is 5 ppm, with a precision of +/- 5 ppm. The detection limit of the PID is 0.1 ppm, with a precision of +/- 0.1 ppm The soil vapours were measured by inserting the analyzer probe into the nominal headspace above the soil sample. Samples were then agitated and the peak readings recorded. Vapour readings varied from 0 to 250 ppm. Vapour readings are noted on the Soil Profile and Test Data Sheets in Appendix 1. Soil samples were selected for analysis based on visual appearance, location, and vapour readings. 4.4 Groundwater Monitoring Well Installation Thirteen groundwater monitoring wells were installed during the drilling program by George Downing Estate Drilling of Hawkesbury, Ontario, under full-time supervision by Paterson personnel. The monitoring wells consisted of 51 mm or 32 mm diameter Schedule 40 threaded PVC risers and screens. A sand pack consisting of silica sand was placed around the screen, and a bentonite seal was placed above the screen to minimize cross-contamination. Monitoring well construction details are provided on the Soil Profile and Test Data Sheets in Appendix 1. A summary of monitoring well construction details is provided below in Table 1. Table 1: Monitoring Well Construction Details Well ID Ground Surface Elevation Total Depth (m BGS) Screened Interval (m BGS) Sand Pack (m BGS) Bentonite Seal (m BGS) Casing Type BH None BH None BH None BH None BH None BH None BH None BH None BH None BH None BH None January 26, 2016 Page 11
17 Table 1: Monitoring Well Construction Details Well ID Ground Surface Elevation Total Depth (m BGS) Screened Interval (m BGS) Sand Pack (m BGS) Bentonite Seal (m BGS) Casing Type BH None BH None 4.5 Field Measurement of Water Quality Parameters During the June 2014 and December 2015 sampling events, water quality parameters were measured in the field using a multi-parameter analyzer. Parameters measured in the field included temperature, ph, electrical conductivity, and total dissolved solids. Field parameters were measured after each purged well volume. Wells were purged prior to sampling until at least three well volumes had been removed or the field parameters were relatively stable. Stabilized field parameter values are summarized below in Table 2. Table 2: Field Measurement of Water Quality Parameters Parameter Temperature ( C) ph Electrical Conductivity (µs/cm) Total Dissolved Solids (ppm) June 16, 2014 BH BH BH December 1, 2015 BH BH BH BH BH BH BH Groundwater Sampling Groundwater sampling protocols were followed using the MOECC document entitled Guidance on Sampling and Analytical Methods for Use at Contaminated Sites in Ontario, dated May Groundwater samples were obtained from each monitoring well, using dedicated sampling equipment. Standing water was purged from each well prior to sampling. Samples were stored in coolers to January 26, 2016 Page 12
18 PAHs VOCs Metals EC/SAR reduce analyte volatilization during transportation. Details of our standard operating procedure for groundwater sampling are provided in the Sampling and Analysis Plan in Appendix Analytical Testing Based on the guidelines outlined in the Sampling and Analysis Plan appended to this report, the following groundwater and soil samples were submitted for analysis: Table 3: Soil Samples Submitted ( ) Parameters Analyzed Sample ID Sample Depth; Stratigraphic Unit BTEX & PHCs F1-F4 Rationale BH1-AU m-0.61 m; fill X BH1-SS m-4.42 m; fill X X BH3-AU m-0.61 m; fill X X BH3-SS m-3.66 m; fill X TP1-G m-2.74 m; fill X X TP2-G m-3.05 m; fill X X TP3-G m-0.91 m; fill X X TP4-G m-1.83 m; fill X TP4-G m-2.44 m; till X TP6-G m-1.83 m; silty sand X X TP9-G m-1.22 m; fill X X TP10-G m-2.08 m; fill X TP10-G m-3.05 m; fill X TP8-G m; fill X X TP8-G4 BH9-15- SS m-2.44 m; silty clay 2.29 m-2.90 m; fill X X X X X Assess quality of fill; general site coverage Assess vertical extent of contamination Assess quality of fill; general site coverage Assess vertical extent of contamination Assess quality of fill; general site coverage Assess vertical extent of contamination Assess quality of fill; general site coverage Assess vertical extent of contamination Visual appearance and horizontal delineation January 26, 2016 Page 13
19 PAHs VOCs Metals EC/SAR Table 3: Soil Samples Submitted ( ) Parameters Analyzed Sample ID Sample Depth; Stratigraphic Unit BTEX & PHCs F1-F4 Rationale BH SS5 BH SS2 BH AU1 BH SS2 BH SS4 BH AU1 BH SS4 BH AU1 BH SS2 BH SS5 BH17-15 AU1 BH SS m-3.66 m; fill 0.76 m-0.97 m; fill m ; fill X 0.76 m-1.37 m; fill 2.29 m-2.90 m; fill 0.0 m m; fill 2.29 m-2.90 m; fill 0.0 m m; fill 0.76 m-1.37 m; fill 3.05 m-3.23 m; fill 0.0 m 0.61 m; fill 1.52 m-1.90 m; fill X X X X X X X X X X X X Visual appearance and horizontal delineation Visual appearance and horizontal delineation Assess quality of fill in area of former snow dump Visual appearance and horizontal delineation Visual appearance and horizontal delineation Assess quality of fill in area of former snow dump Highest vapour reading in borehole and odour Assess quality of fill in area of former snow dump Visual appearance and horizontal delineation Highest vapour reading in borehole and odour Assess quality of fill in area of former snow dump Visual appearance and horizontal delineation January 26, 2016 Page 14
20 BTEX & PHCs PAHs VOCs Metals Sodium Chloride Table 4: Groundwater Samples Submitted ( ) Sample ID Sample Depth; Stratigraphic Unit Parameters Analyzed F1-F4 Rationale BH1-GW ; X X X X General assessment of BH2-GW1 limestone ; X X X X groundwater quality at the subject site. limestone BH3-GW ; limestone X X X X BH1-GW ; X Re-sampling to confirm limestone VOC concentrations BH2-GW ; X limestone BH3-GW ; X limestone BH4-GW ; X General assessment of limestone groundwater quality BH ; fill, X X X GW1 BH ; X X GW1 limestone BH ; X GW1 limestone BH GW ; fill X X X BH GW ; fill X X X BH GW ; till X X X BH GW ; limestone X X BH GW ;fill/ silty clay X X BH GW ; fill X X Paracel Laboratories (Paracel), of Ottawa, Ontario, performed the laboratory analysis on the samples submitted for analytical testing. Paracel is a member of the Standards Council of Canada/Canadian Association for Laboratory Accreditation (SCC/CALA). Paracel is accredited and certified by SCC/CALA for specific tests registered with the association. January 26, 2016 Page 15
21 4.8 Residue Management Soil cuttings, purge water and fluids from equipment cleaning were retained onsite. 4.9 Elevation Surveying Borehole locations (BH1 through BH4) and test pit locations (TP1 through TP10) were surveyed using a laser level. Elevations were surveyed relative to a manhole located on the northwest portion of the site. Based on a topographical survey of the subject site provided by Stantec, the geodetic elevation of the catch basin is 56.3 m. The location of the site benchmark is shown on Drawing PE Test Hole Location Plan. The borehole locations and ground surface elevations from the 2015 investigation (BH9-15 through BH17-15) were provided by Stantec Geomatics Limited Quality Assurance and Quality Control Measures A summary of quality assurance and quality control (QA/QC) measures, including sampling containers, preservation, labelling, handling, and custody, equipment cleaning procedures, and field quality control measurements is provided in the Sampling and Analysis Plan in Appendix 1. January 26, 2016 Page 16
22 5.0 REVIEW AND EVALUATION 5.1 Geology Site geology details are provided in the Soil Profile and Test Data Sheets provided in Appendix 1. Site soils consist of fill overlying an intermittent silty clay layer, underlain by glacial till and interbedded black limestone and limestone bedrock. The fill material consists of silty sand with crushed stone, metal and wood debris, coal, and ash. The glacial till material consists of a silt, sand and clay matrix with gravel, cobbles, and boulders. Bedrock was encountered at the site at depths varying from 5.6 to 10.7 m below existing grade. Groundwater was encountered in the lower silty sand layer and glacial till layer at depths ranging from 1.8 to 7.7 m below existing grade. 5.2 Groundwater Elevations, Flow Direction, and Hydraulic Gradient Groundwater levels were measured using an electronic water level meter. Groundwater levels are summarized below in Table 5. All elevations are geodetic. Table 5: Groundwater Level Measurements Ground Borehole Location Surface Elevation (m) Water Level Depth (m below grade) Water Level Elevation (m ASL) Date of Measurement BH June 16, July 31, 2014 BH June 16, July 31, 2014 BH June 16, July 31, 2014 BH July 31, 2014 BH December 1, 2015 BH December 1, 2015 BH December 1, 2015 BH December 1, 2015 BH December 1, 2015 BH December 1, 2015 BH December 1, 2015 BH December 1, 2015 BH December 1, 2015 January 26, 2016 Page 17
23 Based on the groundwater elevations from the December 2015 monitoring event, groundwater contour mapping was completed for the overburden and bedrock strata. Groundwater contours are shown on Drawing PE Groundwater Contour Plan Overburden Monitoring Wells and Drawing PE Groundwater Contour Plan Bedrock Monitoring Wells. Based on the contour mapping, groundwater flow in the bedrock at the subject site appears to be in a northern direction. A horizontal hydraulic gradient of approximately 0.07 m/m was calculated. The groundwater flow in the overburden at the subject site appears to be in a southern direction, with a horizontal hydraulic gradient of approximately m/m, in our opinion, groundwater flow at the subject site may be influenced by site services. It is noted that water levels fluctuate with seasonal variations. A sheen was observed in monitoring wells BH13-15 and BH16-15 at the subject site during the December 1, 2015 sampling event. 5.3 Fine-Medium Soil Texture Based on observed soil conditions, it is our opinion that fine- to medium-grained soil standards are not applicable at the subject site. Coarse-grained soil standards have been used for the subject site. Grain size analysis was not completed. 5.4 Soil - Field Screening Field screening of the soil samples collected during drilling resulted in soil vapour readings of 0 to 250 ppm. Field screening results of each individual soil sample are provided on the Soil Profile and Test Data Sheets appended to this report. Based on visual observations, soil samples from the fill unit were identified as having the potential for metals and/or PAH contamination. 5.5 Soil Quality Two soil samples from the 2014 subsurface investigation were submitted for analysis of VOCs. The results of the analytical testing are presented below. The laboratory certificates of analysis are provided in Appendix 1. January 26, 2016 Page 18
24 Table 6: Analytical Test Results Soil VOCs Parameter MDL (μg/g) Soil Samples (μg/g) June 4-11, 2014 BH1-SS6 TP8-G4 MOECC Table 3 Residential Coarse MOECC Table 1 Residential Acetone 0.50 nd nd Benzene 0.02 nd nd Bromodichloromethane 0.05 nd nd Bromoform 0.05 nd nd Bromomethane 0.05 nd nd Carbon Tetrachloride 0.05 nd nd Chlorobenzene 0.05 nd nd Chloroform 0.05 nd nd Dibromochloromethane 0.05 nd nd Dichlorodifluoromethane 0.05 nd nd ,2-Dichlorobenzene 0.05 nd nd ,3-Dichlorobenzene 0.05 nd nd ,4-Dichlorobenzene 0.05 nd nd ,1-Dichloroethane 0.05 nd nd ,2-Dichloroethane 0.05 nd nd ,1-Dichloroethylene 0.05 nd nd cis-1,2-dichloroethylene 0.05 nd nd trans-1,2-dichloroethylene 0.05 nd nd ,2-Dichloropropane 0.05 nd nd ,3-Dichloropropylene, total 0.05 nd nd Ethylbenzene 0.05 nd nd Hexane 0.05 nd nd Methyl Ethyl Ketone 0.50 nd nd Methyl Isobutyl Ketone 0.50 nd nd Methyl tert-butyl ether 0.05 nd nd Methylene Chloride 0.05 nd nd Styrene 0.05 nd nd ,1,1,2-Tetrachloroethane 0.05 nd nd ,1,2,2-Tetrachloroethane 0.05 nd nd Tetrachloroethylene 0.05 nd nd Toluene 0.05 nd nd ,2,4-Trichlorobenzene 0.05 nd nd ,1,1-Trichloroethane 0.05 nd nd ,1,2-Trichloroethane 0.05 nd nd Trichloroethylene 0.05 nd nd Trichlrofluoromethane 0.05 nd nd Vinyl Chloride 0.02 nd nd Xylenes, total 0.05 nd nd Notes: MDL Method Detection Limit Nd not detected above the MDL N/V no value provided by the MOECC Bold Value exceeds MOECC Table 3 Standard Bold - Value exceeds MOECC Table 1 Standard January 26, 2016 Page 19
25 No VOC concentrations were detected above laboratory detection limits. The test results are in compliance with the selected MOECC Table 3 and Table 1 standards. Nine soil samples from the 2014 subsurface investigation and one soil sample from the 2015 subsurface investigation were submitted for analysis of metals. The results of the analytical testing are presented below. The laboratory certificates of analysis are provided in Appendix 1. Table 7: Analytical Test Results Soil Metals Parameter MDL (μg/g) Soil Samples (μg/g) June 4 to 11, 2014 TP1-G3 TP2-G5 TP3-G1 MOECC Table 3 Residential Coarse MOECC Table 1 Residential Antimony 1 nd nd nd Arsenic Barium Beryllium 1 nd nd nd Boron Cadmium 0.5 nd nd nd Chromium Chromium (VI) 0.2 nd nd nd Cobalt Copper Lead Mercury nd Molybdenum 1 nd 1.2 nd Nickel Selenium 1 nd nd nd Silver 0.5 nd nd nd Thallium 1 nd nd nd 1 1 Uranium 1 nd nd nd Vanadium Zinc Notes: MDL Method Detection Limit Nd not detected above the MDL N/V no value provided by the MOECC Bold - Value exceeds MOECC Table 1 Standard Bold Value exceeds MOECC Table 3 Standard January 26, 2016 Page 20
26 Table 7 (continued): Analytical Test Results Soil Metals Parameter MDL (μg/g) Soil Samples (μg/g) June 4 to 11, 2014 TP6-G2 TP9-G2 TP10-G2 MOECC Table 3 Residential Coarse MOECC Table 1 Residential Antimony 1 nd 3.6 nd Arsenic Barium Beryllium 1 nd nd nd Boron Cadmium 0.5 nd 2.0 nd Chromium Chromium (VI) 0.2 nd 0.5 nd Cobalt Copper Lead Mercury 0.1 nd nd Molybdenum 1 nd 2.5 nd Nickel Selenium 1 nd 41.4 nd Silver 0.5 nd nd nd Thallium 1 nd nd nd 1 1 Uranium 1 nd nd nd Vanadium Zinc Notes: MDL Method Detection Limit Nd not detected above the MDL N/V no value provided by the MOECC Bold - Value exceeds MOECC Table 1 Standard Bold Value exceeds MOECC Table 3 Standard January 26, 2016 Page 21
27 Table 7 (continued): Analytical Test Results Soil Metals Parameter Soil Samples (μg/g) MOECC MDL TP10- TP8- TP8- BH MOECC Table 3 Table 1 (μg/g) G3 G1 G4 SS4 Residential November Residential June 4 to 11, 2014 Coarse 17, 2015 Antimony 1 nd nd nd nd Arsenic Barium Beryllium 1 nd nd nd nd Boron Cadmium 0.5 nd 0.6 nd Chromium Chromium (VI) 0.2 nd nd nd nd Cobalt Copper Lead Mercury 0.1 nd 0.2 nd nd Molybdenum 1 nd 2.4 nd Nickel Selenium 1 nd nd nd nd Silver 0.5 nd nd nd nd Thallium 1 nd nd nd nd 1 1 Uranium 1 nd nd nd nd Vanadium Zinc Notes: MDL Method Detection Limit Nd not detected above the MDL N/V no value provided by the MOECC Bold - Value exceeds MOECC Table 1 Standard Bold Value exceeds MOECC Table 3 Standard The concentration of mercury exceeds the MOECC Table 3 Standards at sample location TP2-G5. The concentrations of arsenic, cadmium, selenium, and vanadium exceed the MOECC Table 3 Standards at sample location TP9-G2. The concentration of lead exceeds the MOECC Table 3 Standards at sample locations TP8-G1 and BH13-15-SS4. Additional metal parameters exceed the MOECC Table 1 Standards. Eleven soil samples from the 2014 investigation and seven soil samples from the 2015 investigation were submitted for analysis of PAHs. The results of the analytical testing are presented below. The laboratory certificates of analysis are provided in Appendix 1. January 26, 2016 Page 22
28 Table 8: Analytical Test Results Soil PAHs Parameter Soil Samples (μg/g) MOECC MDL June 4 to 11, 2014 MOECC Table 3 (μg/g) Table 1 BH1- BH3- TP1-G3 Residential Residential AU1 AU1 Coarse Acenaphthene Acenaphthylene Anthracene Benzo[a]anthracene Benzo[a]pyrene Benzo[b]fluoranthene Benzo[g,h,i]perylene Benzo[k]fluoranthene Chrysene Dibenzo[a,h]anthracene Fluoranthene Fluorene Indeno[1,2,3-cd]pyrene Methylnaphthalene (1&2) Naphthalene Phenanthrene Pyrene Notes: MDL Method Detection Limit Nd not detected above the MDL N/V no value provided by the MOECC Bold - Value exceeds MOECC Table 1 Standard Bold Value exceeds MOECC Table 3 Standard January 26, 2016 Page 23
29 Table 8 (continued): Analytical Test Results Soil PAHs Parameter MDL (μg/g) Soil Samples (μg/g) June 4 to 11, 2014 TP2-G5 TP3-G1 TP4-G1 MOECC Table 3 Residential Coarse MOECC Table 1 Residential Acenaphthene Acenaphthylene Anthracene Benzo[a]anthracene Benzo[a]pyrene Benzo[b]fluoranthene Benzo[g,h,i]perylene Benzo[k]fluoranthene Chrysene Dibenzo[a,h]anthracene Fluoranthene Fluorene nd Indeno[1,2,3-cd]pyrene Methylnaphthalene (1&2) Naphthalene Phenanthrene Pyrene Notes: MDL Method Detection Limit Nd not detected above the MDL N/V no value provided by the MOECC Bold - Value exceeds MOECC Table 1 Standard Bold Value exceeds MOECC Table 3 Standard January 26, 2016 Page 24
30 Table 8 (continued): Analytical Test Results Soil PAHs Parameter MDL (μg/g) Soil Samples (μg/g) June 4 to 11, 2014 TP4-G2 TP6-G2 TP9-G2 MOECC Table 3 Residential Coarse MOECC Table 1 Residential Acenaphthene 0.02 nd nd nd Acenaphthylene 0.02 nd nd nd Anthracene 0.02 nd nd nd Benzo[a]anthracene nd nd Benzo[a]pyrene 0.02 nd nd nd Benzo[b]fluoranthene nd nd Benzo[g,h,i]perylene 0.02 nd nd nd Benzo[k]fluoranthene nd nd Chrysene nd nd Dibenzo[a,h]anthracene 0.02 nd nd nd Fluoranthene nd nd Fluorene 0.02 nd nd nd Indeno[1,2,3-cd]pyrene 0.02 nd nd nd Methylnaphthalene (1&2) 0.04 nd nd nd Naphthalene nd Phenanthrene nd nd Pyrene nd nd 78 1 Notes: MDL Method Detection Limit Nd not detected above the MDL N/V no value provided by the MOECC Bold - Value exceeds MOECC Table 1 Standard Bold Value exceeds MOECC Table 3 Standard January 26, 2016 Page 25
31 Table 8 (continued): Analytical Test Results Soil PAHs Parameter MDL (μg/g) Soil Samples (μg/g) June 4 to 11, 2014 TP8-G1 TP8-G4 MOECC Table 3 Residential Coarse MOECC Table 1 Residential Acenaphthene nd Acenaphthylene nd Anthracene nd Benzo[a]anthracene nd Benzo[a]pyrene nd Benzo[b]fluoranthene nd Benzo[g,h,i]perylene nd Benzo[k]fluoranthene nd Chrysene nd Dibenzo[a,h]anthracene nd Fluoranthene nd Fluorene nd Indeno[1,2,3-cd]pyrene nd Methylnaphthalene (1&2) nd Naphthalene nd Phenanthrene nd Pyrene nd 78 1 Notes: MDL Method Detection Limit Nd not detected above the MDL N/V no value provided by the MOECC Bold - Value exceeds MOECC Table 1 Standard Bold Value exceeds MOECC Table 3 Standard January 26, 2016 Page 26
32 Table 8 (continued): Analytical Test Results Soil PAHs Parameter Soil Samples (μg/g) BH9-15- BH10- BH MOECC MDL MOECC SS4 15-SS5 SS2 Table 3 (μg/g) Table 1 Residential November 13, November Residential Coarse , 2016 Acenaphthene nd nd Acenaphthylene nd Anthracene nd Benzo[a]anthracene Benzo[a]pyrene Benzo[b]fluoranthene Benzo[g,h,i]perylene Benzo[k]fluoranthene Chrysene Dibenzo[a,h]anthracene nd Fluoranthene Fluorene nd Indeno[1,2,3-cd]pyrene Methylnaphthalene (1&2) nd Naphthalene Phenanthrene Pyrene Notes: MDL Method Detection Limit Nd not detected above the MDL N/V no value provided by the MOECC Bold - Value exceeds MOECC Table 1 Standard Bold Value exceeds MOECC Table 3 Standard January 26, 2016 Page 27
33 Table 8 (continued): Analytical Test Results Soil PAHs Parameter MDL (μg/g) BH12-15-SS2 Soil Samples (μg/g) BH13-15-SS4 BH15-15-SS2 BH17-15-SS3 MOECC Table 3 Residential Coarse MOECC Table 1 Residential Nov 16, Nov 18, Nov 17, Acenaphthene nd 0.36 nd Acenaphthylene nd Anthracene nd Benzo[a]anthracene Benzo[a]pyrene Benzo[b]fluoranthene Benzo[g,h,i]perylene Benzo[k]fluoranthene Chrysene Dibenzo[a,h]anthracene nd Fluoranthene Fluorene nd Indeno[1,2,3-cd]pyrene Methylnaphthalene (1&2) Naphthalene Phenanthrene Pyrene Notes: MDL Method Detection Limit Nd not detected above the MDL N/V no value provided by the MOECC Bold - Value exceeds MOECC Table 1 standard Bold Value exceeds MOECC Table 3 standard The concentrations of various PAH parameters at BH1-AU1, TP1-G3, TP2-G5, TP4-G1, TP8-G1, BH9-15-SS4, BH1015-SS5, BH12-15-SS2 and BH15-15-SS2 exceeded the applicable MOECC Table 3 standards. Additional PAH parameters at these locations and BH13-15-SS4 exceeded MOECC Table 1 standards. PAH concentrations at BH3-AU1, TP3-G1, TP4-G2, TP6-G2, TP8-G4, TP9-G2, BH11-15-SS2 and BH17-15-SS3 are in compliance with MOECC Table 3 and Table 1 standards. Four soil samples from the 2014 investigation and two soil samples from the 2015 investigation were submitted for analysis of BTEX and PHCs. The results of the analytical testing are presented below. The laboratory certificates of analysis are provided in Appendix 1. January 26, 2016 Page 28
34 Table 9: Analytical Test Results Soil BTEX/PHCs Parameter Soil Samples (μg/g) MOECC MDL June 4 to 11, 2014 Table 3 (μg/g) BH1- BH3- BH3- TP8-G4 Residential SS6 AU1 SS5 Coarse Benzene 0.02 nd nd nd nd Ethylbenzene 0.05 nd nd nd nd Toluene 0.05 nd nd nd nd Xylenes 0.05 nd nd nd nd PHCs F1 7 nd nd nd nd PHCs F2 4 nd nd nd nd PHCs F3 8 nd nd PHCs F4 6 nd nd 2, Notes: MDL Method Detection Limit Nd not detected above the MDL Bold - Value exceeds MOECC Table 1 Standard Bold Value exceeds MOECC Table 3 Standard MOECC Table 1 Residential Table 9 (continued): Analytical Test Results Soil BTEX/PHCs Parameter MDL (μg/g) Soil Samples (μg/g) November 18, 2015 BH14-15-SS4 BH16-15-SS5 MOECC Table 3 Residential Coarse MOECC Table 1 Residential Benzene 0.02 nd nd Ethylbenzene 0.05 nd nd Toluene 0.05 nd nd Xylenes 0.05 nd nd PHCs F PHCs F PHCs F PHCs F , Notes: MDL Method Detection Limit Nd not detected above the MDL Bold - Value exceeds MOECC Table 1 Standard Bold Value exceeds MOECC Table 3 Standard The concentrations of PHC (F 2 ) exceeded the MOECC Table 3 standards at BH14-15-SS4 and BH16-15-SS5. Additional PHC parameters at BH16-15-SS5 exceed the MOECC Table 1 standards. January 26, 2016 Page 29
35 Table 10: Analytical Test Results Soil EC/SAR Soil Samples MOECC Table 3 Residential Coarse MOECC Table 1 Residential Parameter MDL BH12- BH14- BH15- BH17-15-AU1 15-AU1 15-AU1 15-AU1 Nov 16, Nov 18, Nov 17, Nov 18, SAR EC(µS/cm) Notes: MDL Method Detection Limit Nd not detected above the MDL Bold - Value exceeds MOECC Table 1 Standard Bold Value exceeds MOECC Table 3 Standard SAR and EC results are in compliance with the MOECC Table 1 and Table 3 standards. Sample locations and analytical results are shown on Drawings PE through PE and PE through PE Based on the analytical results, no contaminants were identified as being byproducts of chemical or biological transformations which have or may have occurred. January 26, 2016 Page 30
36 The maximum concentrations of analyzed parameters in the soil at the site are summarized below in Table 11. Table 11: Maximum Concentrations Soil Parameter Maximum Borehole/ Concentration Test Pit (μg/g) Depth Interval (m BGS) Antimony 3.6 TP9-G m; fill Arsenic 355 TP9-G m; fill Barium 234 TP9-G m; fill Boron 12.4 TP3-G m; fill Cadmium 2.0 TP9-G m; fill Chromium 47.8 TP9-G m; fill Chromium (VI) 0.5 TP9-G m; fill Cobalt 13.8 BH13-15-SS m; fill Copper 61.4 TP8-G m; fill Lead 334 TP8-G m; fill Mercury 0.3 TP2-G m; fill Molybdenum 2.5 TP9-G m; fill Nickel 31.2 BH13-15-SS m; fill Selenium 41.4 TP9-G m; fill Vanadium 86.7 TP9-G m; fill Zinc 298 TP2-G m; fill Acenaphthene 0.36 BH15-15-SS m; fill Acenaphthylene 0.56 BH12-15-SS m; fill Anthracene 2.54 BH12-15-SS m; fill Benzo[a]anthracene 3.21 BH1-AU m; fill Benzo[a]pyrene 3.05 BH1-AU m; fill Benzo[b]fluoranthene 4.34 BH1-AU m; fill Benzo[g,h,i]perylene 1.87 BH9-15-SS m; fill Benzo[k]fluoranthene 2.82 BH9-15-SS m; fill Chrysene 3.06 BH1-AU m; fill Dibenzo[a,h]anthracene 0.44 BH1-AU m; fill Fluoranthene 9.56 BH12-15-SS m; fill Fluorene 0.39 BH9-15-SS m; fill Indeno[1,2,3-cd]pyrene 1.83 BH9-15-SS m; fill Methylnaphthalene 4.38 BH12-15-SS m; fill (1&2) Naphthalene 1.26 BH12-15-SS m; fill Phenanthrene 7.53 BH12-15-SS m; fill Pyrene 8.61 BH12-15-SS m; fill PHC F1 39 BH16-15-SS m; fill PHC F2 395 BH16-15-SS m; fill PHC F3 253 BH16-15-SS m; fill PHC F4 187 BH1-AU ; fill SAR 0.45 BH14-15-AU ; fill EC 2.65 ms/cm BH15-15-AU ; fill Notes: Bold Value exceeds MOECC Table 3 standard All other parameter concentrations were below laboratory detection limits. January 26, 2016 Page 31
37 5.6 Groundwater Quality Groundwater samples from the monitoring wells were submitted for laboratory analysis of a combination of VOCs, PHCs, PAHs, metals and chloride parameters. The groundwater samples were obtained from the screened intervals noted on Table 1, above. The results of the analytical testing are presented below. The laboratory certificates of analysis are provided in Appendix 1. Table 12: Analytical Test Results Groundwater PAHs Parameter MDL (μg/l) Groundwater Samples (μg/l) June 16, 2014 BH2- BH3- GW1 GW1 BH1- GW1 Dup. 1 (BH3- GW1) MOECC Table 3 Residential Coarse Acenaphthene nd nd nd 600 Acenaphthylene 0.05 nd nd nd nd 1.8 Anthracene nd nd nd 2.4 Benzo[a]anthracene nd nd nd 4.7 Benzo[a]pyrene nd nd nd 0.81 Benzo[b]fluoranthene nd nd nd 0.75 Benzo[g,h,i]perylene nd nd nd 0.2 Benzo[k]fluoranthene nd nd nd 0.4 Chrysene nd nd nd 1 Dibenzo[a,h]anthracene 0.05 nd nd nd nd 0.52 Fluoranthene nd nd 130 Fluorene nd nd nd 400 Indeno[1,2,3-cd]pyrene nd nd nd 0.2 Methylnaphthalene (1&2) nd nd nd 1,800 Naphthalene ,400 Phenanthrene Pyrene Notes: MDL Method Detection Limit Nd not detected above the MDL N/V no value provided by the MOECC Bold Value exceeds MOECC Table 3 standard January 26, 2016 Page 32
38 Table 12 (continued): Analytical Test Results Groundwater PAHs Groundwater Samples (μg/l) Parameter MDL December 1, 2015 (μg/l) BH9-15- BH BH GW1 GW1 GW1 Acenaphthene 0.05 nd nd nd 600 Acenaphthylene 0.05 nd nd nd 1.8 Anthracene 0.01 nd nd nd 2.4 Benzo[a]anthracene 0.01 nd nd nd 4.7 Benzo[a]pyrene 0.01 nd nd nd 0.81 Benzo[b]fluoranthene 0.05 nd nd nd 0.75 Benzo[g,h,i]perylene 0.05 nd nd nd 0.2 Benzo[k]fluoranthene 0.05 nd nd nd 0.4 Chrysene 0.05 nd nd nd 1 Dibenzo[a,h]anthracene 0.05 nd nd nd 0.52 Fluoranthene 0.01 nd nd nd 130 Fluorene 0.05 nd nd nd 400 Indeno[1,2,3-cd]pyrene 0.05 nd nd nd 0.2 Methylnaphthalene (1&2) 0.10 nd nd nd 1,800 Naphthalene 0.05 nd nd nd 1,400 Phenanthrene 0.05 nd nd nd 580 Pyrene 0.01 nd nd nd 68 Notes: MDL Method Detection Limit Nd not detected above the MDL N/V no value provided by the MOECC Bold Value exceeds MOECC Table 3 standard MOECC Table 3 Residential Coarse January 26, 2016 Page 33
39 Table 12 (continued): Analytical Test Results Groundwater PAHs Groundwater Samples (μg/l) Parameter MDL December 1, 2015 (μg/l) BH BH BH GW1 GW1 GW1* Acenaphthene 0.05 nd nd nd(0.10) 600 Acenaphthylene 0.05 nd nd nd(0.10) 1.8 Anthracene 0.01 nd nd nd(0.02) 2.4 Benzo[a]anthracene 0.01 nd nd nd(0.02) 4.7 Benzo[a]pyrene 0.01 nd nd nd(0.02) 0.81 Benzo[b]fluoranthene 0.05 nd nd nd(0.10) 0.75 Benzo[g,h,i]perylene 0.05 nd nd nd(0.10) 0.2 Benzo[k]fluoranthene 0.05 nd nd nd(0.10) 0.4 Chrysene 0.05 nd nd nd(0.10) 1 Dibenzo[a,h]anthracene 0.05 nd nd nd(0.10) 0.52 Fluoranthene nd nd(0.02) 130 Fluorene 0.05 nd nd nd(0.10) 400 Indeno[1,2,3-cd]pyrene 0.05 nd nd nd(0.10) 0.2 Methylnaphthalene (1&2) 0.10 nd nd nd(0.20) 1,800 Naphthalene 0.05 nd nd nd(0.10) 1,400 Phenanthrene 0.05 nd nd nd(0.10) 580 Pyrene nd nd(0.02) 68 Notes: MDL Method Detection Limit nd not detected above the MDL N/V no value provided by the MOECC Bold - Value exceeds MOECC Table 3 standard * Elevated reporting limits due to limited sample volume MOECC Table 3 Residential Coarse All PAH concentrations are in compliance with the MOECC Table 3 standards. January 26, 2016 Page 34
40 Table 13: Analytical Test Results Groundwater Metals Soil Samples (μg/l) MOECC Parameter MDL BH1- BH2- BH3- BH13- Table 3 (μg/l) GW1 GW1 GW1 15-GW1 Residential June 16, 2014 Dec 1, Coarse 2015 Mercury nd 0.29 Antimony nd 20,000 Arsenic ,900 Barium ,000 Beryllium 0.5 nd nd nd nd 67 Boron ,000 Cadmium 0.5 nd nd nd nd 2.7 Chromium nd 810 Chromium (VI) nd 140 Cobalt nd 66 Copper nd 87 Lead nd nd nd 25 Molybdenum ,200 Nickel nd 1,400 Selenium nd nd 63 Sodium , , , ,000 2,300,000 Silver 0.3 nd nd nd nd 1.5 Thallium 1 nd nd nd nd 510 Uranium Vanadium nd 250 Zinc ,100 Notes: MDL Method Detection Limit Nd not detected above the MDL N/V no value provided by the MOECC Bold Value exceeds MOECC Table 3 standard Table 13: Analytical Test Results Groundwater Metals (Sodium) Parameter Soil Samples (μg/l) MDL December 1, 2015 (μg/l) BH14-15-GW1 BH17-15-GW1 Sodium , ,000 2,300,000 Notes: MDL Method Detection Limit Nd not detected above the MDL N/V no value provided by the MOECC Bold Value exceeds MOECC Table 3 standard MOECC Table 3 Residential Coarse All metals concentrations are in compliance with the MOECC Table 3 standards. January 26, 2016 Page 35
41 Table 14: Analytical Test Results Groundwater Chloride Parameter Soil Samples (μg/l) MDL December 1, 2015 (μg/l) BH14-15-GW1 BH17-15-GW1 Chloride , ,000 2,300,000 Notes: MDL Method Detection Limit Nd not detected above the MDL N/V no value provided by the MOECC Bold Value exceeds MOECC Table 3 Standard MOECC Table 3 Residential Coarse All chloride concentrations are in compliance with the MOECC Table 3 standards. January 26, 2016 Page 36
42 Table 15: Analytical Test Results Groundwater VOCs Groundwater Samples (μg/l) MOECC MDL June 16, 2014 Table 3 Parameter (μg/l) BH1- BH2- BH3- Dup. 2 Residential GW1 GW1 GW1 (BH1-GW1) Coarse Acetone 5.0 nd nd nd nd 130,000 Benzene 0.5 nd nd nd Bromodichloromethane 0.5 nd 3.1 nd nd 85,000 Bromoform 0.5 nd nd nd nd 380 Bromomethane 0.5 nd nd nd nd 5.6 Carbon Tetrachloride 0.2 nd nd nd nd 0.79 Chlorobenzene 0.5 nd nd nd nd 630 Chloroform Dibromochloromethane 0.5 nd nd nd nd 82,000 Dichlorodifluoromethane 1.0 nd nd nd nd 4,400 1,2-Dichlorobenzene 0.5 nd nd nd nd 4,600 1,3-Dichlorobenzene 0.5 nd nd nd nd 9,600 1,4-Dichlorobenzene 0.5 nd nd nd nd 8 1,1-Dichloroethane 0.5 nd nd nd nd 320 1,2-Dichloroethane 0.5 nd nd nd nd 1.6 1,1-Dichloroethylene 0.5 nd nd nd nd 1.6 cis-1,2-dichloroethylene 0.5 nd nd nd nd 1.6 trans-1,2-dichloroethylene 0.5 nd nd nd nd 1.6 1,2-Dichloropropane 0.5 nd nd nd nd 16 1,3-Dichloropropene 0.5 nd nd nd nd 5.2 Ethylbenzene 0.5 nd nd nd nd 2,300 Hexane nd nd Methyl Ethyl Ketone 5.0 nd nd nd nd 470,000 Methyl Isobutyl Ketone 5.0 nd nd nd nd 140,000 Methyl tert-butyl Ether 2.0 nd nd nd nd 190 Methylene Chloride 5.0 nd nd nd nd 610 Styrene 0.5 nd nd nd nd 1,300 1,1,1,2-Tetrachloroethane 0.5 nd nd nd nd 3.3 1,1,2,2-Tetrachloroethane 0.5 nd nd nd nd 3.2 Tetrachloroethylene 0.5 nd nd nd nd 1.6 Toluene ,000 1,2,4-Trichlorobenzene 0.5 nd nd nd nd 180 1,1,1-Trichloroethane 0.5 nd nd nd nd 640 1,1,2-Trichloroethane 0.5 nd nd 4.9 nd 4.7 Trichloroethylene 0.5 nd nd nd nd 1.6 Trichlorofluoromethane 1.0 nd nd nd nd 2,500 Vinyl Chloride 0.5 nd nd nd nd 0.5 Xylenes nd ,200 Notes: MDL Method Detection Limit nd not detected above the MDL N/V no value provided by the MOECC Bold Value exceeds MOECC Table 3 standards January 26, 2016 Page 37
43 Table 15 (continued): Analytical Test Results Groundwater VOCs Groundwater Samples (μg/l) MOECC Table MDL July 31, Parameter (μg/l) BH1- BH2- BH3- BH4- Residential GW2 GW2 GW2 GW1 Coarse Acetone 5.0 nd nd nd nd 130,000 Benzene 0.5 nd nd nd nd 44 Bromodichloromethane 0.5 nd nd nd ,000 Bromoform 0.5 nd nd nd nd 380 Bromomethane 0.5 nd nd nd nd 5.6 Carbon Tetrachloride 0.2 nd nd nd nd 0.79 Chlorobenzene 0.5 nd nd nd nd 630 Chloroform 0.5 nd 5.2 nd Dibromochloromethane 0.5 nd nd nd nd 82,000 Dichlorodifluoromethane 1.0 nd nd nd nd 4,400 1,2-Dichlorobenzene 0.5 nd nd nd nd 4,600 1,3-Dichlorobenzene 0.5 nd nd nd nd 9,600 1,4-Dichlorobenzene 0.5 nd nd nd nd 8 1,1-Dichloroethane 0.5 nd nd nd nd 320 1,2-Dichloroethane 0.5 nd nd nd nd 1.6 1,1-Dichloroethylene 0.5 nd nd nd nd 1.6 cis-1,2-dichloroethylene 0.5 nd nd nd nd 1.6 trans-1,2-dichloroethylene 0.5 nd nd nd nd 1.6 1,2-Dichloropropane 0.5 nd nd nd nd 16 1,3-Dichloropropene 0.5 nd nd nd nd 5.2 Ethylbenzene 0.5 nd nd nd nd 2,300 Hexane 1.0 nd nd nd nd 51 Methyl Ethyl Ketone 5.0 nd nd nd nd 470,000 Methyl Isobutyl Ketone 5.0 nd nd nd nd 140,000 Methyl tert-butyl Ether 2.0 nd nd nd nd 190 Methylene Chloride 5.0 nd nd nd nd 610 Styrene 0.5 nd nd nd nd 1,300 1,1,1,2-Tetrachloroethane 0.5 nd nd nd nd 3.3 1,1,2,2-Tetrachloroethane 0.5 nd nd nd nd 3.2 Tetrachloroethylene 0.5 nd nd nd nd 1.6 Toluene 0.5 nd nd nd nd 18,000 1,2,4-Trichlorobenzene 0.5 nd nd nd nd 180 1,1,1-Trichloroethane 0.5 nd nd nd nd 640 1,1,2-Trichloroethane 0.5 nd nd nd nd 4.7 Trichloroethylene 0.5 nd nd nd nd 1.6 Trichlorofluoromethane 1.0 nd nd nd nd 2,500 Vinyl Chloride 0.5 nd nd nd nd 0.5 Xylenes 0.5 nd nd nd nd 4,200 Notes: MDL Method Detection Limit nd not detected above the MDL N/V no value provided by the MOECC Bold Value exceeds MOECC Table 3 Standards January 26, 2016 Page 38
44 Table 15 (continued): Analytical Test Results Groundwater VOCs Parameter MDL (μg/l) BH9-15- GW1 Groundwater Samples (μg/l) December 1, 2015 BH10- BH GW1 GW1 BH GW1 MOECC Table 3 Residential Coarse Acetone 5.0 nd nd nd nd 130,000 Benzene 0.5 nd nd 0.5 nd 44 Bromodichloromethane 0.5 nd nd nd nd 85,000 Bromoform 0.5 nd nd nd nd 380 Bromomethane 0.5 nd nd nd nd 5.6 Carbon Tetrachloride 0.2 nd nd nd nd 0.79 Chlorobenzene 0.5 nd nd nd nd 630 Chloroform Dibromochloromethane 0.5 nd nd nd nd 82,000 Dichlorodifluoromethane 1.0 nd nd nd nd 4,400 1,2-Dichlorobenzene 0.5 nd nd nd nd 4,600 1,3-Dichlorobenzene 0.5 nd nd nd nd 9,600 1,4-Dichlorobenzene 0.5 nd nd nd nd 8 1,1-Dichloroethane 0.5 nd nd nd nd 320 1,2-Dichloroethane 0.5 nd nd nd nd 1.6 1,1-Dichloroethylene 0.5 nd nd nd nd 1.6 cis-1,2-dichloroethylene 0.5 nd nd nd nd 1.6 trans-1,2-dichloroethylene 0.5 nd nd nd nd 1.6 1,2-Dichloropropane 0.5 nd nd nd nd 16 1,3-Dichloropropene 0.5 nd nd nd nd 5.2 Ethylbenzene 0.5 nd nd nd nd 2,300 Ethylene dibromide 0.2 nd nd nd nd 0.25 Hexane 1.0 nd nd 5.8 nd 51 Methyl Ethyl Ketone 5.0 nd nd nd nd 470,000 Methyl Isobutyl Ketone 5.0 nd nd nd nd 140,000 Methyl tert-butyl Ether 2.0 nd nd nd nd 190 Methylene Chloride 5.0 nd nd nd nd 610 Styrene 0.5 nd nd nd nd 1,300 1,1,1,2-Tetrachloroethane 0.5 nd nd nd nd 3.3 1,1,2,2-Tetrachloroethane 0.5 nd nd nd nd 3.2 Tetrachloroethylene 0.5 nd nd nd nd 1.6 Toluene nd ,000 1,1,1-Trichloroethane 0.5 nd nd nd nd 640 1,1,2-Trichloroethane 0.5 nd nd nd nd 4.7 Trichloroethylene 0.5 nd nd nd nd 1.6 Trichlorofluoromethane 1.0 nd nd nd nd 2,500 Vinyl Chloride 0.5 nd nd nd nd 0.5 Xylenes 0.5 nd nd 4.6 nd 4,200 Notes: MDL Method Detection Limit nd not detected above the MDL N/V no value provided by the MOECC Bold Value exceeds MOECC Table 3 Standards January 26, 2016 Page 39
45 Table 15 (continued): Analytical Test Results Groundwater VOCs Groundwater Samples (μg/l) MOECC MDL December 1, 2015 Table 3 Parameter (μg/l) BH BH BH Residential GW1 GW1 GW1 Coarse Acetone 5.0 nd nd nd 130,000 Benzene 0.5 nd nd Bromodichloromethane 0.5 nd nd nd 85,000 Bromoform 0.5 nd nd nd 380 Bromomethane 0.5 nd nd nd 5.6 Carbon Tetrachloride 0.2 nd nd nd 0.79 Chlorobenzene 0.5 nd nd nd 630 Chloroform nd Dibromochloromethane 0.5 nd nd nd 82,000 Dichlorodifluoromethane 1.0 nd nd nd 4,400 1,2-Dichlorobenzene 0.5 nd nd nd 4,600 1,3-Dichlorobenzene 0.5 nd nd nd 9,600 1,4-Dichlorobenzene 0.5 nd nd nd 8 1,1-Dichloroethane 0.5 nd nd nd 320 1,2-Dichloroethane 0.5 nd nd nd 1.6 1,1-Dichloroethylene 0.5 nd nd nd 1.6 cis-1,2-dichloroethylene 0.5 nd nd nd 1.6 trans-1,2-dichloroethylene 0.5 nd nd nd 1.6 1,2-Dichloropropane 0.5 nd nd nd 16 1,3-Dichloropropene 0.5 nd nd nd 5.2 Ethylbenzene 0.5 nd nd nd 2,300 Ethylene dibromide 0.2 nd nd nd 0.25 Hexane 1.0 nd nd nd 51 Methyl Ethyl Ketone 5.0 nd nd nd 470,000 Methyl Isobutyl Ketone 5.0 nd nd nd 140,000 Methyl tert-butyl Ether 2.0 nd nd nd 190 Methylene Chloride 5.0 nd nd nd 610 Styrene 0.5 nd nd nd 1,300 1,1,1,2-Tetrachloroethane 0.5 nd nd nd 3.3 1,1,2,2-Tetrachloroethane 0.5 nd nd nd 3.2 Tetrachloroethylene 0.5 nd nd nd 1.6 Toluene 0.5 nd nd ,000 1,1,1-Trichloroethane 0.5 nd nd nd 640 1,1,2-Trichloroethane 0.5 nd nd nd 4.7 Trichloroethylene 0.5 nd nd nd 1.6 Trichlorofluoromethane 1.0 nd nd nd 2,500 Vinyl Chloride 0.5 nd nd nd 0.5 Xylenes 0.5 nd nd 1.6 4,200 Notes: MDL Method Detection Limit nd not detected above the MDL N/V no value provided by the MOECC Bold Value exceeds MOECC Table 3 standards January 26, 2016 Page 40
46 Concentrations of chloroform in various samples exceeded the MOECC Table 3 standards. In our opinion, the presence of chloroform is due to the use of municipally treated water as core water during the drilling process. Reductions in chloroform concentrations were observed at BH1 through BH3 during a second sampling event and are considered to be indicative of the removal of core water from the monitoring wells through purging. In our opinion, additional purging will result in further lowering of chloroform concentrations. Additionally, the concentration of 1,1,2-trichloroethane at BH3 from the initial groundwater sampling event exceeded MOECC Table 3 standards. The concentration of 1,1,2-trichloroethane at BH3 was in compliance with the MOECC Table 3 standard during the second sampling event. All other VOC concentrations were in compliance with the MOECC Table 3 standards. Table 16: Analytical Test Results Groundwater PHCs Parameter MDL (μg/l) Groundwater Samples (μg/l) June 16, 2014 MOECC Table 3 Residential Coarse BH1-GW1 BH2-GW1 BH3-GW1 PHCs F 1 25 nd nd nd 750 PHCs F nd nd nd 150 PHCs F nd nd nd 500 PHCs F nd nd nd 500 Notes: MDL Method Detection Limit nd not detected above the MDL Bold Value exceeds MOECC Table 3 standards January 26, 2016 Page 41
47 Table 16 (continued): Analytical Test Results Groundwater PHCs Parameter MDL (μg/l) Groundwater Samples (μg/l) December 1, 2015 MOECC Table 3 Residential Coarse BH9-15- GW1 BH GW1 BH GW1 Benzene 0.5 nd nd nd 44 Ethylbenzene 0.5 nd nd nd 2,300 Toluene nd 18,000 Xylenes 0.5 nd nd nd 4,200 PHCs F 1 25 nd nd nd 750 PHCs F nd nd nd 150 PHCs F nd nd nd 500 PHCs F nd nd nd 500 Notes: MDL Method Detection Limit nd not detected above the MDL Bold Value exceeds MOECC Table 3 standards Table 16 (continued): Analytical Test Results Groundwater PHCs Parameter MDL (μg/l) Groundwater Samples (μg/l) December 1, 2015 MOECC Table 3 Residential Coarse BH14-15-GW1 BH16-15-GW1 Benzene 0.5 nd Ethylbenzene 0.5 nd nd 2,300 Toluene 0.5 nd ,000 Xylenes 0.5 nd 1.6 4,200 PHCs F 1 25 nd PHCs F nd PHCs F nd PHCs F nd nd 500 Notes: MDL Method Detection Limit nd not detected above the MDL Bold Value exceeds MOECC Table 3 standards The concentration of PHC (F 2 ) exceeded the MOECC Table 3 standards in the groundwater sample collected from the monitoring well installed in BH All other PHC concentrations were in compliance with the selected MOECC Table 3 standards. January 26, 2016 Page 42
48 The maximum final concentrations of all parameters analyzed in groundwater are summarized below. Table 17: Maximum Concentrations Groundwater Maximum Parameter Concentration (μg/l) Borehole/Sample Location Depth Interval (m BGS) Acenaphthene 0.08 BH1-GW ; limestone Anthracene 0.08 BH1-GW ; limestone Benzo[a]anthracene 0.18 BH1-GW ; limestone Benzo[a]pyrene 0.10 BH1-GW ; limestone Benzo[b]fluoranthene 0.16 BH1-GW ; limestone Benzo[g,h,i]perylene 0.07 BH1-GW ; limestone Benzo[k]fluoranthene 0.11 BH1-GW ; limestone Chrysene 0.24 BH1-GW ; limestone Fluoranthene 0.40 BH1-GW ; limestone Fluorene 0.09 BH1-GW ; limestone Indeno[1,2,3-cd]pyrene 0.05 BH1-GW ; limestone Methylnaphthalene (1&2) 0.29 BH1-GW ; limestone Naphthalene 0.43 BH1-GW ; limestone Phenanthrene 1.30 BH1-GW ; limestone Pyrene 0.34 BH1-GW ; limestone Antimony 3.2 BH1-GW ; limestone Arsenic 2 BH1-GW1; BH2- GW1; BH GW ; limestone; ; limestone ; fill Barium 310 BH13-15-GW ; fill Boron 184 BH1-GW ; limestone Chromium 7 BH3-GW1; ; limestone Cobalt 3.3 BH1-GW ; limestone Copper 13.7 BH1-GW ; limestone Lead 3.1 BH1-GW ; limestone Molybdenum 17.9 BH1-GW ; limestone Nickel 5 BH1-GW ; limestone Selenium 2 BH2-GW ; limestone Uranium 3.7 BH1-GW ; limestone Vanadium 12.7 BH3-GW ; limestone Zinc 23 BH1-GW ; limestone Sodium 477,000 BH17-15-GW ; fill Chloride 749 BH17-15-GW ; fill Bromodichloromethane 4.5 BH4-GW ; limestone Chloroform 53.7 BH4-GW ; limestone Hexane 5.8 BH11-15-GW ; limestone Benzene 0.6 BH16-15-GW ;fill/ silty clay Toluene 3.7 BH11-15-GW ; limestone Xylenes 4.6 BH11-15-GW ; limestone PHC (F 1 ) 419 BH16-15-GW ;fill/ silty clay PHC (F 2 ) 449 BH16-15-GW ;fill/ silty clay PHC (F 3 ) 151 BH16-15-GW ;fill/ silty clay January 26, 2016 Page 43
49 The concentrations of all other parameters were below laboratory detection limits. 5.7 Quality Assurance and Quality Control Results As per the Sampling and Analysis Plan, duplicate groundwater samples were obtained at BH1 and BH3 during the June 2014 sampling event and analyzed for PAHs and VOCs respectively. The relative percent difference (RPD) calculations for the original and duplicate samples are provided below. Table 18: QA/QC Calculations Groundwater PAHs Parameter MDL (μg/l) BH3-GW1 Dup. 1 RPD (%) QA/QC Result Naphthalene % Meets target Phenanthrene % Exceeds target Pyrene % Meets target Notes: *All other parameter concentrations were below laboratory detection limits for both original and duplicate samples, and as such, are within acceptable QA/QC parameters. ** Where one parameter concentration is below the laboratory detection limit, the value of the detection limit is used for RPD calculations. Table 19: QA/QC Calculations Groundwater VOCs Parameter MDL (μg/l) BH1-GW1 Dup. 2 RPD (%) QA/QC Result Benzene 0.5 < % Meets target Chloroform % Meets target Hexane % Exceeds target Toluene % Meets target Xylenes % Meets target Notes: All other parameter concentrations were below laboratory detection limits for both original and duplicate samples, and as such, are within acceptable QA/QC parameters. ** Where one parameter concentration is below the laboratory detection limit, the value of the detection limit is used for RPD calculations. All other parameter concentrations were below laboratory detection limits. The majority of calculated RPD values were within 20%, and as such, are considered acceptable. The target range was exceeded for hexane and phenanthrene. However, both the original and duplicate concentrations of these parameters are well below the selected MOECC Table 3 standards. As such, the conclusions of the report are not considered to be affected. January 26, 2016 Page 44
50 All samples submitted as part of this Phase II-ESA were handled in accordance with the Analytical Protocol with respect to holding time, preservation method, storage requirement, and container type. As per Subsection 47(3) of O.Reg. 153/04 as amended by O.Reg. 269/11, a Certificate of Analysis has been received for each sample submitted for analysis, and all Certificates of Analysis are appended to this report. Overall, the quality of the field data collected during this Phase II-ESA is considered to be sufficient to meet the overall objectives of this assessment. 5.8 Phase II-ESA Conceptual Site Model The following section has been prepared in accordance with the requirements of O.Reg. 153/04 as amended by O.Reg. 269/11 - Record of Site Condition regulation, made under the Environmental Protection Act. Conclusions and recommendations are discussed in a subsequent section. Site Description Potentially Contaminating Activities Potentially contaminating activities at the Phase I-ESA property include the historical presence of rail lines, an oil house and a snow dump on the subject site. Additional PCAs were present within the Phase I-ESA study area. Based on their separation distance and/or their inferred downgradient or cross-gradient location with respect to the subject site and previous investigations, the majority of the off-site PCAs are not considered to represent Areas of Potential Environmental Concern (APEC) with respect to the subject site. The exception is the Brown s Cleaners depot to the south of the subject site, which is considered to be an APEC with respect to the subject site. Areas of Potential Environmental Concern Based on the results of the Phase I-ESA completed for the subject site, several APECs were identified at the subject site. The APECs with respect to the subject site are summarized below: Historical presence of rail yards on the subject site; Item 46, Table 2, O.Reg. 153/04 as amended ( Rail yards, Tracks, and Spurs ). January 26, 2016 Page 45
51 Historical presence of oil house identified on subject property; Item 28, Table 2, O.Reg. 153/04 as amended ( Gasoline and Associated Products Storage in Fixed Tanks ). Brown s Cleaners depot to the south of the subject site; Item 37, Table 2, O.Reg. 153/04 as amended ( Operation of Dry Cleaning Equipment ). Historical presence of a snow dump identified on the subject property. Other PCAs within the Phase I-ESA study area are not considered to pose an environmental concern to the subject site due to their separation distance and/or location down-gradient or cross-gradient of the subject site. Contaminants of Potential Concern The Phase I-ESA identified BTEX, PHCs, PAHs, metals, VOCs, sodium adsorption ratio, electrical conductivity, sodium and chloride as contaminants of concern in soil and/or groundwater. Based on the results of the Phase II-ESA, the contaminants of concern at the subject site are considered to be PHCs, metals, and PAHs in soil, and PHCs in groundwater. Detailed descriptions of these contaminants are provided in Subsection 3.3 of this report. Subsurface Structures and Utilities The subject site is located in a municipally serviced area. There are currently no buildings on the subject site. Sanitary and storm sewers are present beneath the subject site. Electrical services in the vicinity of the subject site are overhead. Physical Setting Site Stratigraphy Site stratigraphy, from ground surface to the deepest aquifer or aquitard investigated, is provided in the Soil Profile and Test Data Sheets provided in Appendix 1 and illustrated on Drawing PE Cross-Section A-A and Drawing PE Cross-Section B-B. Stratigraphy consists of: A layer of fill material, consisting of silty sand with gravel, cobble, boulders, ash, coal, and intermittent wood and metal debris, from approximately surface to 6.6 m deep. An intermittent layer of silty clay, encountered in TP8 and BH2 at depths varying from 2.1 to 1.4 m and varying in thickness from 0.9 to 3.7 m. January 26, 2016 Page 46
52 A layer of glacial till, varying in thickness from 0.7 to 5.7 m, and encountered at depths varying from 1.1 to 6.1 m below existing grade. The glacial till consists of a silt, sand and clay matrix with gravel, cobbles, and boulders. A layer of bedrock, consisting of interbedded limestone and shale of the Verulam Formation, encountered at depths ranging from 5.6 to 14.5 m below existing grade. This is the deepest unit investigated. Hydrogeological Characteristics Groundwater levels were measured at the subject site on June 16, 2014 and December 1, Groundwater was encountered at depths between 1.8 and 7.7 m below existing grade. Seasonal variation of water levels is expected. Based on the groundwater elevations from the December 2015 monitoring event, groundwater contour mapping was completed for the overburden and bedrock strata. Groundwater contours are shown on Drawing PE Groundwater Contour Plan Overburden Monitoring Wells and Drawing PE Groundwater Contour Plan Bedrock Monitoring Wells. Based on the contour mapping, groundwater flow in the bedrock at the subject site appears to be in a northern direction. A horizontal hydraulic gradient of approximately 0.07 m/m was calculated. The groundwater flow in the overburden at the subject site appears to be in a southern direction, with a horizontal hydraulic gradient of approximately m/m, it is our opinion that groundwater flow at the subject site may be influenced by site services. It is noted that water levels fluctuate with seasonal variations. Approximate Depth to Bedrock Based on the results of the current investigation and previous subsurface investigations at the subject site, approximate depth to bedrock at the subject site varies between approximately 5.6 to 14.5 m below existing ground surface. Approximate Depth to Water Table Depth to water table at the subject site varies between approximately 1.84 and 7.68 m below existing grade. Sections 41 and 43.1 of the Regulation Section 41 of the Regulation (Site Condition Standards, Environmentally Sensitive Areas) does not apply to the subject site. January 26, 2016 Page 47
53 Section 43.1 of the Regulation does not apply to the subject site in that the subject site is not a Shallow Soil Property and is not within 30 m of a water body. Fill Placement Fill placement has occurred at the subject site. The fill material consists primarily of silty sand with clay, gravel, crushed stone, and trace coal, ash, wood, and metal debris. Samples of the fill material were analyzed for metals, EC, SAR, PAHs, and BTEX/PHCs. Analytical results are summarized in Section 5.5 of this report and shown on Drawings PE through PE and Drawings PE through PE No further details are available concerning the origins of the fill material. Proposed Buildings and Other Structures It is our understanding that the proposed development consists of three residential towers, a 10 storey office building and retail galleria with three levels of underground parking. Existing Buildings and Structures There are currently no buildings or structures at the subject site. Water Bodies There are no water bodies on or in the immediate vicinity of the subject property. The closest water body is the Ottawa River, located approximately 320 m to the north of the RSC property. Areas of Natural Significance No areas of natural significance are present on the subject site. Environmental Condition Areas Where Contaminants are Present Based on the results of the Phase II-ESA, the horizontal and vertical extents of the areas where contaminants are present at concentrations greater than the applicable site condition Standards are shown on Drawings PE through PE and Drawings PE through PE January 26, 2016 Page 48
54 Types of Contaminants The Phase I-ESA identified BTEX, PHCs, PAHs, metals, VOCs, electrical conductivity, SAR, sodium, and chloride as contaminants of concern in soil and groundwater. Based on the results of the Phase II-ESA, the contaminants of potential concern at the subject site are considered to be metals and PAHs in soil, and PHCs in groundwater. It is our interpretation that the chloroform concentrations in groundwater are the result of the use of municipally-treated core water during drilling, and are not considered to be representative of site conditions. Detailed descriptions of these contaminants are provided in Subsection 3.3 of this report. Contaminated Media Based on the results of the Phase II-ESA and previous subsurface investigations, some of the fill material at the subject site is contaminated with metals, PAHs, and PHCs. Concentrations of chloroform and PHC (F 2 ) exceeding MOECC Table 3 standards were observed in groundwater. However, in our interpretation, the concentrations of chloroform in groundwater are the result of the use of municipally-treated water used during the bedrock core drilling operation, and are not considered to be representative of site conditions. What Is Known About Areas Where Contaminants Are Present Impacted fill material was noted throughout the subject site and is considered to be associated with those areas of the subject site formerly used as a rail yard. Chloroform concentrations were observed in site groundwater, in our interpretation, the concentrations of chloroform in the groundwater samples are the result of the use of municipally-treated water used during bedrock core drilling operations. Distribution of Contaminants The approximate vertical and horizontal distributions of contaminants are shown on Drawings PE through PE and Drawings PE through PE January 26, 2016 Page 49
55 Discharge of Contaminants In our interpretation, the presence of the impacted fill at the subject site is the result of the historical presence of the rail yards at the subject site. No documentation or records of discharges were available for review. In our interpretation, the concentrations of chloroform in site groundwater are the result of the use of municipally-treated water during the bedrock core drilling operation, and are not considered to be representative of site conditions. Migration of Contaminants Physical transport of contaminated soil at the subject site does not appear to be occurring. It appears migration of contaminants in site soils have been affected by downward leaching. Based on analytical testing, concentrations of PHCs are present in the groundwater on the subject site. PHCs are generally considered to be light non-aqueous phase liquids (LNAPLs) indicating that when present in sufficient concentrations above the solubility limit, they will partition into a separate phase above the water table, due to their lower density. Metal and PAH soil impacts are not considered to have migrated beyond the fill layer as the analytical testing for metals and PAHs in the site groundwater complies with MOECC Table 3 standards. Climatic and Meteorological Conditions In general, climatic and meteorological conditions have the potential to affect contaminant distribution. Two ways by which climatic and meteorological conditions may affect contaminant distribution include the downward leaching of contaminants by means of the infiltration of precipitation, and the migration of contaminants via groundwater levels and/or flow, which may fluctuate seasonally. Downward leaching may have affected the vertical distribution of PHCs in the area of BH Metals and PAHs are not considered to have been affected by downward leaching as analytical testing for metals and PAHs in the site groundwater complies with MOECC Table 3 standards. Potential for Vapour Intrusion There are currently no buildings or subsurface structures other than sewers on the subject site. It is our understanding that any contamination on the site will be remediated prior to site redevelopment. As such, the potential for vapour intrusion at the subject site is considered to be negligible. January 26, 2016 Page 50
56 6.0 CONCLUSIONS Assessment A Phase II- ESA was conducted for the property at 900 Albert Street (formerly 801 Albert Street), Ottawa, Ontario. The Phase II-ESA consisted of the drilling of 13 boreholes, the excavation of 10 test pits, and the installation of 13 groundwater monitoring wells to assess soil and groundwater quality at the subject site. Soil samples were obtained from the boreholes and test pits and were screened using visual observations and vapour measurements. Site soils consist of fill over an intermittent layer of silty clay, underlain by glacial till and interbedded limestone and shale bedrock. Based on the screening results, various samples were selected for analysis of BTEX, PHCs F 1 -F 4, metals, VOCs, PAHs, EC and SAR. Based on the analytical results, some of the fill material at the subject site exceeds the MOECC Table 3 standards for metals, PAHs, and PHCs. Three groundwater samples and two duplicate samples were collected from the monitoring wells installed in BH1, BH2 and BH3 and analyzed for PHCs, VOCs, metals, and PAHs. All groundwater samples exceeded MOECC Table 3 standards for chloroform, and the concentration of 1,1,2-trichloroethane exceeded the MOECC Table 3 standard in the groundwater sample collected from the monitoring well installed in BH3. The presence of chloroform is interpreted to be the result of the use of municipally-treated water used during the drilling program. A second groundwater sampling event was subsequently completed in July Four groundwater samples were analyzed for VOCs. Although a general decrease in chloroform concentrations were noted, chloroform concentrations in the groundwater samples collected from the monitoring wells installed in BH2 and BH4 exceeded the MOECC Table 3 standards. All other VOC concentrations were in compliance with the Table 3 standards. A third groundwater sampling event was completed in December Nine groundwater samples were collected from the monitoring wells installed in BH9-15 through BH17-15 and were analyzed for a combination of PHC (F 1 -F 4 ), BTEX, VOC, PAH, metals, sodium and chloride parameters. The concentration of PHC (F 2 ) exceeded the MOECC Table 3 standard in the groundwater sample collected from the monitoring well installed in BH Concentrations of chloroform exceeded the MOECC Table 3 standards in the groundwater samples January 26, 2016 Page 51
57 collected from the monitoring wells installed in BH11-15, BH14-15 and BH The presence of chloroform is interpreted to be the result of the use of municipally-treated water used during the drilling program. Recommendations Based on the above results, metals, PAH, and PHC concentrations in soil and PHC (F 2 ) concentrations in groundwater at the subject site exceed the applicable MOECC Table 3 standards. It is our understanding that the proposed development consists of three residential towers, a 10 storey office building and retail galleria with three levels of underground parking. The environmental site remediation program, consisting of the excavation and off-site disposal of all contaminated soil, can be completed concurrently with site redevelopment. Soil It is recommended that impacted soil from the property be removed as part of the site redevelopment program. Any impacted soil removed from the site during redevelopment will require disposal at an approved waste disposal facility. It is recommended that Paterson personnel be present onsite during the soil excavation program to direct excavation activities in the areas where impacted material has been identified or is expected to exist. It is recommended that confirmatory soil samples be collected upon completion of the soil remediation program to ensure that the site meets MOECC Table 3 standards. Groundwater Depending upon the volume of impacted groundwater encountered, several options may be available to treat the groundwater. The removal of impacted groundwater from the site by a licensed pumping contractor would be a feasible option for smaller volumes, while an on-site treatment system would likely be more economical for larger volumes over a longer period of time. An on-site treatment system would discharge to the City of Ottawa sewer system. Prior to discharging treated groundwater to the municipal sewer system, a Sanitary Sewer Agreement will be required from the City of Ottawa s Sewer Use Program. It is recommended that groundwater monitoring wells be installed upon completion of the site remediation program to ensure that the site meets MOECC Table 3 standards. January 26, 2016 Page 52

58 7.0 STATEMENT OF LIMITATIONS This Phase II - Environmental Site Assessment report has been prepared in general accordance with O.Reg. 153/04 as amended by O.Reg. 269/11, and meets the requirements of CSA Z The conclusions presented herein are based on information gathered from a limited sampling and testing program. The test results represent conditions at specific test locations at the time of the field program. The client should be aware that any information pertaining to soils and all test hole logs are furnished as a matter of general information only and test hole descriptions or logs are not to be interpreted as descriptive of conditions at locations other than those of the test holes themselves. Should any conditions be encountered at the subject site and/or historical information that differ from our findings, we request that we be notified immediately in order to allow for a reassessment. This report was prepared for the sole use of Trinity Development Group Inc. Permission and notification from Trinity and Paterson will be required to release this report to any other party. Paterson Group Inc. Lauren Kratz, B.Eng. Carlos P. Da Silva, P.Eng., QP ESA Report Distribution Trinity Development Group Inc. Paterson Group January 26, 2016 Page 53
59 FIGURES FIGURE 1 - KEY PLAN DRAWING PE TEST HOLE LOCATION PLAN DRAWING PE SOIL ANALYTICAL TESTING PLAN PHC (F 1 -F 4 )/BTEX DRAWING PE SOIL ANALYTICAL TESTING PLAN VOCS DRAWING PE SOIL ANALYTICAL TESTING PLAN PAHS DRAWING PE SOIL ANALYTICAL TESTING PLAN METALS DRAWING PE SOIL ANALYTICAL TESTING PLAN SAR/EC DRAWING PE GROUNDWATER ANALYTICAL TESTING PLAN PHC (F 1 -F 4 )/BTEX DRAWING PE GROUNDWATER ANALYTICAL TESTING PLAN VOCS DRAWING PE GROUNDWATER ANALYTICAL TESTING PLAN PAHS DRAWING PE GROUNDWATER ANALYTICAL TESTING PLAN METALS DRAWING PE GROUNDWATER ANALYTICAL TESTING PLAN SAR/EC DRAWING PE GROUNDWATER CONTOUR PLAN OVERBURDEN MONITORING WELLS DRAWING PE GROUNDWATER CONTOUR PLAN BEDROCK MONITORING WELLS DRAWING PE CROSS-SECTION A-A DRAWING PE CROSS-SECTION B-B
60 SITE FIGURE 1 KEY PLAN
61

62
63


64


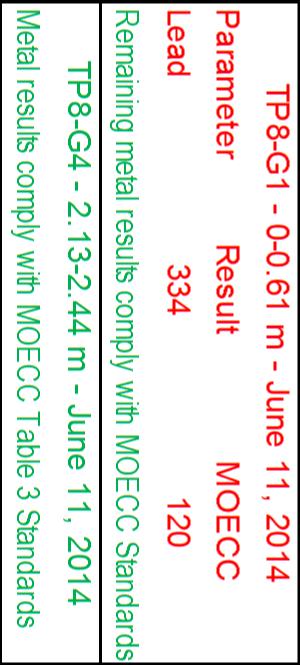
65
66

67


68

69


70
71
72
73


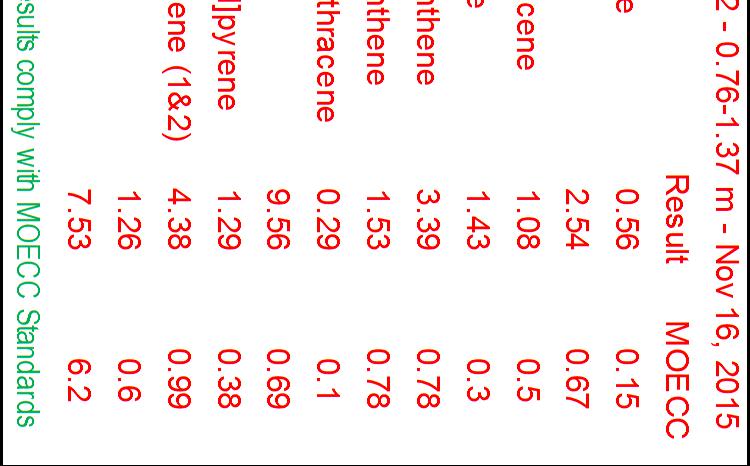


74


75