Existing Land Use USACE Fountain Creek Watershed Study Watershed Management Plan, Pueblo
|
|
|
- Rhoda Bates
- 5 years ago
- Views:
Transcription

1 Existing Land Use USACE Fountain Creek Watershed Study Watershed Management Plan, 2009 Pueblo N
2 Future Land Use (2025) USACE Fountain Creek Watershed Study Watershed Management Plan, 2009 Pueblo N
3 Project From To Users Acre Feet / year Homestake Eagle River Rampart Reservoir Blue River Blue River North Catamount Reservoir Fry-Ark Roaring Fork WTPs via pipelines from reservoir system Colorado Springs Colorado Springs Colorado Springs, Fountain, Security Sources: Colorado Water Conservation Board (CWCB) Watershed Flow Evaluation Tool (WFET) Pilot Study Report & SDS FEIS 64,700 7,800 11,700 84,200
4 No Action = No Federal Action - Still Assumes Growth

5 Waldo Canyon Burn Area ~ 29 sq. mi. Black Forest ~ 22 sq. mi., most in Fountain Creek watershed 50 sq. mi. total +/- ~ 10% of watershed area above Security Impacts of hydromodification, erosion and sediment transport are severe Eventually watersheds burned will recover but may be 10 years + Urbanization near urban-wildland interface increases opportunities for wildfires
 Results")
6 Waldo Canyon Wildfire Increase in Sediment Yield Source: Waldo Canyon Fire Watershed Assessment: The Watershed Assessment of River Stability and Sediment Supply (WARSSS) Results (4/5/13).

7 Insert picture
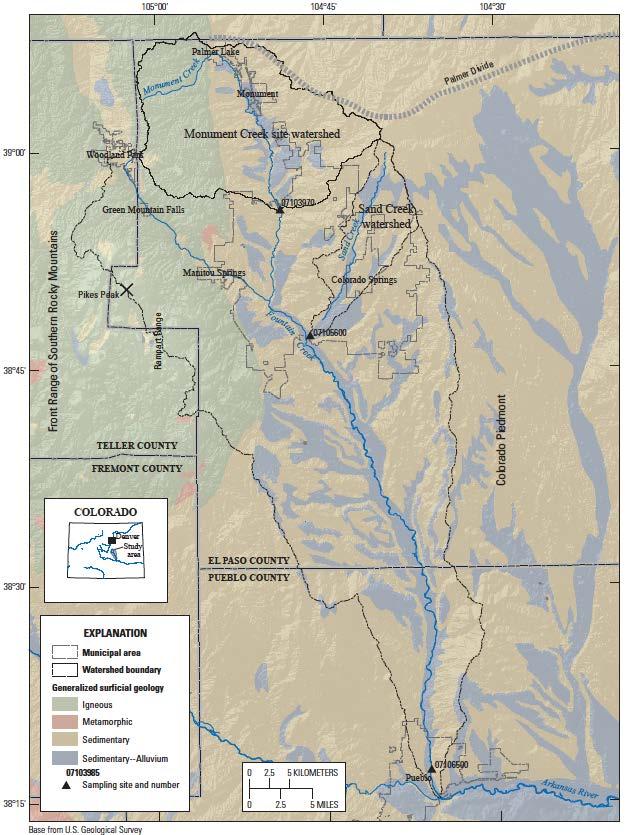
8 Winter Spring Summer Autumn Mean Daily Streamflow (cu. meters/sec) Monument Creek, Above Woodman Rd, Sand Creek, Fountain Creek at Pueblo, Annual hydrograph of mean-daily streamflow at selected locations in the Fountain Creek watershed, Colorado, (USGS, Stogner et al. 2013)
9 CUMULATIVE STREAMFLOW Plausible reasons for changes: Importation of transbasin water from outside the watershed; Sparse spatial distribution of precipitation stations Changes in land use within the watershed could have altered the hydrologic response of the watershed to precipitation events; or Changes are due to combination of these variables (Stogner 2000). CUMULATIVE PRECIPITATION
10 Streamflow (cfs)
11 Streamflow (cfs)
12 Discharge (cfs) Pre 1970 Post 1980 Mean Median Minimum 0 0 Maximum Standard Deviation N % Upper Confidence Interval for Mean 95% Lower Confidence Interval for Mean
13 Time Period/Scenario Stream Flow (acre-feet/year) , , SDS Contribution 156,193
14
15
16 Q100 ~ 40,000 cfs
17 Colorado Water Conservation Board lists Pueblo County DFIRM In Progress
18
19
20
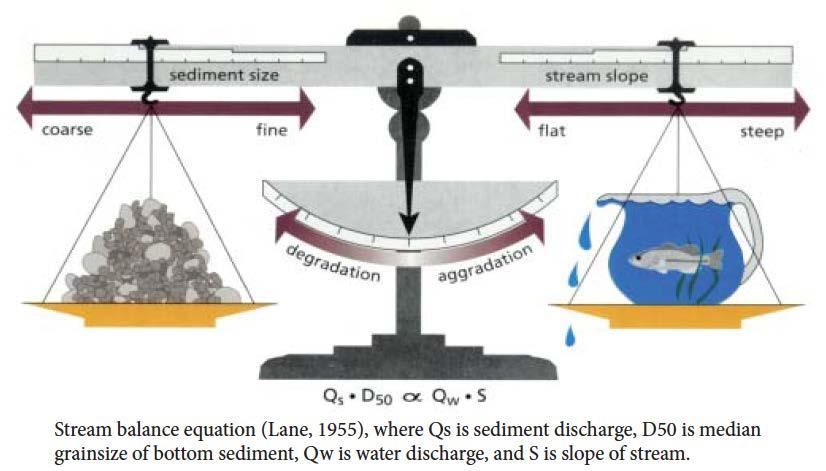
21 Monument Creek & Sand Creek Bed Material (USGS, 2007) Sand Creek Minimum streamflows in Fountain Creek and its tributaries have the capacity to transport sand-size particles; higher streamflows ranging from 0.28 cubic meters per second (m 3 /s) [9.9 cfs] to 17 m 3 /s [600 cfs] have the capacity to transport gravel-size particles (Mau and others, 2007) Monument Creek
22 Downstream of. Woodman Road Upstream of Power Plant Near Stratmoor
23 Fountain Creek at Fountain Fountain Creek at Pueblo
 Average Annual Sediment Discharge (tons) Pre - 1970 Post - 1980 Increase 106600 546000 439400 38600 183000 144400 68000 363000")
24 Annual Sediment Discharges for USGS Fountain Creek at Fountain & Pueblo Gauges - Based on Sediment Discharge Effectiveness Curves from CWCB 2009 Location Fountain Creek at Fountain Fountain Creek at Pueblo Difference (Deposition in Reach) Average Annual Sediment Discharge (tons) Pre Post Increase
25 1 acre-foot of imported water/year Supports 2 families of 4 Return Flows Added Runoff Impervious Area (0.25 ac) (for houses, roads, etc.) New water in Fountain Creek 0.6 ac-ft /yr ac-ft /yr ~ 0.85 ac-ft/yr
26 I. Assessment of Conditions in the Fountain Creek Watershed II. Hydrology and Sediment Transport III. Water Quality IV. Water Rights V. What Does This All Mean? VI. How to Address the Problems? VII. Summary of Issues


27 Arkansas River sample Fountain Creek sample Arkansas River below confluence sample
28
29 I. Assessment of Conditions in the Fountain Creek Watershed II. Hydrology and Sediment Transport III. Water Quality IV. Water Rights V. What Does This All Mean? VI. How to Address the Problems? VII. Summary of Issues
30
31
32 I. Assessment of Conditions in the Fountain Creek Watershed II. Hydrology and Sediment Transport III. Water Quality IV. Water Rights V. What Does This All Mean? VI. How to Address the Problems? VII. Summary of Issues
33 1. Major hydrologic changes in Fountain Creek started around 1980.
34 2. The hydrologic changes have created stream stability problems with Fountain Creek.
35 3. Imported water and urbanization in the watershed have caused an increase in streamflow and erosion.
36 4. The Fountain Creek regime is changing continually.
37 5. Frequently occurring low flows are responsible for much of the sediment transport in Fountain Creek.