Adrian Stocks Wisconsin DNR Wastewater Operations Director. Wisconsin s Multi-Discharger Phosphorus Variance
|
|
|
- Collin Cooper
- 5 years ago
- Views:
Transcription

1 Adrian Stocks Wisconsin DNR Wastewater Operations Director Wisconsin s Multi-Discharger Phosphorus Variance

2 Photo by: Rhonda Cain Carrell (Petenwell Lake)


3 Protecting Wisconsin s Waters Water Quality Standards for Phosphorus promulgated in 2010 Establishes acceptable P concentration in Wisconsin s waters Phosphorus limits included in permits 60% of point source discharges expected to need limits equal to standards Compliance schedules will be given for facilities to comply with these limits Several compliance options exist including trading, adaptive management Variances available if economically infeasible Rivers: 100 ug/l P Criteria NR Streams: 75 ug/l Reservoirs: ug/l Lakes: ug/l
4 Determining Need for MDV ACT 378 passed in 2014 Required DOA/DNR to determine if attaining TP water quality standards would cause a significant and widespread adverse social and economic impact If yes..then should submit application to EPA for a multi-discharger variance (MDV)
5 What is a multi-discharger variance? Covers multiple permit holders Same pollutant, same challenge, same/similar economics Historically used for mercury and chloride
6 Basics of the Phosphorus MDV Approved February 6, 2017 Not everyone is eligible Site-specific applications must be completed Watershed projects required Effective until February 5, 2027 MDV permit terms and conditions cannot extend beyond the MDV expiration date Several options to extend timeline


7 Benefits of the MDV Streamlined administrative process Clear implementation requirements Aggregated financial resources for NPS projects Provides time to mature working relationships
8 MDV Overview Reduce phosphorus discharge: reduce phosphorus load each permit term of MDV coverage AND Implement a watershed project that reduces nonpoint source phosphorus pollution: Implement watershed project directly; Work with a third party to implement a watershed project; or Make payments to County LCDs to implement ag practices (cost sharing + NR 151 compliance)
9 Socioeconomic Determination
10 Analysis of Impacts Wisconsin DOA contracted: -Sycamore Advisors -ARCADIS -University of Massachusetts Donahue Institute Reports developed: Economic Impact Analysis and Addendum to Economic Impact Analysis: Statewide Economic Impacts
11 Step 1. Determine Compliance Costs Facility by facility site-specific costs not determined Compliance Cost Determination Statewide, high level look Technology choice that would be appropriate across all sites for a given category Development of Cost Curve that can be used to estimate costs for all sites Method used in several other studies
12 Facility Breakdown Number of Permitted Facilities in each Type of Permittee Category Municipal WWTP: Mechanical 334 Municipal WWTP: Lagoon 91 Municipal Subtotal 425 Cheese 27 Aquaculture 10 Food Processing 14 NCCW/COW 59 Paper Mills 17 Power Plants 15 Other 25 TOTAL 592 A total of 592 permittees were expected to need to add phosphorus treatment technologies to meet more stringent phosphorus discharge limits, and were further evaluated in this study.
13 Cost Curve Example
14 Step 2. Determine Economic Effects of Incurring Costs REMI model University of Mass- Donahue Institute Combined discharges by category Regulatory costs by 2025 (absent MDV): at least 3,000 fewer jobs $184.1 million in wages forgone $478.9 million reduction in gross state product 7,500 fewer Wisconsin residents
15 Potentially Eligible Categories Municipal WWTFs and Lagoons Aquaculture Cheese Food processors Paper NCCW, NCCW/COW Other Industrial Dischargers Ineligible Power
16 Facility-Specific: Determine Eligibility Criteria Category of Discharge Primary Screener Secondary Score Municipal MHI>2% Secondary score must be 2 or higher Municipal 1%>MHI>2% Secondary score must be 3 or higher Industrial Must be in the top 75% of dischargers incurring costs within that category Must be located in a county that is within the top 75% of counties incurring costs for that category If both are met, a secondary score of at least 2 is needed to qualify If only one met, a secondary score of at least 3 is needed to qualify

17 Figure 8. Distribution of projected MHI values among municipalities that are incurring phosphorus compliance costs
18
19 Industrial primary screener thresholds based on 75 th percentile of discharges incurring costs within each category. Industrial Category 75% Threshold for Discharges Cheese Manufacturing $1,510,000 Food Processing $1,890,000 Paper $11,200,000 Aquaculture $2,600,000 NCCW $1,350,000 Other Industrial Discharges $959,000

20 Regional Economic Disparities

21 Secondary Screener e.g.- Jobs per Square Mile (WI = 50)
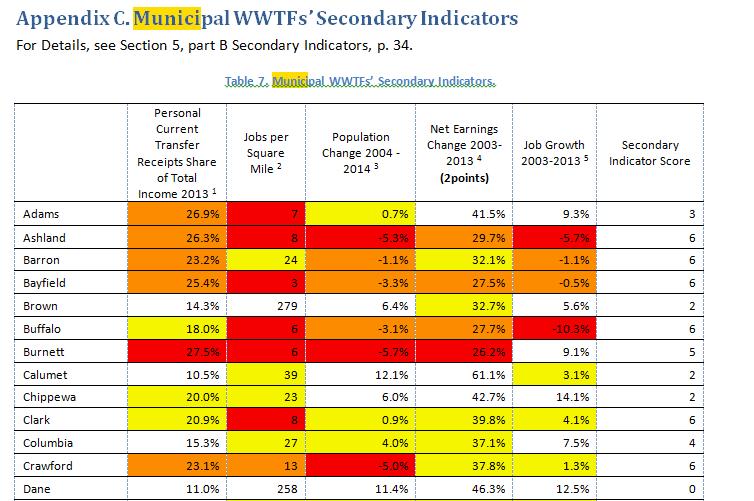
22 Appendix E. Cheese Manufacturers Secondary Indicators Table 9 Cheese Manufacturers Secondary Indicators Median Household Income in Thousands of Dollars 1 Personal Current Transfer Receipts Share of Total Income Jobs per Square Mile 3 Population Change Net Earnings Change (2 points) Job Growth Capital Costs as a % of Payroll 7 (2 points) Second-ary Indicator Score Adams % 7 0.7% 41.5% 9.3% -- 4 Ashland % 8-5.3% 29.7% -5.7% -- 7 Barron % % 32.1% -1.1% -- 7 Bayfield % 3-3.3% 27.5% -0.5% -- 7 Brown % % 32.7% 5.6% -- 2 Buffalo % 6-3.1% 27.7% -10.3% 2.56% 9 Burnett % 6-5.7% 26.2% 9.1% 0.82% 6 Calumet % % 61.1% 3.1% 0.82% 2 Chippewa % % 42.7% 14.1% -- 3 Clark % 8 0.9% 39.8% 4.1% 2.68% 9 Columbia % % 37.1% 7.5% -- 4
23 Implementation
24 Facilities submit application to DNR -WQBEL for TP included in permit reissued prior to 2014 when MDV becomes available -within 60 days after re-issuance -in permit application (re-issue)


25 Overview of MDV application Point sources apply on a facilityby-facility basis Must meet economic eligibility requirements Phosphorus compliance must require the need for a major facility upgrade
26 Interim Limit Determination DNR shall determine the appropriate interim limitations at time of permit reissuance Less Restrictive: Interim limits may not go above 1 mg/l (283.16(6)(am)) More Restrictive: Only applicable for point sources that have consistently achieved an effluent quality below interim limits Typical interim limits: Permit Term 1 Permit Term 2 Permit Term 3 Permit Term mg/l, monthly average 0.6 mg/l, monthly average 0.5 mg/l, monthly average MDV concludes TP WQBEL included in WPDES permit Separate EPA approval required
27 Overview of MDV Permit Conditions Annual Offset = Previous Annual Phosphorus Load Target Annual Load Point Source Comply with interim limits P99 or 0.8 mg/l then 0.6 mg/l, 0.5 mg/l WQBEL Watershed Project County payment option Annual payments of $50/lb P + inflation $640,000 /year cap Optimize Reporting Effluent data Cost verification form Direct offset OR Third-party offset

28 Watershed Projects


29 MDV it s not free. ANNUAL payments of $50/lb + inflation OR Must generate an ANNUAL phosphorus offset Annual payment cap=$640,000 Max payments over 1 permit term= $3.2M Total max. payment= $9.6M And then you do the facility upgrade
30 County Payment Option Payment= (Previous Annual Phosphorus Loading Target Annual Load) *$50/lb Annual payments go to participating county LWCDs in HUC 8 At least 65% of funds must be spent on agricultural performance standards in ch. NR 151 Must target highest contributing areas Up to 35% available for staffing, monitoring, and modeling expenses Plan and reporting requirements vary based on funding amount Example HUC 8 Watershed

31 Self Directed/Third Party Options Annual Offset= Previous Annual Phosphorus Loading Target Annual Load Any practice/project that produces a quantifiable reduction of phosphorus works Plan should specify how reductions will be met over permit term Watershed plan checklist helps ensure plans are suitable WPDES permit include annual reporting requirement
32 Example Timeline 2017 Fall 2017 January 1, 2018 Point sources receive permit with MDV Counties informed of funding projections County Participation Form due Funds received Watershed plan due Annual reports due until funding used March 1, 2018 March 1, 2019 May 1, 2020+
33 EXAMPLE: Calculating Annual Offset 1. Determine annual TP loading Facility A discharges 800 lbs in Subtract the target value (0.2 mg/l or TMDL target) 800 lbs/yr 200 lbs/yr = 600 lbs/yr 3. Multiple by $50 lb (+inflation) 600 lbs/yr *51.10 = $30,700 in 2020

34 MDV Funding Distribution Facility A payment in 2020: $30,700 Total MDV dollars available in 2020: $1.2 M Dodge= $24,250 Washington= $4,300 Waukesha= $2,150 79% 14% Dodge= $948,000 Washington= $168,000 Waukesha= $84,000 7%

 Documentation requirements Example HUC 8")
35 County Expectations Participation is voluntary At least 65% of funding needs to be spent on nonpoint source practices Remainder can be used for staffing, monitoring, and other funding needs Funding will be distributed to participating counties within the watershed (HUC-8) Documentation requirements Example HUC 8 Watershed
36 MDV Funds 2019 Projection 30 MDV Applications received this year 24 Facilities have been approved for MDV 1 under review 3 request more info 2 applications withdrawn 3 facilities have had permits re-issued in 2017 Total estimated MDV funds available in 2018 = $33, facilities will have permits re-issued in 2018 with MDV requirements Total estimated MDV funds = $1,080,000
37 MDV 2019 Projection (Assumes 9-12 months TP discharge in 2018) WPDES Facility HUC 8 Total Lbs Total $$ Abbotsford $1, Appleton Co $119, Auburndale $39, Bagley $15, Barneveld $62, Benton $24, Black River Falls $45, Blue River $6, Cadott $3, Colby $2, Domtar $189, Ellsworth $21, FFUSA-Chilton $12, Fond du Lac $347, Hillshire $15, Linden $5, Livingston $9, Milan $18, Patch Grove $10, Phillips City $5, Reedsburg $96, Rewey $7, Twin Lakes $13, Viroqua $6,366.26
38 Annual Report Requirements Practice information Location Description including performance standards addressed Photo and maps Pollutant(s) reduced Existing BMPs inspected Statement of overall progress towards plan goals Monitoring completed Financial breakdown (county payment option only)
39 Reviewing the MDV Overall Determination Timeline: Triennial Standard Review Process and by 2024 Focus: Technology or economic changes that may impact economic determination Highest Attainable Condition Timeline: No later than every 5 years and at time of permit reissuance Focus: Permit conditions Interim limits Optimization Watershed projects


40 Questions? Wisconsin Department of Natural Resources 101 S. Webster St. Madison, WI