Portland Climate Action Plan APA National Planning Conference April 13, Joe Zehnder Chief Planner Portland, OR
|
|
|
- Camron McBride
- 5 years ago
- Views:
Transcription

1 Portland Climate Action Plan APA National Planning Conference April 13, 2013 Joe Zehnder Chief Planner Portland, OR

2


3


4 1973 Oregon Senate Bill and 1990 Energy Policies 1980 Comprehensive Plan 1992 Waste Reduction Strategy 1993 CO 2 Reduction Strategy 2000 Green Building Policy 2001 Global Warming plan 2006 Renewable Fuel Standard 2007 Peak Oil Task Force 2008 Portland Recycles Plan 2009 Climate Action Plan 2012 Portland Plan

5 Climate Action Plan 2050 Goal: 80% emissions reduction 2030 Interim Goal: 40% emissions reduction 2030 Objectives 2012 Actions Climate Action in Portland 5
6

7 Climate Action in Portland 7
8
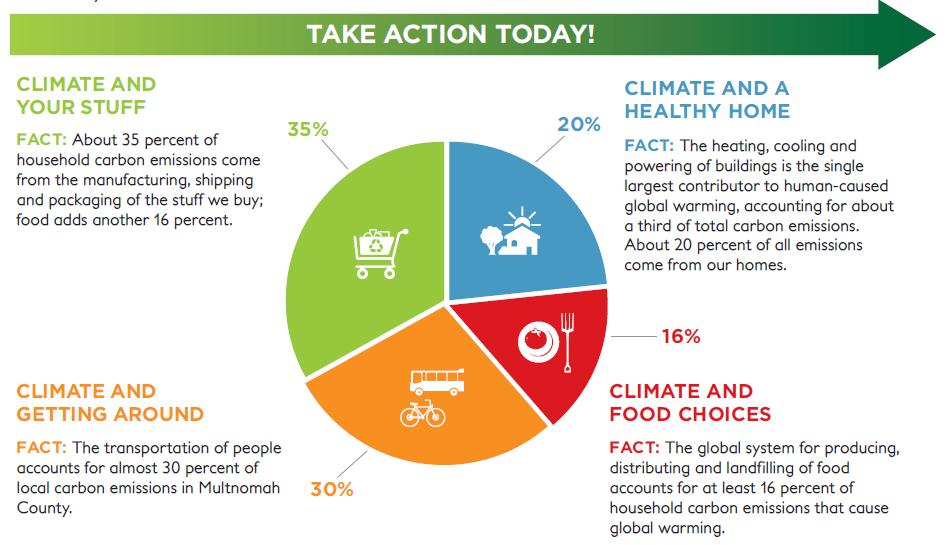
9 Community-wide CO 2 emissions (2010) Commercial Buildings 25% Industry 15% Transportation 38% Homes 21% Waste Disposal 1% Source: City of Portland based on utility data, state energy use reporting, gasoline tax records, and solid waste disposal

10 Eight Climate Action Areas


11 Reduce building energy use More on-site renewable energy Shift to low-carbon energy sources Climate Action in Portland 11

12 Clean Energy Works Residential energy retrofit program No up-front cost to homeowner Low-income households receive lowest interest rate Loan repaid on utility bill over 20 years Strong workforce agreement to ensure quality jobs and equity in hiring and training
13 Goal: 10 MW Solar by 2012 Since 2003, 2,151 total installs 400 % increase from Solarize Campaign By end of 2011, 15 MW installed


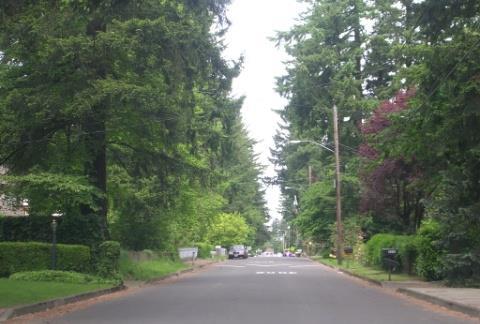
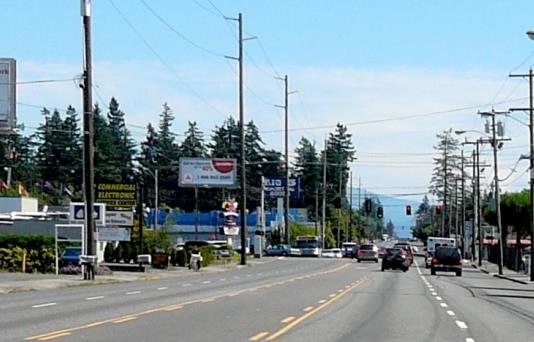
14 Urban Form and Mobility Carpool 8% Walk 4% Bike 8% 2008 Mode Split Transit 15% Drive Alone 65% ~19 VMT per capita Bike 25% Other 3% Drive Alone 29% 2030 Goal Walk 8% Carpool 10% Transit 25% ~13 VMT per capita
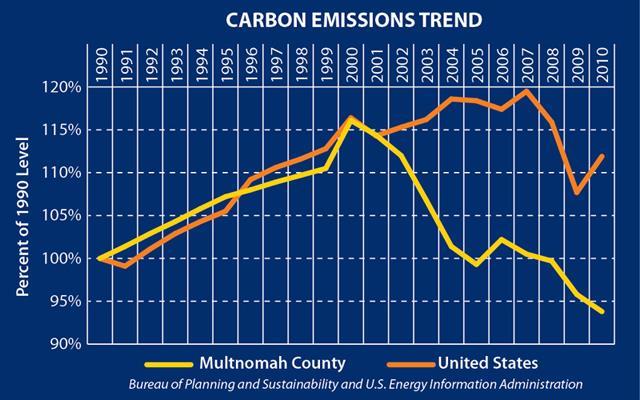
15 Daily vehicle miles per capita United States Portland Source: Metro
16 New residential collection program +180% +10% -38% Before After Composting Recycling Garbage Climate Action in Portland 16
17 Accomplishments since 1990 Most LEED Platinum buildings in US per capita Highest hybrid ownership in US per capita Transit ridership doubled Recycling rate more than tripled Bike commutes increased five-fold Vehicle miles traveled down 8% per capita (since 1995) Gasoline sales down 21% per capita Household energy down 10% per capita City facilities save more than $5.5M per year

18 Success is not just about energy and carbon ALIGNMENT: Portland Plan Comprehensive Plan Economic Development Strategy Watershed Management Plan Bicycle & Streetcar System Plans


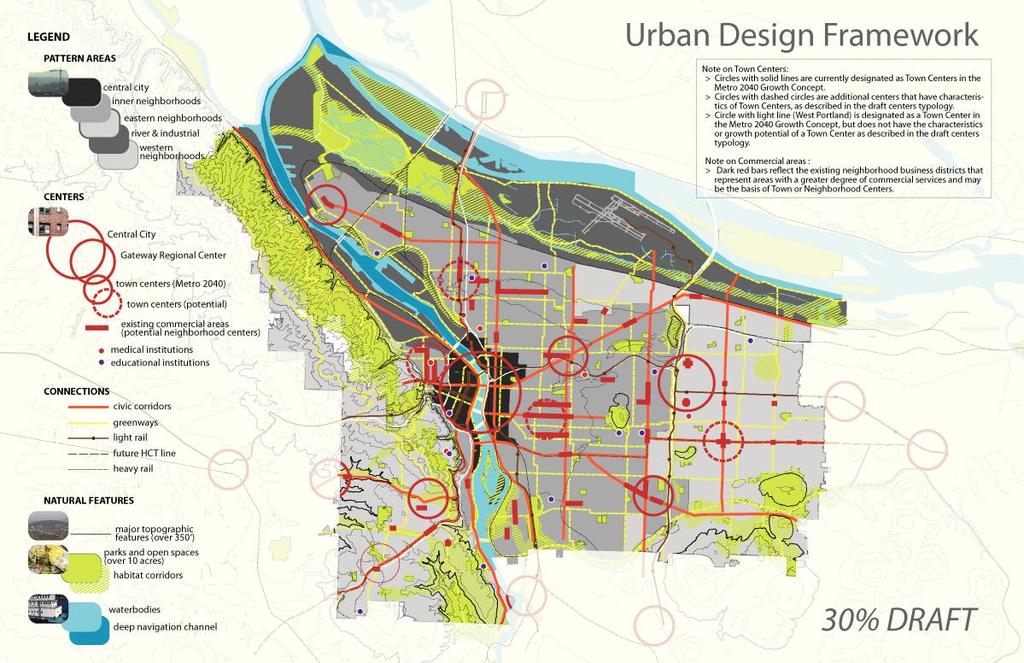
19 Pattern Areas* Natural Features Connections Centers*

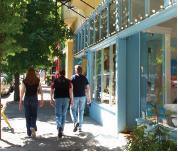
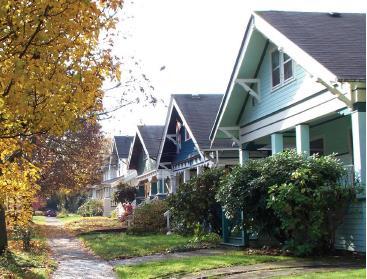
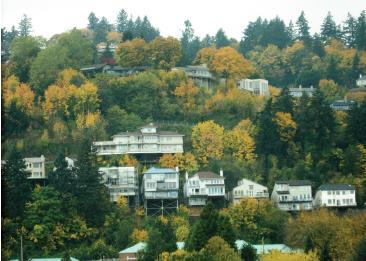

20 Five Pattern Areas
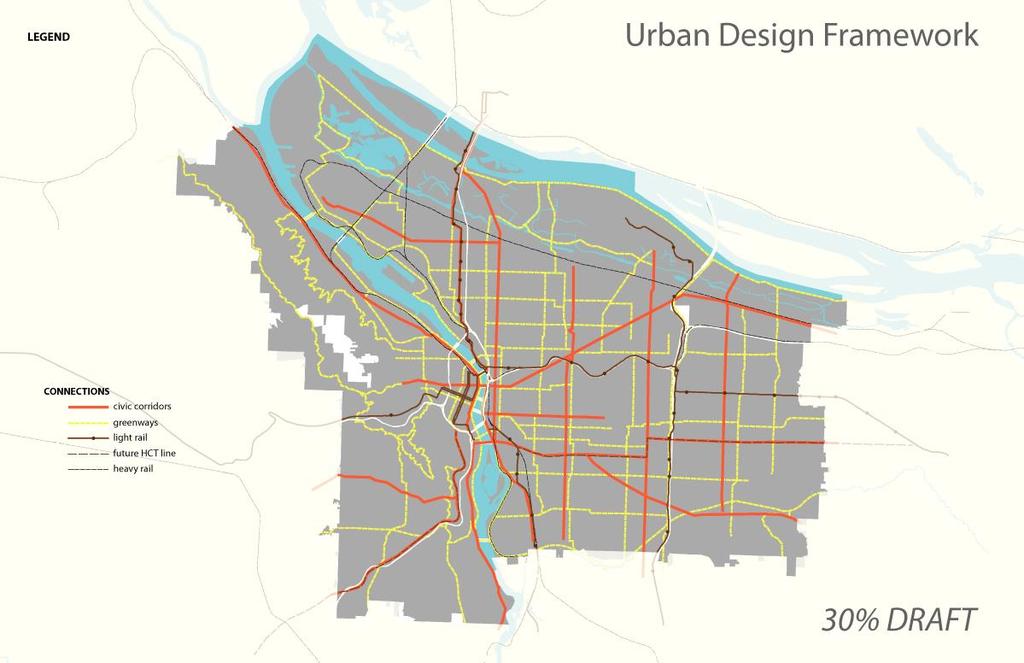
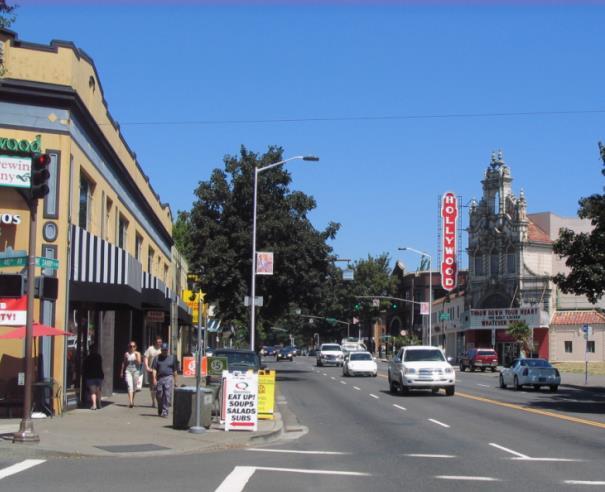


21 Connections Civic Corridors Greenways High-Capacity Transit Corridors

22 Access to Jobs Gentrification Risk Complete Neighborhoods Frequent Transit Low Stress Bike Network Parks Access Natural Area Watershed Health Tree Canopy Access

23 Gentrification Risk Gentrification Study 23
24 Planning & Sustainability Climate Action Plan Resources visit what we do Climate Action Plan link Michael Armstrong Michele Crim

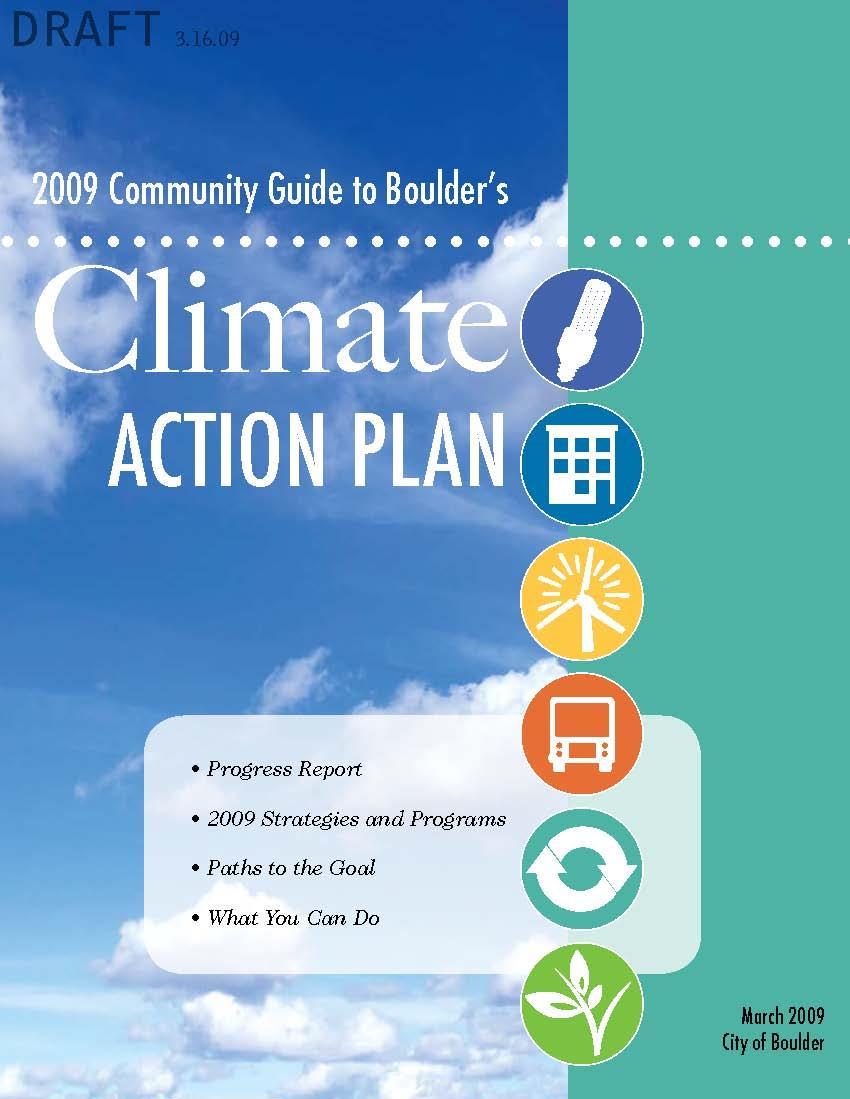
25 Climate Action Planning: A Community Perspective Chris Meschuk, AICP City of Boulder, Colorado April 16, 2013

26 Boulder, Colorado, USA
 ~59k daily in-commuters ~100k jobs / 6% unemployed 25 square miles of")
27 Boulder Basics 25 M from Denver 100k residents (300k in county; 4.3 million in front range urban area) ~59k daily in-commuters ~100k jobs / 6% unemployed 25 square miles of urban area 100 square miles of open space

28 Economic Basics University of Colorado Fed Labs: NOAA, NCAR, NIST, NREL Science, technology and aerospace Active living, natural/organic foods, digital media/internet, clean tech/green energy 6700 corporations and small businesses / 100,000+ jobs

29 Boulder s Sustainability Framework


30 Boulder s Community Sustainability The critical interrelationships among economic, social, and environmental health 6

31 Boulder has reached this beautiful sweet spot, where it has many advantages of a university town tech and talent and openness but without many of the costs and traffic and congestion that may disadvantage incumbent centers of innovation. Richard Florida


32 A Community of first s First to tax itself for the preservation of open space First mandatory green building requirements First Carbon Tax in US First SmartGrid 8

33

34

35 History of Boulder s CAP

36 Carbon Tax Currently generates approx. $1.8 million/yr Applies to all electricity customers in city No tax charged for green power customers Rates can be reset based on program needs Originally Sunset in 2012 Voters re-approved tax in Nov 2012 by 82% 12


37 Climate Action Plan Strategies Reduce barriers to energy efficiency and renewable energy Connect community with available rebates and tax credits Offer services not currently available in Boulder Support market transformation Education, outreach and community action 13

38 2012 Review of Climate Action Plan Effectiveness by Rocky Mountain Institute Backward Looking Review 1. Compared programs to selected municipal and utility programs 2. Assessed cost effectiveness of CAP funded programs current and lifetime 3. Provided preliminary input recommendations for program improvement
39 Review of Climate Action Plan Effectiveness - Findings Reductions are significant, but not enough to reach 2012 goal. Most of reductions yet to come. Programs similar to selected benchmarks in costeffectiveness, dependent on stage of development City of Boulder effectively leveraged CAP tax funding with additional grants Continuing CAP programs will drive significantly larger emissions reductions post startup


40 CAP PROGRAMS ARE PROFITABLE FOR BOULDER RESIDENTS *Platts Research and Consulting, Boulder CO


41 EnergySmart/SmartRegs are effective EnergySmart and SmartRegs are: Early-stage programs with expected increases in future savings totals Cost effective when compared to other CAP funded programs Comparable. despite immaturity, when compared to other municipal programs High leverage Commercial and Residential EnergySmart were largely funded through grants attained by City staff.

42 New Climate Commitment Beyond Kyoto What s Next? The best available science indicates we must reach neutrality before 2050 Addressing climate change is imperative A community-wide commitment 18
43 The next generation of climate action built on A new climate action commitment A community effort centered on engagement A living and dynamic process Tracking and reporting progress 5-year goals with 1-year targets Integration into existing city master plans and new Energy Action Plan


44 Climate Action Framework 20
45 Key take-a-ways 1. CAP s provide a compass heading, but need to be living documents 2. Program effectiveness needs ongoing evaluation 3. CAP s should balance voluntary and regulatory action 4. The plan should clarify whether the responsibilities are the city's or the communities 21

46
47 Contact Chris Meschuk