Germany s Success At Transforming Renewable Energy Markets. Ed Regan, PE AGM for Strategic Planning Gainesville Regional Utilities
|
|
|
- Randolf James
- 5 years ago
- Views:
Transcription
1 Germany s Success At Transforming Renewable Energy Markets Ed Regan, PE AGM for Strategic Planning Gainesville Regional Utilities
2 How is it that in Germany, with The solar incidence of Juneau, Alaska Half the electrical use per capita of the USA A fourth the population of the USA Was able to: Install 1,100 MW of photovoltaic capacity! (vs. only 205 MW in the USA) Gain major global market shares in solar (46%) and wind technology! Germany also leads the world in total export value (560% per capita greater than the USA) 2
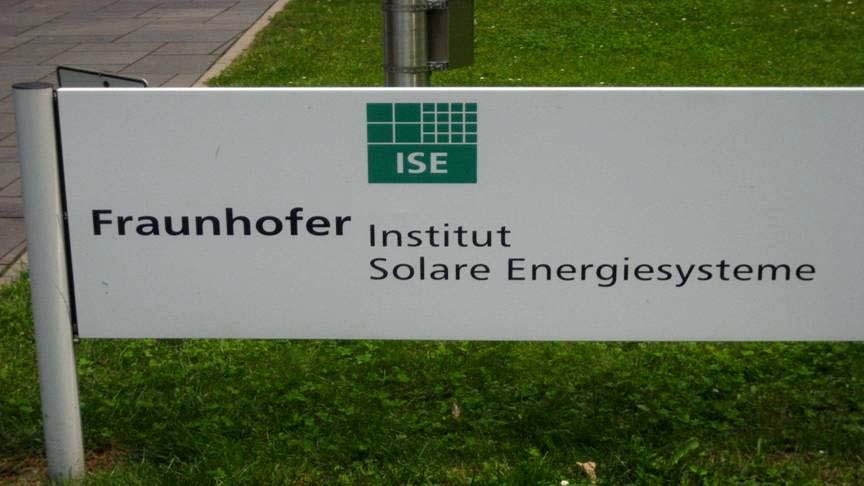
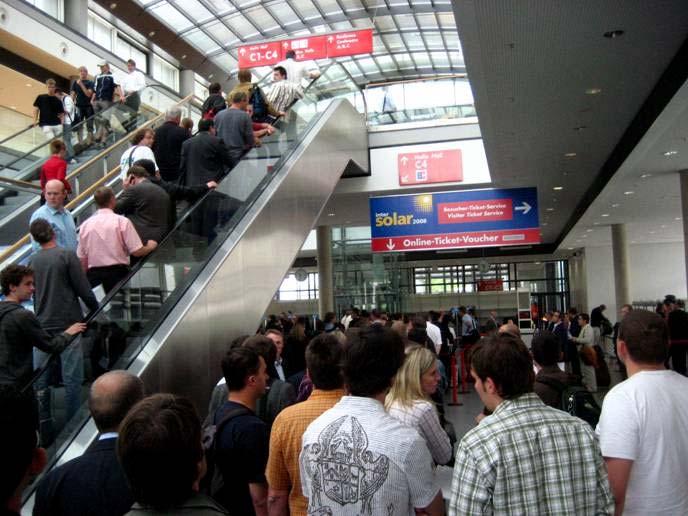
3 SEPA s Fact-Finding Mission to Germany SEPA Solar Electric Power Association Voluntary non-profit consortium of interested utilities and industries in the USA GRU a member Awarded Grants to Send a Team Of Utility Executives to Germany Trip Included Meetings and Tours Municipal and investor owned utilities A solar factory Major installations Engineers, designers, contractors, and investors The Fraunhofer Institute The 2008 InterSolar Trade Fair in Munich 3
4 Comparison of USA and Germany s Demographic and Energy Profiles Demographics a USA Germany Population (Million) Density (Population/Mile 2 ) Infant Mortality Rate Exports (Trillion Dollars/Year) $0.9 $1.4 Energy Use b - All Sectors b All End Uses (MMBtu/Capita-Yr Coal Comsumption (tons/capita-yr) Electricity (kwh/capita-yr) 12,800 6,600 Electrical Energy by Type c Connventional Thermal 71% 62% Hydro 7% 3% Nuclear 20% 24% Other Renewable 2% 11% Total 100% 100% a. World Almanac Data b. E.I.A International Statistics Tables E-1 and 1-4 c. E.I.A International Statistics Table 6-3 adjusted to

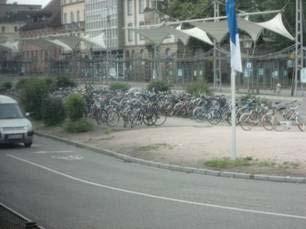

5 Transportation Is A Major Use Of Electricity 5


6 Lots of Wood Heat Still Being Used 6
7 The Answer Started with Germany s Problems Limited Domestic Fossil Fuel Supplies (except for coal) Three-Fourths of its Energy Supply was being Imported a The Highest Electrical Rates in the European Union 19 cents per KWh (euro) 30 cents per KWh (equivalent $ US*) In 2002, 73% * Based on 1.6 euro per US dollar 7
8 Germany s Question Was: NOT What s the best type of energy we can use? BUT What kind of energy do we have? Hard and Brown Coal Wind (most in the North) Biomass/Mine Gas Solar (most in the South) Hydro Geothermal (limited) 8
9 Germany s Underlying Concerns Need to Reduce Dependency on Imported Fossil Fuels CO 2 emissions harmful Finite resource High costs would cripple the economy Need To Speed Up Market Launch of Renewable Energies Wind Solar Biomass Geothermal Mine Gas Hydropower Quota Models Interfere With Market Dynamics High uncertainty of price Favors current technology Leaves out small players No innovative pressure High windfall profits Restrict capacity expansion a a. reaching quotas will reduce certificate values 9
10 Germany s Premises for Renewable Market Transformation System Design Must Provide Incentives for innovation Wide spread ability for consumers to participate Spread renewable cost to all kilowatt-hours Renewable Plant Operators Must Have Protected Rights Reliable payments for production Priority access to the grid Sufficient contractual term No caps on amount Grid Operators Have A Key Role Distribution utilities must meter & buy energy TSO balance & settle nation-wide Grid capacity to allow renewable expansion a priority State Must Facilitate Research 10


11 Aggressive R&D Program 11
12 Evolution of the Feed-In-Tariff (FIT) 1991: Stro Meinspeisungs-Gesetz AKA Str EG AKA Electricity Feed Act Opened access Minimum payments as % of retail rates Very successful for wind technologies 1998: Electric Industry Restructured Enabled postage T&D tariff 2000: Erneuerbare-Energien-Gesetz AKA EEF AKA Renewable Energy Sources Act 2004: EEG Amended Updated reference assumptions Reduced FIT for Wind Accelerated degression for some technologies 12
13 Structure of the German Electrical System Liberalized in 1998 (Retail Deregulation) Based on voluntary agreements Bundesnetz agentur formed in 2005 First form of Regulatory Commission Also Regulates natural gas Oversees FIT settlement and true-up Network Tariff set nation-wide System of: Energy Marketers Distribution Companies (grid operators) Transmission Service Providers (TSO s) Four Major TSO s RWE/VEW EON Energie Baden-Württemberg (EnBW) Vatten Fall (Swedish) Major Generation Companies as well 13
14 Feed In Tariff Design (FIT) The Feed In Tariff Equation (legislated) Reference System Cost + Profit = $ Probable KWh KWh Degression Legislated percent reduction in FIT per year Incentivizes innovation Grid parity by 2012 Term of FIT FIT in effect at start-up stays fixed over term 20 year term (hydro an exception) Grid Operators Must buy and settle revenues Provide grid capacity 14
15 Example Application: Photovoltaics (cents per KWh in euros) Start-up Year System Type On Building <30 KW KW >100 KW BIP System a Bonus Greenfield FIT in start-up year fixed for 20 years after year of start-up. -System need only be constructed to primary facilities. All other cost borne by grid operator. -Utilities eligible for FIT as well a. BIP Building Integrated Photovoltaic system for systems integrated into building facades. 15
16 Compare to Power Production Costs In Germany (2007) Cents/KWh Euros Cents/KWh $US System Average On Peak Contribution from FIT dollar per euro 16
17 FIT Rates Established For: (cents per KWh a in euros) Photovoltaic Roof Mount Greenfield Building Integration Biomass Residue & Wastes 9.46 Energy Crops b Combined Heat & Power b Innovative Technology b Landfill & POTW Gas 7.33 Wind Power Onshore - high wind 5.17 Onshore - low wind 8.19 Offshore - near 6.19 Offshore - >3 kilometers 9.10 Geothermal Small up to 10 MW 14.0 Large >10 MW 8.6 Hydro Electric Small (500kw) 9.67 Medium (5 MW) 6.65 Large (50 MW) 4.5 a mid range values show n. FIT typically varies due to capcity. b. Biomass bonus added to base FIT 17
18 Other FIT and Energy Development Considerations Certain Industries Exempted From FIT Cost Collection Energy intensive manufacturers 10 GWH per hour per location (1 MW average load) Assures international competitiveness Facilities In Conservation Areas Not Eligible Wind Hydro not at pre-existing locks or weirs PV not on fallow or dual-use lands Subsidies Legislated For Hard Coal Development $3.6 billion euros 2005 Down to $2.3 billion euros 2012 Brown coal (lignite) feasible without subsidies 18


19 Solar Factory 19


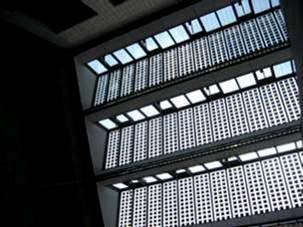
20 Facades and Skylights 20


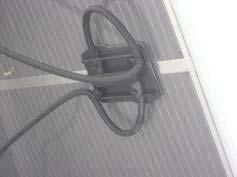
21 Solar Shingles and Systems for Tile Roofs 21


22 Active and Passive Solar Design 22


23 Examples of BIP Installations 23

24 Notice The Bicycle Sheds! 24

25 Large Roof PV System 25

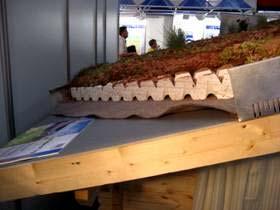
26 Even Green Roofs 26

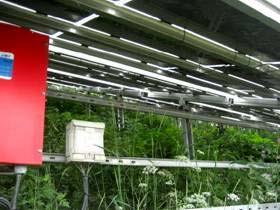
27 Landfill Energy Farm 27
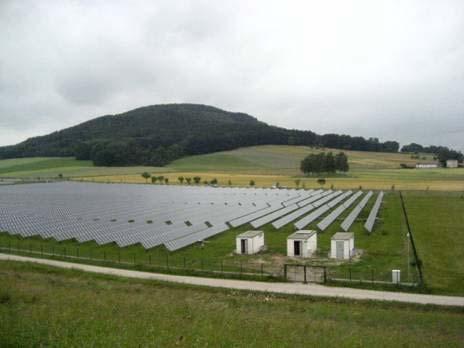
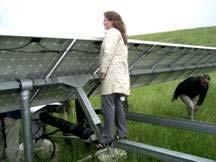
28 Greenfield Tracking Array 28


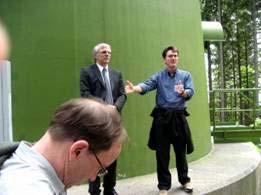
29 Black Forest Wind Turbines 29

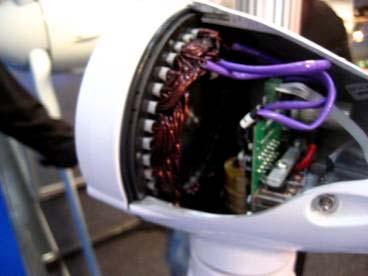
30 Major Gains In Turbine Technology 30


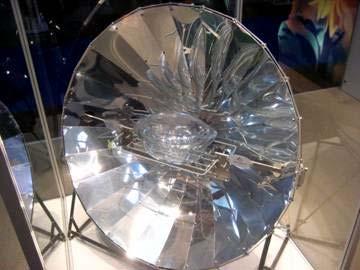
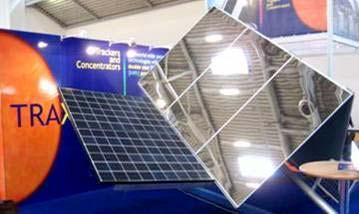
31 Concentrator Systems 31

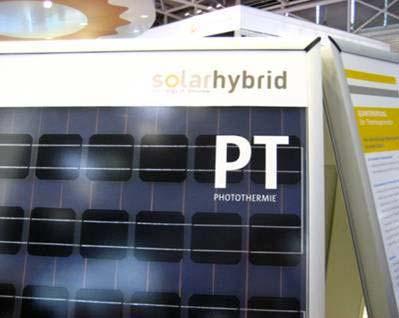
32 Thermal and Hybrid 32

33 Flexible Systems 33

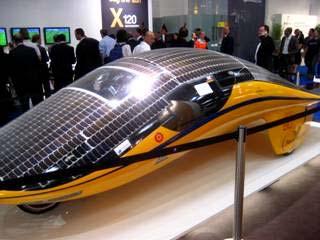
34 New Forms and Ideas 34
35 The Results: Renewable Energy Harvests In Germany (2007) Photovoltaics, 4% Bioenergy (solids), 8% Biogas, 11% Wind, 48% Bioenergy (liquid), 2% Geothermal, 0.1% Hydro, 27% Renewable Energy Production: 86.7 TWH, 14.3% of Electrical Consumption 35
36 GERMANY'S CO 2 EMISSION TARGETS (Set by European Union) 900 Fossil Fuel Emissions CO2 avoided by Renewable Energy 2006 Actuals million tonnes emitted million tonnes avoided Million Metric Topnnes CO2 per Year SOURCE: German Federal Ministry for the Environment, Nature Conservation, and Nuclear Safety 36
37 Additional Perspectives 18 Other European Nations Have FIT - Turkey - Luxemburg - Estonia - France - Denmark - Latvia - Spain - Czech Republic - Lithuania - Portugal - Austria - Finland - Ireland - Hungary - Greece - Netherlands - Slovenia - Cyprus Six USA States have FIT - California - Minnesota - Michigan - Rhode Island - Illinois - Hawaii 37
38 Benefits of Germany s FIT Program 230,000 Employed in Renewable Energy Industry $23 Billion Euros/Year Industry Major Global Market Share Technology Leaders Turbines Panels Inverters National Benefit To Cost = 2.8:1 Reduced Carbon Emissions Improved the Economy Improved Energy Security Enhances Long-teem Affordability 38

39 Jobs and Opportunity 39

40 Thank you 40