HMP 101 Hydromodification Management Plan for Santa Clara Valley Guidance for Local Implementation
|
|
|
- Darlene Greer
- 5 years ago
- Views:
Transcription
1 HMP 101 Hydromodification Management Plan for Santa Clara Valley Guidance for Local Implementation Jill C. Bicknell, P.E., EOA, Inc. Assistant Program Manager EOA, Inc. GeoSyntec Consultants
2 Presentation Overview What is Hydromodification? Permit Requirements for Hydromodification Control Basic Concepts in HMP Development Flow Duration Basin Sizing Examples HMP Report: Performance Criteria Implementation Guidance Progress and Next Steps
3 What is Hydromodification? Change in the runoff hydrograph (flow pattern) from an area due to development Impacts of land development: Increase in impervious surface Decrease in amount of vegetation Grading and compaction of soils Construction of drainage facilities
4 What is Hydromodification? (continued) Effects of land development on the site runoff hydrograph: Less infiltration / evapotranspiration More surface runoff (increased volume) Runoff leaves the site faster (increased peak flows) Runoff occurs more often (increased duration) Runoff conveyed directly to creek (increased connectivity)
5 Hydromodification Control Requirements SCVURPPP Permit Provison C.3.f.i.: Increases in runoff peak flow, volume, and duration shall be managed for all Group 1 Projects*, where such increased flow and/or volume can cause increased erosion of creek beds and banks * Group 1 = > 1 acre impervious surface
6 Hydromodification Control Requirements, continued SCVURPPP Permit Provison C.3.f.i.: Post-project runoff shall not exceed estimated pre-project rates and/or durations, where the increased stormwater discharge rates and/or durations will result in increased potential for erosion


7 Segment 5 Stable stream, bed close to old tree


8 Segment 4 Channel incision on Yerba Buena Creek


9 Segment 1 Undermining outfall protection structure
10 Pre- and post-project project runoff characteristics Peak Q, cfs Future Peak Q Existing Peak Q Pre-Urban Peak Q All Events Flood Frequency Return Period, months
11 Flow Duration Histograms Histogram of Discharge from the 716 Acre Test Subcatchment year Peak Flow 5-year Peak Flow 10-year Peak Flow Pre-Project Discharge Post-Project Discharge 1000 Post-Project w/control Frequency (hours) Flow Bin (cfs)
12 Effective Work Index (W) Range of Geomorphically Significant flows Stream Flow Characteristics of Bed and Bank Materials τ c Qc τ cbed τ bi W n = i= 1 ( τ τ ) V Δt bi c 1.5
13 Erosion Potential (Ep) Shear Stress τ c Ep = W W post pre Post-Urban Pre-Urban Effective Work Done Time: 50-year record
14 Cumulative Work Index Work Index (W) ( τ τ ) V Δt Existing Watershed Conditions Pre-Urban Watershed Conditions Discharge (cfs) W n = i= 1 bi c 1.5
15 Range of Storms to Manage (Set of Design Storms) Qc to the 10-year event Percentage of Total Work Done 100% 90% 80% 70% 60% 50% 40% 30% 20% 10% 0% 2-Year Peak Flow 5-Year Peak Flow 10-Year Peak Flow Flow (cfs)
16 Summary of Estimated Critical Flow Values Subwatershed and Reach Thompson Creek J-1 J-5 J-12 Yerba Buena YB-6/7 YB-2/4 Ross Creek J-1 J-5 Estimated Qc Critical Flow in Stream (Qc, cfs) Percent of 2-Year Peak Flow in Stream % of 2-year peak
17 Elements of a Flow Duration Overflow Control Basin Stream Discharge Zone B Flow Duration Matching Inflow Qcp Zone A Capture Volume Infiltration, diversion, by-pass, etc. Overflow Qcp = 10% of pre-project 2-year peak flow Row 2 Row 1 Diverted to on-site retention, infiltration, by-pass, etc. Qcp Discharge to stream
18 Examples of Flow Duration Basin Sizing Thompson Creek 716 acres, D soils, mixed use, 71% impervious San Jose Example 3.6 acres, D soils, residential, 45% impervious Alameda County Example 12.2 acres, B soils, commercial, 67% impervious
19 Flow Duration Curves FLOW (CFS) Thompson Creek Flow Duration Control Results Pre-Urban Runoff to Stream Post-Urban Runoff to Stream Discharge w ith Control HOURS OF FLOWS HIGHER OR EQUAL TO Q
 10% (7% catchment) Drain time 3 days < 1 day 1 day 90% of the time Qcp (low flow) 2.4 cfs 0.1 cfs 0.25 cfs Infiltration Rate 0.2 in/hr 0.2 in/hr 0.5 in/hr (5.5 cfs) (0.")
20 Flow Duration Basin Sizing Results Thompson San Jose Alameda Basin Depth 4 feet 2.25 feet 2 feet Basin Area 30 acres 0.06 acres 0.8 acres Basin Size %DCIA 5.7% (4% catchment) 3.7% (1.7% catchment) 10% (7% catchment) Drain time 3 days < 1 day 1 day 90% of the time Qcp (low flow) 2.4 cfs 0.1 cfs 0.25 cfs Infiltration Rate 0.2 in/hr 0.2 in/hr 0.5 in/hr (5.5 cfs) (0.012 cfs)
 Implementation Options Guidance for Selection and Design of Hydromod")
21 HMP Report Stream Assessment Method Technical Analyses Management Standard and Performance Criteria Applicability Criteria (Exemptions) Implementation Options Guidance for Selection and Design of Hydromod Control Measures
22 HMP Timeline Report completed April 2005 Key Provisions adopted as part of July 2005 permit amendment Implementation required to begin October 20, 2005 Changes in Municipal Regional Permit, end of 2006?
 measures effective in reducing flow, use to supplement flow duration")
23 Control Strategies Peak flow control - not effective for erosion control (low flows matter) Single event/design storm approaches not adequate hydromod control Flow duration control - recommended Maintain magnitude and duration of postproject flows same as pre-project Considers multi-year discharge record Site design (LID) measures effective in reducing flow, use to supplement flow duration control facility
24 Key Provisions: HMP Management Standard Stormwater discharges from a nonexempt, Group 1* development project shall not cause an increase in the erosion potential of the receiving stream over the pre-project (existing) condition Ep 1.0 *Group 1 = projects that create or replace 1 acre or more of impervious surface
25 Performance Criteria Meet management standard with flow controls (may include a combination of on-site, off-site and in-stream measures). On-site controls that are designed to provide flow duration control to the pre-project condition are considered to comply with the HMP. Design flow duration controls to match preand post-project flows and durations from 10% of the pre-project 2-year peak flow to the pre-project 10-year peak flow.
26 Performance Criteria, cont. Off-site or in-stream controls may be implemented to address potential project impacts in lieu of or in combination with on-site controls Need approved and funded plan in place The off-site or in-stream controls or combination of controls shall be designed to achieve the management standard of Ep 1.0.
27 Performance Criteria, cont. If on-site measures are not practicable, or project site is less than 20 acres: Can use site design & treatment controls to comply with the HMP to the MEP Must contribute to off-site or in-stream control if option is available Measures considered practicable if construction cost of treatment + flow controls is 2% of project cost (excluding land).
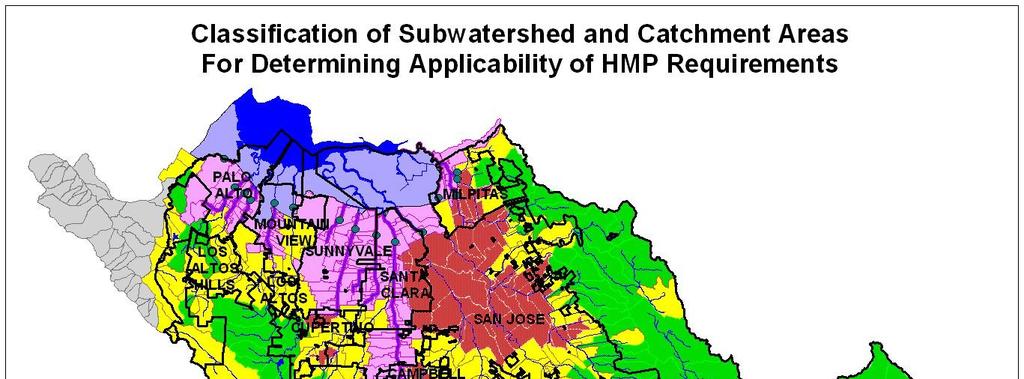
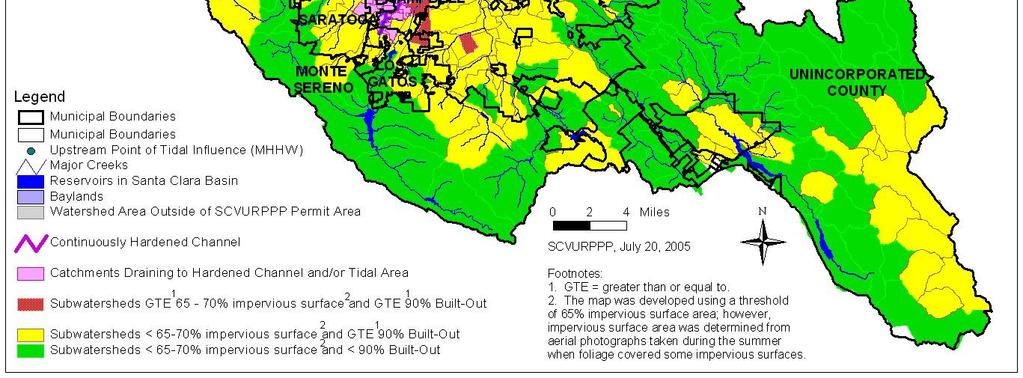
28 Exemptions Projects that will not cause flow rates, volumes, or durations to increase (e.g., no increase in impervious area from existing condition) Projects that discharge to tidal area, channel continuously hardened to the Bay, or directly to the Bay Projects that are infill projects in highly developed watersheds For exempt projects, recommend use of site design and treatment BMPs to reduce flows
29


30 On-Site Options Use site design techniques to reduce runoff flow and volume Decrease impervious surface area Disconnect impervious areas Promote infiltration Select treatment BMPs that reduce volume swales, detention areas, bioretention, green roofs
31 On-Site Options, continued Construct flow control structures Retention/detention basins Underground vaults/tanks Combine flow control with flood control and/or treatment facilities Examples: detention basin, wet pond, constructed wetlands
32 Integrating Flow Duration Control (FDC) with Other BMPs FDC Basin Urban Runoff FDC Basin Bio-infiltration infiltration Swale Stream FDC Vault Bio-infiltration infiltration Swale On-Site BMPs LID


33 Off-Site and In-Stream Off-site (regional) Options Regional detention basins Bypass pipelines In-stream Grade controls Bank stabilization Flood plain/channel restoration
34 Process for Evaluating Hydromod Requirements Determine applicability of HMP Applicability of C.3. Increase in impervious surface? Ultimate discharge point of project Infill project in highly developed wshed? If not exempt, evaluate mitigation with site design If can t mitigate impacts, need to analyze pre- vs. post-project runoff patterns
35 Process for Evaluating Hydromod Requirements Hydrologic Analysis Generate pre- vs. post-project flow duration curves using hydrologic model Continuous simulation required Available models: Corps of Engineers HEC-HMS EPA HSPF EPA SWMM Bay Area Hydrology Model (under development)
36 Remaining Implementation Challenges Feasibility of on-site options Feasibility of in-stream options Integration of site design, treatment and flow control measures Uncertainty of HMP requirements Range of design flows Exempt areas Small project exemption
37 Next Steps Provide guidance and training to municipal agencies and developers Work with Santa Clara Valley Water District on in-stream options Complete development of the BAHM Work with other Bay Area stormwater programs and RWQCB on consistent performance criteria for the region

38 Bay Area Hydrology Model
39 Design Challenges Challenge #1: Flow duration control design Requires use of continuous simulation hydrologic model Use of these models is data intensive and time consuming Lack of knowledge and experience Challenge #2: Integrating flow controls with site design and treatment controls How to estimate flow reduction benefits of other BMPs How to estimate treatment capability of flow control facility
40 Overview of the BAHM BAHM (Bay Area Hydrology Model) uses the EPA HSPF computational engine and WWHM (Western Washington Hydrology Model) software platform. BAHM hydrology parameter values are derived from locally calibrated watersheds.

41 Developed for the Washington State Department of Ecology. WWHM Used in the 19 counties of Western Washington.
42 BAHM Designed for the San Francisco Bay Area Alameda County Santa Clara County San Mateo County Jointly funded by the three counties stormwater programs
43 BAHM Components user-friendly graphical interface automatically loads appropriate parameter values and meteorological data based on project location uses long-term (30+ year) local precip records and scales precip based on ratio of project site MAP and precip gage MAP

44 BAHM Graphical interface: Project Site

45 BAHM Graphical interface: Pre-Project Land Use Based on soil, vegetation, land slope, impervious area
46 BAHM Graphical interface: Post-Project Land Use Based on soil, vegetation, land slope, impervious area

47 BAHM Graphical interface: HMP Facility Pond, tank, vault, gravel trench bed, bioretention
 pond dimensions to meet HMP flow duration")
48 BAHM Graphical interface: Runoff Analysis AutoPond optimizes (minimizes) pond dimensions to meet HMP flow duration criteria

 Alameda Creek (33.5 sq.mi.")
49 BAHM Parameter Development Calibration of local hydrologic parameter values for Alameda County watersheds completed Castro Valley Creek (5.5 sq.mi., urban, dry weather flows) Alameda Creek (33.5 sq.mi., rugged and undeveloped) Represent range of conditions in County
50 BAHM Parameter Development Calibration of local hydrologic parameter values for Santa Clara Valley (ongoing) Thompson Creek Ross Creek Represent watersheds modeled for development of HMP report, in different climatic/geologic regions of the Valley San Mateo County will use parameter values from Alameda and Santa Clara

51 BAHM Parameter Development Comparison of simulated and observed Castro Valley Creek streamflow
52 BAHM Parameter Development Comparison of simulated and observed Alameda Creek streamflow

53 WWHM Application Examples Commercial site: Costco store, Woodinville, WA (14.38 acres); discharges to critical salmon habitat

54 WWHM Application Examples Costco Store Solution: 6 acre-feet of underground storage in 5,240 lf of 96-in diameter pipe 6 inches dead storage for initial treatment Stormfilter unit for additional treatment


55 WWHM Application Examples Planned community: Snoqualmie Ridge, King County, WA (1,343 acres; 2,200 homes plus business park and retail space)


56 WWHM Application Examples Snoqualmie Ridge Solution: 10 stormwater ponds ranging in size from 2 to 20 acre-feet Ponds incorporated into residential neighborhoods and golf course
57 Conclusion BAHM will facilitate compliance with HMP and design of flow control facilities in the Bay Area by providing: An easier, standardized way to do continuous simulation modeling A means to compute flow control benefits of site design/lid and treatment measures Standardized reporting to assist municipal staff in design review
58 For More Information... Visit our website at: Click on C.3. Products