Quantified analysis of flood risk at a basin scale in China
|
|
|
- Dennis Ryan
- 5 years ago
- Views:
Transcription

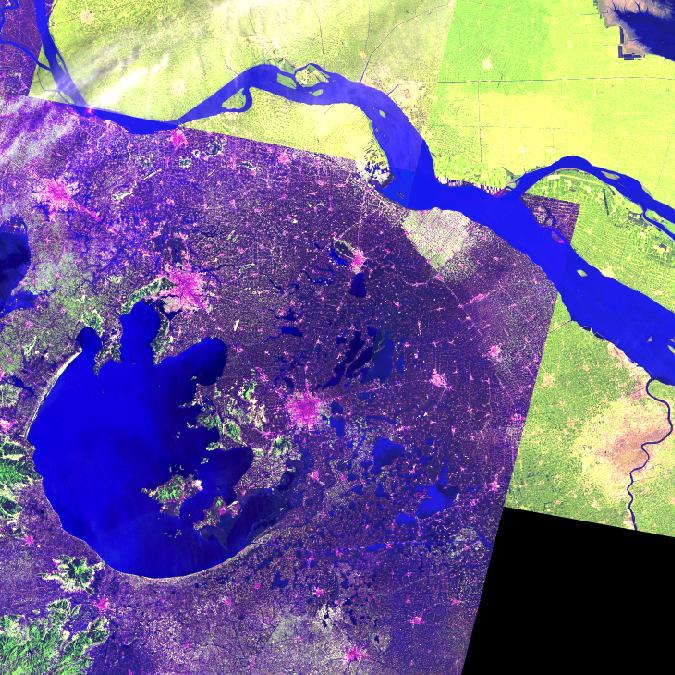
1 Quantified analysis of flood risk at a basin scale in China Jim Hall, Newcastle University, UK Taihu Basin GDP: 11.6% Pop.: 55.3M (3.5%) Area: 0.4%


2


3 Conceptual model of flooding in the Taihu Basin The polder systems 2374 polders

4 Conceptual model of flooding in the Taihu Basin Recorded flooding 1999


5 Flood management in the Taihu Basin Challenge: Sustainable flood risk management in a rapidly developing region Questions How might the risks of flooding change in Taihu Basin over the next 50 years? Urbanisation and economic development Climate change Deliberate and unplanned water management Land subsidence caused by over pumping How does flooding interact with other water management issues e.g. water quality? How do flood risk management options perform in the long term Background March 2005: scoping mission 20 December 2005, Sir David King, the UK Government Chief Scientific Advisor visits Beijing to promote the project In the 4th UK/China Science and Technology Joint Commission meeting in Beijing on 28 April 2006, both sides of China and the UK agreed that the project should be implemented as a flagship project in the field of environmentally sustainable development. Ten UK experts visited Beijing and Taihu basin again during Nov.16 Dec. 3, gave lectures in MWR, and formed a draft of implementation program. At the end of 2006, the MST approve this 3-year cooperation research project.
6 Project team China: Institute of Water Resources and Hydropower Research Taihu Basin Authority Beijing Normal University Chinese Academy of Social Science UK Nottingham University Newcastle University Middlesex University University of East Anglia HR Wallingford CEH Wallingford Halcrow Met Office Hadley Centre Technical framework WP1:Qualitative analysis of Drivers & Responses WP2:Climate change scenarios WP3:Hydrological modeling WP4:Socio-economic scenarios WP5: Flood damage data and models WP6: Broad-scale hydraulic model WP7: Reliability analysis of dike system WP8:GIS based quantified risk analysis system
7 Qualitative ranking of drivers of future change Tab1-4 Ranking of Importance of Drivers in the Future Scenarios A2/A2 B2/NP A2/A2 B2/NP 2020S 2020S 2050S 2050S 1 Economy development Plum rain Plum rain Plum rain 2 Urbanization Storm Sea level rising Sea level rising 3 Plum rain Economy Economy development development Storm 4 Sea level rising Urbanization Storm Marine storm surges 5 Storm Sea level rising Marine storm surges Waves 6 Stakeholders Marine storm surges Stakeholders Economy development 7 Land use polder polder Temperature change 8 pump station in polder Land subsidence pump station in polder Land subsidence 9 Land use Waves Land use inward river gates 10 Marine storm surges Temperature change Urbanization inward river dike 11 Land subsidence inward river gates Waves Land use 12 inward river gates inward river dike inward river gates Urbanization 13 inward river dike polder inward river dike polder 14 Waves pump station in Land subsidence pump station in polder polder 15 Temperature change Stakeholders Temperature change Stakeholders Climate change scenarios PRECIS regional climate model established and validated Location of stations providing observed precipitation data (closed dot) and the corresponding PRECIS grid-box centres for those grid-boxes in the Taihu basin (open triangles) and adjacent ocean areas (closed triangles).
 Taihu water level (m) 5 4.")
8 Hydrological modeling A VIC hydrological model has been developed that is able to offer the runoff from mountain area as boundary conditions and net rainfall for the hydraulic model in plain area Spatial distribution of annual average precipitation and annual average runoff depth during under A2 scenario Hydrology Rainfall (mm/day) Taihu water level (m) Rainfall Days from 1 June 1999


 channel links")
9 Broad-scale hydraulic model A broad scale hydraulic model is developed on the base of ISIS to meet the needs of flood risk analysis in the Taihu Basin 太湖 实测计算 The model has been validated by the observed data of the 1999 flood. Yangtze water level boundaries Key/aggregated sluices/pumps represented Hydrological inflow nodes from hilly areas Taihu lake storage unit 1000 to 2000 nodes Simplified (aggregated) channel links Tide boundaries Direct net rainfall into lakes & local storage as fn(p, ET, land cover)

10 Recorded and modelled flooding 1999 Reliability analysis of dike system The reliability analysis method of dike system has been well recognized Example of fragility curve
11 Socio-economic change (E+08 YUAN) GDPi n Tai hu Basi n 1980 年 1990 年 2000 年 2003 年 ZHENJI ANG CHANGZHOU WUXI SUZHOU SHANGHAI HANGZHOU JI AXI NG HUZHOU GDP Urban Const ructed Area ( km2) WUXI CHANGZHOU Urban Income Per capi t al di sposabl e i ncome of ur ban househol ds ( yuan/ capi t al ) SHANGHAI HANGZHOU Socio-economic scenarios Social and economic scenarios ( ) have been provided for the future flood risk analysis in Taihu Basin in light of the climate change scenarios (A2, B2) and the National Programmes scenario (NP) base A2 NP B Current and projection of total population of 8 cities of Taihu (10000 person) Growth rate (2000~2050): A2(8.6 ), NP(3.5 ), B2(3.3 )


12 Flood damage data and models A flood damage assessment model has been developed that offers a technical tool for future flood risk analysis 0.5 Flood loss rate Business inventory Industry fixed assets Industry inventory Residential content Water depth (m) Flood depth-loss rate curve of Shanghai Business fixed assets Residential fabric Quantified risk analysis system A GIS-based flood risk analysis system has been primarily developed Simulation of inundated areas and distribution of water depth Land use value per square kilometer obtained by GIS
13 EAD various scenarios baseline FRM assumption EAD (billion Yuan) No breach Breach A2 (S-E) B2 (S-E) A2 (C-C) B2 (C-C) A2 (CC)/ A2 (SE) B2 (CC)/ A2(SE) B2 (CC) / NP(SE) A2 (CC)/ A2 (SE) A2 (CC)/ NP(SE) Baseline 1999 Baseline changes socioeconomic only 2050 changes climate change (rainfall) only 2050 changes combined 2050 changes combined plus SL rise Adaptation strategy Using risk assessment to target investment in dike improvement and flood water management Accounting for a range of future changes and identifying robust solutions Promoting systems approaches that account for interactions and interdependencies Integrated water management, that addresses water quality and water resources at the same time as flood risk
14