GEOTECHNICAL REPORT CARSON FREEWAY CLEARVIEW DRIVE GRADE SEPARATION CARSON CITY EA DECEMBER
|
|
|
- Abraham Tyler
- 5 years ago
- Views:
Transcription


1 GEOTECHNICAL REPORT CARSON FREEWAY CLEARVIEW DRIVE GRADE SEPARATION CARSON CITY EA DECEMBER 2003 MATERIALS DIVISION
2 STATE OF NEVADA DEPARTMENT OF TRANSPORTATION MATERIALS DIVISION GEOTECHNICAL SECTION GEOTECHNICAL REPORT CARSON FREEWAY CLEARVIEW DRIVE GRADE SEPARATION December 2003 E.A Fund 1 CARSON CITY, NEVADA Prepared by: Dana Boomhower, P.E. Senior Materials Engineer - Geotechnical Reviewed by: Jeff Palmer, Ph.D., P.E. Principal Geotechnical Engineer Approved by: Dean Weitzel, P.E. Chief Materials Engineer
3 TABLE OF CONTENTS INTRODUCTION...1 General...1 Purpose and Scope...2 PROJECT DESCRIPTION...2 GEOLOGIC CONDITIONS and SEISMICITY...3 FIELD INVESTIGATION...4 LABORATORY ANALYSIS...5 DISCUSSION...5 RECOMMENDATIONS...6 REFERENCES...9 APPENDICES APPENDIX A...Site Plan...Borehole Location Sheets APPENDIX B...Boring Log Key...Boring Logs APPENDIX C...Soil Particle Size Distribution Sheets (Gradation Curves)...Test Result Summary Sheets ii
.")
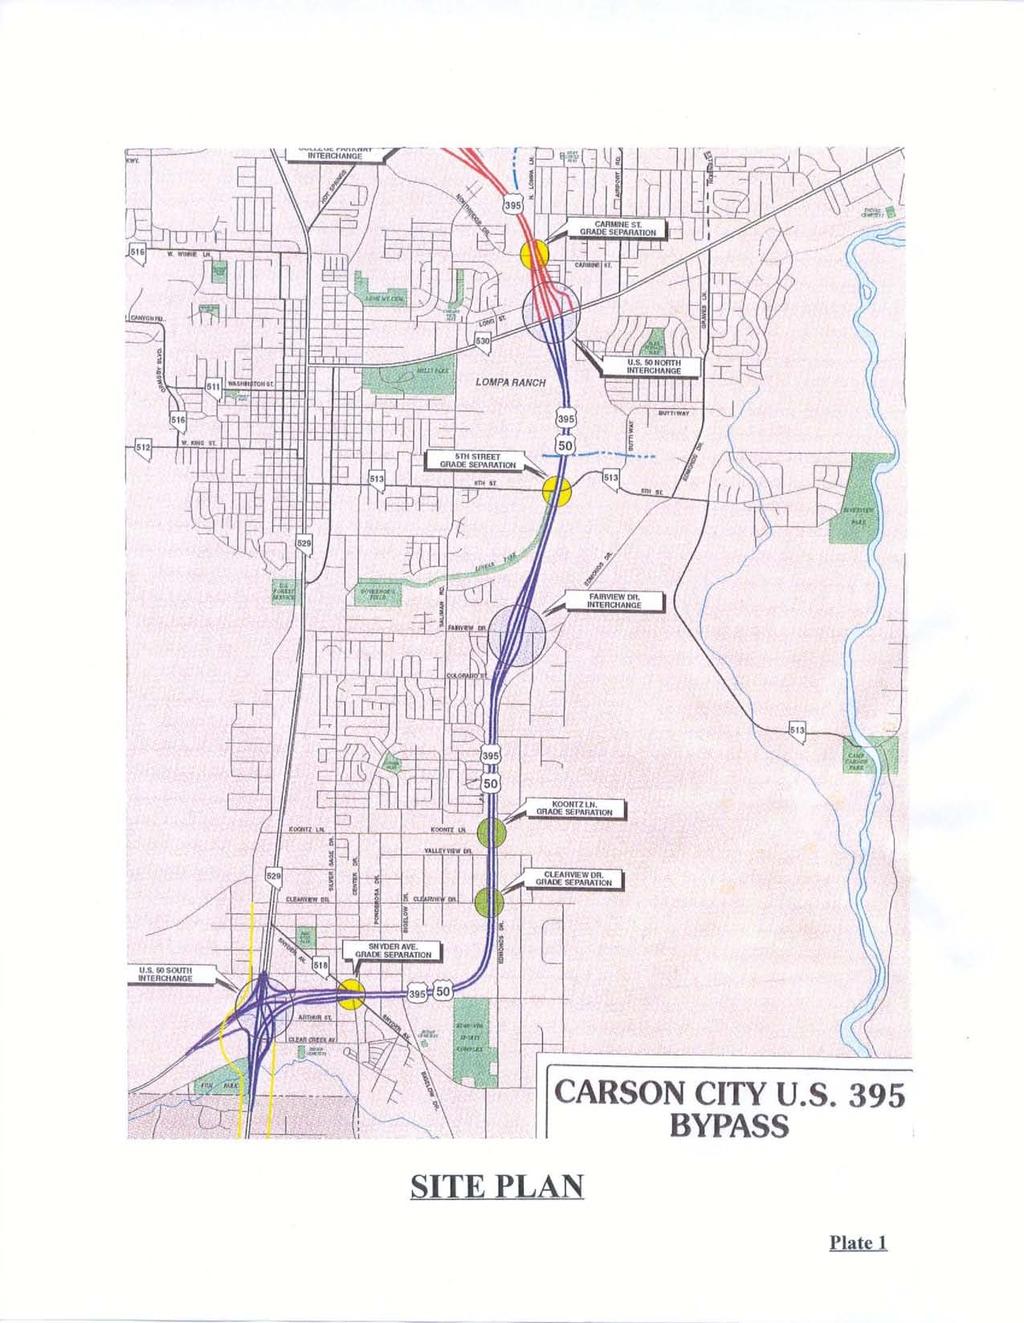
4 INTRODUCTION General This report has been prepared for the planned grade separation located at Clearview Drive, crossing over the proposed Carson Freeway in Carson City, Nevada. Clearview Drive runs generally east-west in this location, and is currently one lane wide in each direction (See Photo 1). The proposed freeway will run in a north-south direction, approximately 20 to 25 below existing grade, crossing under Clearview Drive approximately 200 feet west of South Edmonds Drive. To date, the proposed plan calls for construction of a double span concrete structure. For a more detailed description, see the contract plans. A site plan for the project is presented in Appendix A. Photo 1. Clearview Drive: Looking West toward US 50. 1
5 Purpose and Scope The purpose of this report is to provide information regarding the subsurface soil conditions at the proposed project site. This report also provides geotechnical design recommendations for the bridge structure proposed for this project. The scope of this report consists primarily of geotechnical investigation, analysis, and recommendations for both design and construction. The investigation included gathering data from past field explorations and reports, in addition to information obtained from recent subsurface explorations, soil sampling, and analysis of field and laboratory testing data. This report includes boring logs and summaries of test results from the field investigations and the laboratory testing regimen. These may be found in appendices B and C, respectively. PROJECT DESCRIPTION The project site is located in southwestern Carson City (See Photo 2). The freeway runs approximately 20 feet below the existing grade as shown in the current plans, and will pass under Clearview Drive. Preliminary plans indicate the proposed bridge will be designed as a double span concrete structure over the freeway alignment, conveying two lanes of traffic in each direction. It will be supported on spread footings founded in native soil. The new structure will be approximately 60 feet in width and 2 feet in length. 2

6 Photo 2. Clearview Drive: Looking East toward S. Edmonds Drive. GEOLOGIC CONDITIONS and SEISMICITY The site is founded primarily in pediment and alluvial fan deposits (Qpa). These deposits are generally grayish-orange, tan, and gray-brown muddy sands and sandy gravels 1. Although not anticipated, variable site conditions include the possibility of encountering large cobbles, boulders, or other adverse soil conditions. This area lies at an elevation of approximately 4740 feet and slopes gently downward ( 3%) to the west 2. Groundwater was measured nine weeks after drilling at a depth of approximately 72 feet in borehole CV-1. There are several seismic features near the project site; among them are three significant Fault Zones. The Genoa Fault Zone, approximately 4.0 miles to the west-southwest; the Carson City Fault, which lies about 2.0 miles to the west-northwest; and the Eastern Prison Hill Fault Zone, which lies about 7 miles to the northeast. These Holocene faults (<11,000 years old) are capable of producing large (magnitude 6.6 to 7.4) earthquakes. Estimates for the interval of 3
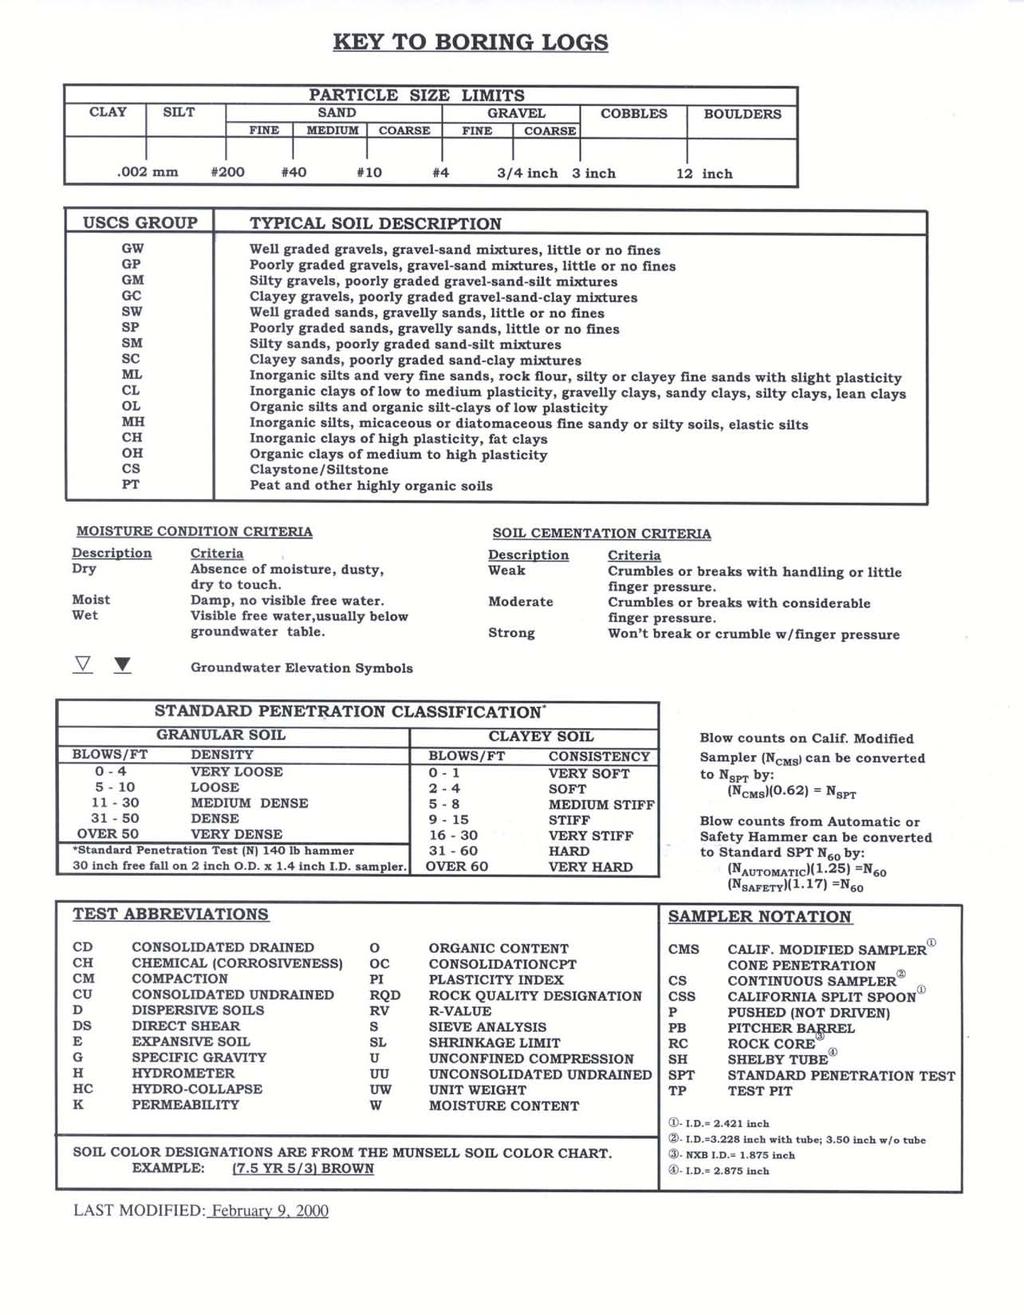
7 recurrence for these faults range from once every 1350 years, to less than once every 16,000 years 3,4,5,6. FIELD INVESTIGATION The Geotechnical Section conducted a subsurface investigation at the proposed project site in July Subsurface soil conditions were explored in the investigation by drilling three boreholes placed along the Clearview Drive alignment near the proposed locations for the center pier and each abutment. The approximate location of each borehole is shown on the Borehole Location sheet in Appendix A. Boreholes CV-1, CV- 2, and CV-3 were drilled to depths of 88.5 feet, 40.0 feet, and feet, respectively. The surface elevations were obtained for the borehole locations by surveying from a known elevation point. Drilling was accomplished utilizing a Mobile B-80 drill rig using wet rotary drilling with bentonite slurry on boreholes CV-1, and CV-3. Borehole CV-2 was drilled with a Mobile B-57 drill rig with 6-inch hollow stem auger. Both drill rigs were equipped for soil sampling. Soil samples and standard penetration resistance values (N-Values) were obtained utilizing the Standard Penetration Test () procedure as set forth in ASTM test number T206. The uncorrected blow counts are shown on the boring logs in Appendix B. Soil conditions were not suitable for using thin-walled Shelby tubes (SH), allowing only disturbed samples to be obtained. All soil samples were classified, both visually and using laboratory data, using the Unified Soil Classification System (USCS) described in ASTM test number D
8 LABORATORY ANALYSIS Laboratory tests were performed on the samples collected from the boreholes. The testing program consisted of sieve analyses, moisture and unit weight, Atterberg limits, direct shear tests, specific gravities, and chemical analyses (chlorides, resistivity, ph). The results of this testing program show that the soils consist primarily of silty and clayey sands, with occasional gravel and interspersed clay layers. Further information is presented in the summaries of test results in Appendix C. Dry unit weights from 25 samples ranged from 96.4 pounds per cubic foot (pcf) in sandy lean clay, to pcf in silty sand. The average dry unit weight for the soils was 115 pcf. DISCUSSION The project site is located in one of the most seismically active regions in the state, which places this area at risk for liquefaction. Possible causes of liquefaction include seismic activity or induced vibrations. However, upon examination of specific site data, it has been determined that liquefaction will probably not occur due to soil densities, and low moisture content in combination with Atterberg limits 7. High soil densities and a deep water table combine to make the site suitable for the use of spread footings for the bridge foundation. Initial settlement due to loading at the abutments is estimated to be between ½ and 1½, depending on the width and depth of the footing (see Table 1) with differential settlement being approximately one-half of the total settlement. This settlement should be immediate, occurring during construction, and is based on loading the foundations to four kips per square foot (4 ksf). Settlement due to consolidation should be negligible. The proposed construction of the bridge follows the 5
9 existing vertical profile over the depressed freeway, and has no significant increase in overburden in embankment. No additional settlement is expected to occur in these areas. Footing Width CLEARVIEW DRIVE- SETTLEMENT SUMMARY Compilation of Settlement Ranges in Inches based on 4 ksf loading WEST ABUTMENT CENTER PIER EAST ABUTMENT Bottom of Footing Depth 3' 4' 5' 3' 4' 5' 3' 4' 5' 4' 3/4" 3/4" 3/4" 1/2" 1/2" 1/2" 1/2" 1/2" 1/2" 6' 1" 3/4" 3/4" 1/2" 1/2" 1/2" 3/4" 3/4" 3/4" 8' 1-1/4" 1" 1" 3/4" 3/4" 1/2" 1" 1" 1" ' 1-1/4" 1-1/4" 1-1/4" 1" 1" 1" 1-1/2" 1-1/4" 1-1/4" Table 1. Settlement Summary RECOMMENDATIONS All excavation shall be performed in accordance with the NDOT 2001 Standard Specifications for Road and Bridge Construction. All permanent slopes should be constructed to lie at a maximum of 2:1 (Horiz:Vert) slope. The contractor shall be responsible for all necessary shoring for any excavation and/or construction. Although not anticipated, variable site conditions include the possibility of encountering large cobbles, boulders, very soft soils, or other adverse soil conditions. 6
10 The very dense sandy soils are well suited for spread footings. AASHTO recommends using a factor of safety of 3.00 in conjunction with this type of analysis. This factor of safety was used to calculate the allowable bearing capacity of the spread footings. Abutment footings placed on cut slopes in native ground should be a minimum of eight feet wide and extend a minimum of six feet deep. These footings will have an allowable bearing capacity of 4500 psf. The center pier footings should be a minimum of six feet wide and extend a minimum of four feet deep. These footings will have an allowable bearing capacity of 7000 psf. Abutment Retaining Walls The Acceleration Coefficient (A), Soil Profile Type, and Site Coefficient (S), are all obtained from AASHTO Standard Specifications for Highway Bridges, Division 1-A, Section 3. The horizontal Acceleration Coefficient (Kh) is obtained from AASHTO Standard Specifications for Highway Bridges, Division 1-A, Section 6. The vertical Acceleration Coefficient (Kv) is assumed to be zero. Earth pressure coefficients are calculated using Coulombs analysis method utilizing the Mononobe-Okabe equation for Ka, Kp, Kae, and Kpe. The structure - soil interface angle is taken as ⅔φ. These design parameters are found in tables 1 and 2. 7
11 Recommended Design Parameters for Abutment Retaining Walls Backfill Slope 2H:1V φ 1 = soil friction angle (native) 32º δ 1 = structure - soil interface angle (native) 21.3º γ 1 = effective soil unit weight 115 pcf A = Acceleration Coefficient (AASHTO) 0.40 Soil Profile Type (AASHTO) II S = Site Coefficient (AASHTO) 1.2 K a = Active Earth Pressure Coefficient (Coulomb) K p = Passive Earth Pressure Coefficient (Coulomb) N/A K h = Horizontal Acceleration Coefficient (Abutments May Displace) 0.20 K h = Horizontal Acceleration Coefficient (Abutments Restrained) 0.60 K v = Vertical Acceleration Coefficient 0.00 K ae = Dynamic Active Earth Pressure Coefficient (Mononobe-Okabe) K pe = Dynamic Passive Earth Pressure Coefficient (Mononobe-Okabe) N/A Coefficient of Base Friction (Sliding) 0.40 TABLE 1 - Native Soil Backfill Slope 2H:1V φ 2 = soil friction angle (backfill) 34º δ 2 = structure - soil interface angle (backfill) 22.7º γ 2 = effective soil unit weight 125 pcf A = Acceleration Coefficient (AASHTO) 0.40 K a = Active Earth Pressure Coefficient (Coulomb) K p = Passive Earth Pressure Coefficient (Coulomb) N/A K h = Horizontal Acceleration Coefficient (Abutments May Displace) 0.20 K h = Horizontal Acceleration Coefficient (Abutments Restrained) 0.60 K v = Vertical Acceleration Coefficient 0.00 K ae = Dynamic Active Earth Pressure Coefficient (Mononobe-Okabe) K pe = Dynamic Passive Earth Pressure Coefficient (Mononobe-Okabe) N/A Coefficient of Base Friction (Sliding) 0.40 TABLE 2 - Backfill 8
12 REFERENCES 1. New Empire Geologic Map; Nevada Bureau of Mines and Geology, Map 59, New Empire Folio Slope Map; Nevada Bureau of Mines and Geology, Earthquake Occurrence in the Reno-Carson City Urban Corridor; depolo, Anderson, depolo, and Price; Seismological Research Letters, Volume 68; May/June 1997; from Internet article dated 12/31/01 modified by The Nevada Seismological Laboratory. 4. New Empire Quadrangle Earthquake Hazards Map; Nevada Bureau of Mines and Geology, Map 1Bi, Bell and Trexler, Genoa Quadrangle Earthquake Hazards Map; Nevada Bureau of Mines and Geology, Map 1Ci, Pease, Carson City Quadrangle Earthquake Hazards Map; Nevada Bureau of Mines and Geology, Map 1Ai, Trexler and Bell, FHWA Geotechnical Earthquake Engineering, FHWA HI , AASHTO Standard Specifications for Highway Bridges, sixteenth edition, 1996; with interims through Standard Specifications for Road and Bridge Construction, State of Nevada Department of Transportation,
13 APPENDIX A
14
15
16 APPENDIX B
17
18 EXPLORATION LOG START DATE 7/1/02 END DATE 7/2/02 JOB DESCRIPTION CARSON FREEWAY LOCATION CLEARVIEW DRIVE GRADE SEPARATION BORING CV-1 E.A. # GROUNDWATER LEVEL DEPTH ft ELEV. ft GROUND ELEV (ft) DATE 7/8/ HAMMER DROP SYSTEM SAFETY 9/3/ STATION OFFSET ENGINEER EQUIPMENT OPERATOR DRILLING METHOD BACKFILLED "CV" ' Right BOOMHOWER MOBILE B-80 ALTAMIRANO DATE SHEET 1 OF 3 Wet w/ Bentonite Slurry ELEV. (ft) DEPTH (ft) SAMPLE BLOW COUNT 6 inch Last NO. TYPE Increments 1 foot Percent Recov'd LAB TESTS USCS Group MATERIAL DESCRIPTION REMARKS SILTY SAND dry, with scrub brush A B CMS 32 50/5" 35 50/5" 50/5" 50/5" SM SILTY SAND damp, brownish yellow ( YR 6/6), very dense, partially cemented C D CMS 52 50/4.5" 38 50/3.5" 50/4.5" 50/3.5" SC SM SC SILTY CLAYEY SAND damp, brownish yellow ( YR 6/6), very dense, partially cemented CLAYEY SAND damp, brownish yellow ( YR 6/6), very dense, partially cemented SILTY SAND damp, brownish yellow ( YR 6/6), very dense, partially cemented E /3" 50/3" Gravel 14' F /5" 50/5" 76 (F) Rock in sampler shoe SM NV_DOT CLERVIEW.GPJ NV_DOT.GDT /6/ G H /4" 36 50/3" 50/4" 50/3" SILTY SAND fine, dry, yellowish brown ( YR 5/4), very dense
19 ELEV. (ft) DEPTH (ft) START DATE SAMPLE BLOW COUNT 6 inch Last NO. TYPE Increments 1 foot 7/1/02 EXPLORATION LOG END DATE 7/2/02 JOB DESCRIPTION CARSON FREEWAY LOCATION CLEARVIEW DRIVE GRADE SEPARATION BORING CV-1 E.A. # GROUNDWATER LEVEL (ft) DATE DEPTH ft ELEV. ft GROUND ELEV. 7/8/ HAMMER DROP SYSTEM SAFETY 9/3/ Percent Recov'd LAB TESTS USCS Group STATION OFFSET ENGINEER EQUIPMENT OPERATOR DRILLING METHOD BACKFILLED MATERIAL DESCRIPTION SILTY SAND fine, dry, very dense, partially cemented "CV" ' Right BOOMHOWER MOBILE B-80 ALTAMIRANO Wet w/ Bentonite Slurry DATE SHEET 2 OF 3 REMARKS I J /5" 50/5" SM CL CLAY SILTY CLAYEY SAND fine, dry, yellowish brown ( YR 5/4), very dense Clay layer from 43' to 43.5' K CMS End day 48.5' SC SM NV_DOT CLERVIEW.GPJ NV_DOT.GDT /6/ L /3" 50/3" (L) Rock in sampler shoe.
20 ELEV. (ft) DEPTH (ft) SAMPLE NO. TYPE EXPLORATION LOG START DATE 7/1/02 END DATE 7/2/02 JOB DESCRIPTION CARSON FREEWAY LOCATION CLEARVIEW DRIVE GRADE SEPARATION BORING CV-1 E.A. # GROUNDWATER LEVEL DEPTH ft GROUND ELEV (ft) DATE ELEV. ft 7/8/ HAMMER DROP SYSTEM SAFETY 9/3/ BLOW COUNT 6 inch Last Increments 1 foot Percent Recov'd LAB TESTS USCS Group SC SM STATION OFFSET ENGINEER EQUIPMENT OPERATOR DRILLING METHOD BACKFILLED MATERIAL DESCRIPTION SILTY CLAYEY SAND fine, dry, yellowish brown ( YR 5/4), very dense "CV" ' Right BOOMHOWER MOBILE B-80 ALTAMIRANO Wet w/ Bentonite Slurry DATE SHEET 3 OF 3 REMARKS M SC CLAYEY SAND medium to coarse, yellowish brown ( YR 5/4), very dense (M) Rock in sampler shoe N SILTY SAND fine to medium, dry, yellowish brown ( YR 5/4), very dense SM Gravel and 79' to 80.5'; hard drilling. NV_DOT CLERVIEW.GPJ NV_DOT.GDT /6/ O SILTY SAND fine to medium, dry, yellowish brown ( YR 5/4), very dense, some gravel B.O.H. Hard drilling from 82' to 83.5'. Flushed hole with clean water.
21 ELEV. (ft) DEPTH (ft) 1.00 START DATE 7/2/02 END DATE 7/3/02 JOB DESCRIPTION CARSON FREEWAY LOCATION CLEARVIEW DRIVE GRADE SEPARATION BORING CV-2 E.A. # GROUNDWATER LEVEL GROUND ELEV (ft) DATE DEPTH ft ELEV. ft HAMMER DROP SYSTEM AUTOMATIC SAMPLE BLOW COUNT 6 inch Last NO. TYPE Increments 1 foot Percent Recov'd LAB TESTS USCS Group EXPLORATION LOG STATION OFFSET ENGINEER EQUIPMENT OPERATOR DRILLING METHOD BACKFILLED MATERIAL DESCRIPTION SILTY SAND dry, very pale brown ( YR 7/4), with scrub brush "CV" ' Right BOOMHOWER MOBILE B-57 ALTAMIRANO 6" H.S. AUGER Yes DATE SHEET 1 OF 2 7/3/2002 REMARKS A B C BULK CMS /2" 42 25/2" SM SC SM 4.00 SILTY CLAYEY SAND dry to damp, yellowish brown ( YR 5/4), very dense, lightly cemented D CMS 43 50/5" 50/5" 91 SM 7.00 SILTY SAND dry to damp, yellowish brown ( YR 5/4), very dense, lightly cemented Quartz gravel CLAYEY SAND yellowish brown ( YR 5/4), very dense E End day 14.5' F CMS 62 50/3" 50/3" SC CLAYEY SAND with gravel, light reddish brown (5 YR 6/4), very dense NV_DOT CLERVIEW.GPJ NV_DOT.GDT /6/ G H SC SM CLAYEY SAND with gravel, dry, light reddish brown (5 YR 6/4), very dense, cemented SILTY CLAYEY SAND light reddish brown (5 YR 6/4), very dense Very hard 27'.
22 ELEV. (ft) DEPTH (ft) SAMPLE BLOW COUNT 6 inch Last NO. TYPE Increments 1 foot Percent Recov'd LAB TESTS USCS Group EXPLORATION LOG START DATE 7/2/02 END DATE 7/3/02 JOB DESCRIPTION CARSON FREEWAY LOCATION CLEARVIEW DRIVE GRADE SEPARATION BORING CV-2 E.A. # GROUNDWATER LEVEL GROUND ELEV (ft) DATE DEPTH ft ELEV. ft HAMMER DROP SYSTEM AUTOMATIC STATION OFFSET ENGINEER EQUIPMENT OPERATOR DRILLING METHOD BACKFILLED MATERIAL DESCRIPTION CLAYEY SAND with gravel, dry, light reddish brown (5 YR 6/4), very dense, cemented "CV" ' Right BOOMHOWER MOBILE B-57 ALTAMIRANO 6" H.S. AUGER Yes DATE SHEET 2 OF 2 7/3/2002 REMARKS Very hard 31' I SC Very hard 37' B.O.H. Auger vibrating severely; terminate drilling NV_DOT CLERVIEW.GPJ NV_DOT.GDT /6/
23 EXPLORATION LOG START DATE 7/8/02 END DATE 7/9/02 JOB DESCRIPTION CARSON FREEWAY LOCATION CLEARVIEW DRIVE GRADE SEPARATION BORING CV-3 E.A. # GROUNDWATER LEVEL GROUND ELEV (ft) DATE DEPTH ft ELEV. ft HAMMER DROP SYSTEM SAFETY STATION OFFSET ENGINEER EQUIPMENT OPERATOR DRILLING METHOD BACKFILLED "CV" ' Right BOOMHOWER MOBILE B-80 MARSHALL DATE SHEET 1 OF 4 Wet w/ Bentonite Slurry ELEV. (ft) DEPTH (ft) SAMPLE NO. TYPE BLOW COUNT 6 inch Last Increments 1 foot Percent Recov'd LAB TESTS USCS Group SM 2.00 MATERIAL DESCRIPTION SILTY SAND dry, with scrub brush REMARKS A 17 50/5" 50/5" 91 SC CLAYEY SAND dry, light reddish brown to yellowish brown (5 YR 6/4 to YR 5/4), lightly cemented SILTY CLAYEY SAND B SC SM NV_DOT CLERVIEW.GPJ NV_DOT.GDT /6/ C D CMS /4" 77 50/4" 90 CL SC SANDY LEAN CLAY damp, yellowish red (5 YR 5/6) CLAYEY SAND damp, reddish brown (5 YR 5/4), very dense
24 ELEV. (ft) DEPTH (ft) EXPLORATION LOG START DATE 7/8/02 END DATE 7/9/02 JOB DESCRIPTION CARSON FREEWAY LOCATION CLEARVIEW DRIVE GRADE SEPARATION BORING CV-3 E.A. # GROUNDWATER LEVEL GROUND ELEV (ft) DATE DEPTH ft ELEV. ft HAMMER DROP SYSTEM SAFETY SAMPLE BLOW COUNT 6 inch Last NO. TYPE Increments 1 foot Percent Recov'd LAB TESTS USCS Group STATION OFFSET ENGINEER EQUIPMENT OPERATOR DRILLING METHOD BACKFILLED MATERIAL DESCRIPTION SILTY SAND medium to coarse, yellowish brown ( YR 5/4) "CV" ' Right BOOMHOWER MOBILE B-80 MARSHALL DATE SHEET 2 OF 4 Wet w/ Bentonite Slurry REMARKS E CMS 56 50/4" 50/4" F /4" 50/4" G SM SILTY SAND with GRAVEL medium to coarse H SILTY SAND dry, medium to coarse, yellowish brown ( YR 5/4) NV_DOT CLERVIEW.GPJ NV_DOT.GDT /6/ I J 34 50/5" /5" 77 SC SILTY SAND damp, fine to medium, yellowish brown ( YR 5/4) CLAYEY SAND moist, fine to medium, yellowish red (5 YR 5/6) End day 58.5'.
25 EXPLORATION LOG START DATE 7/8/02 END DATE 7/9/02 JOB DESCRIPTION CARSON FREEWAY LOCATION CLEARVIEW DRIVE GRADE SEPARATION BORING CV-3 E.A. # GROUNDWATER LEVEL GROUND ELEV (ft) DATE DEPTH ft ELEV. ft HAMMER DROP SYSTEM SAFETY STATION OFFSET ENGINEER EQUIPMENT OPERATOR DRILLING METHOD BACKFILLED "CV" ' Right BOOMHOWER MOBILE B-80 MARSHALL DATE SHEET 3 OF 4 Wet w/ Bentonite Slurry ELEV. (ft) DEPTH (ft) SAMPLE BLOW COUNT 6 inch Last NO. TYPE Increments 1 foot Percent Recov'd LAB TESTS USCS Group MATERIAL DESCRIPTION REMARKS K CMS CLAYEY SAND damp, yellowish red (5 YR 5/6), very dense L CLAYEY SAND damp, yellowish red (5 YR 5/6), very dense M SC N CLAYEY SAND damp, yellowish red (5 YR 5/6), very dense NV_DOT CLERVIEW.GPJ NV_DOT.GDT /6/ O P CMS CLAYEY SAND moist, yellowish red (5 YR 5/6), very dense, some gravel
26 ELEV. (ft) DEPTH (ft) EXPLORATION LOG START DATE 7/8/02 END DATE 7/9/02 JOB DESCRIPTION CARSON FREEWAY LOCATION CLEARVIEW DRIVE GRADE SEPARATION BORING CV-3 E.A. # GROUNDWATER LEVEL GROUND ELEV (ft) DATE DEPTH ft ELEV. ft HAMMER DROP SYSTEM SAFETY SAMPLE BLOW COUNT 6 inch Last NO. TYPE Increments 1 foot Percent Recov'd LAB TESTS USCS Group STATION OFFSET ENGINEER EQUIPMENT OPERATOR DRILLING METHOD BACKFILLED MATERIAL DESCRIPTION CLAYEY SAND damp, yellowish red (5 YR 5/6), very dense "CV" ' Right BOOMHOWER MOBILE B-80 MARSHALL Wet w/ Bentonite Slurry DATE SHEET 4 OF 4 REMARKS Q /4" 50/4" SC POORLY GRADED GRAVEL very dense, yellowish red to brownish yellow (5 YR 5/6 to YR 6/6) R 50/3" 50/3" 67 GP Hard 1' Very hard 9' to 112' (s) No recovery. NV_DOT CLERVIEW.GPJ NV_DOT.GDT /6/ S RC B.O.H.
27 APPENDIX C
28 Particle Size Distribution Report 6 in. 3 in. 2 in. 1½ in. 1 in. ¾ in. ½ in. 3/8 in. # #20 #30 0 #60 # # PERCENT FINER GRAIN SIZE - mm. +3" % GRAVEL % SAND % SILT % CLAY USCS AASHTO PL LL SM SM SM SIEVE PERCENT FINER SIEVE PERCENT FINER Material Description inches number Silty sand 3/4.0 1/ Silty sand 3/ D 60 D 30 D GRAIN SIZE COEFFICIENTS NEVADA DEPARTMENT OF TRANSPORTATION # #16 0 #50 # C c C u Source of Sample: CV1 Depth: 2.1' Sample Number: A1 Source of Sample: CV1 Depth: 2.6' Sample Number: A2 Source of Sample: CV1 Depth: 2.9' Sample Number: B Client: Project: Project No.: Silty sand Carson City Clearview Dr REMARKS: Figure
29 Particle Size Distribution Report 6 in. 3 in. 2 in. 1½ in. 1 in. ¾ in. ½ in. 3/8 in. # #20 #30 0 #60 # # PERCENT FINER GRAIN SIZE - mm. +3" % GRAVEL % SAND % SILT % CLAY USCS AASHTO PL LL SC-SM SC SM SIEVE PERCENT FINER SIEVE PERCENT FINER Material Description inches number Silty, clayey sand 1/2.0 3/ Clayey sand D 60 D 30 D GRAIN SIZE COEFFICIENTS NEVADA DEPARTMENT OF TRANSPORTATION # #16 0 #50 # C c C u Source of Sample: CV1 Depth: 7.2' Sample Number: C1 Source of Sample: CV1 Depth: 7.9' Sample Number: D Source of Sample: CV1 Depth: 12.0' Sample Number: E Client: Project: Project No.: Silty sand Carson City Clearview Dr REMARKS: Figure
30 Particle Size Distribution Report 6 in. 3 in. 2 in. 1½ in. 1 in. ¾ in. ½ in. 3/8 in. # #20 #30 0 #60 # # PERCENT FINER GRAIN SIZE - mm. +3" % GRAVEL % SAND % SILT % CLAY USCS AASHTO PL LL SM SM SM SIEVE PERCENT FINER SIEVE PERCENT FINER Material Description inches number Silty sand 1.0 3/ Silty sand 1/ / D 60 D 30 D GRAIN SIZE COEFFICIENTS NEVADA DEPARTMENT OF TRANSPORTATION # #16 0 #50 # C c C u Source of Sample: CV1 Depth: 17.0' Sample Number: F Source of Sample: CV1 Depth: 22.0' Sample Number: G Source of Sample: CV1 Depth: 27.0' Sample Number: H Client: Project: Project No.: Silty sand Carson City Clearview Dr REMARKS: Figure
31 Particle Size Distribution Report 6 in. 3 in. 2 in. 1½ in. 1 in. ¾ in. ½ in. 3/8 in. # #20 #30 0 #60 # # PERCENT FINER GRAIN SIZE - mm. +3" % GRAVEL % SAND % SILT % CLAY USCS AASHTO PL LL SM SM SC-SM SIEVE PERCENT FINER SIEVE PERCENT FINER Material Description inches number Silty sand 3/ # Silty sand # # Silty, clayey sand # GRAIN SIZE REMARKS: D D D COEFFICIENTS C c C u Source of Sample: CV1 Depth: 32.0' Sample Number: I Source of Sample: CV1 Depth: 37.0' Sample Number: J Source of Sample: CV1 Depth: 47.3' Sample Number: K1 NEVADA DEPARTMENT OF TRANSPORTATION Client: Project: Project No.: Carson City Clearview Dr Figure
32 Particle Size Distribution Report 6 in. 3 in. 2 in. 1½ in. 1 in. ¾ in. ½ in. 3/8 in. # #20 #30 0 #60 # # PERCENT FINER GRAIN SIZE - mm. +3" % GRAVEL % SAND % SILT % CLAY USCS AASHTO PL LL SC SC SC-SM SIEVE PERCENT FINER SIEVE PERCENT FINER Material Description inches number Clayey sand 1/ / Clayey sand D 60 D 30 D GRAIN SIZE COEFFICIENTS NEVADA DEPARTMENT OF TRANSPORTATION # #16 0 #50 # C c C u Source of Sample: CV1 Depth: 47.8' Sample Number: K2 Source of Sample: CV1 Depth: 48.3' Sample Number: K3 Source of Sample: CV1 Depth: 57.0' Sample Number: L Client: Project: Project No.: Carson City Clearview Dr Silty, clayey sand REMARKS: Figure
33 Particle Size Distribution Report 6 in. 3 in. 2 in. 1½ in. 1 in. ¾ in. ½ in. 3/8 in. # #20 #30 0 #60 # # PERCENT FINER GRAIN SIZE - mm. +3" % GRAVEL % SAND % SILT % CLAY USCS AASHTO PL LL SC SM SM SIEVE PERCENT FINER SIEVE PERCENT FINER Material Description inches number Clayey sand 3/ / Silty sand 3/ D 60 D 30 D GRAIN SIZE COEFFICIENTS NEVADA DEPARTMENT OF TRANSPORTATION # #16 0 #50 # C c C u Source of Sample: CV1 Depth: 67.0' Sample Number: M Source of Sample: CV1 Depth: 77.0' Sample Number: N Source of Sample: CV1 Depth: 87.0' Sample Number: O Client: Project: Project No.: Silty sand Carson City Clearview Dr REMARKS: Figure
34 Particle Size Distribution Report 6 in. 3 in. 2 in. 1½ in. 1 in. ¾ in. ½ in. 3/8 in. # #20 #30 0 #60 # # PERCENT FINER GRAIN SIZE - mm. +3" % GRAVEL % SAND % SILT % CLAY USCS AASHTO PL LL SM NP SM SP-SM SIEVE PERCENT FINER SIEVE PERCENT FINER Material Description inches number Silty sand 1.0 3/ Silty sand 1/ / D 60 D 30 D GRAIN SIZE COEFFICIENTS NEVADA DEPARTMENT OF TRANSPORTATION # #16 0 #50 # C c C u Source of Sample: CV2 Depth: 1.0' Sample Number: A Source of Sample: CV2 Depth: 2.3' Sample Number: B1 Source of Sample: CV2 Depth: 2.8' Sample Number: B2 Client: Project: Project No.: Carson City Clearview Dr Poorly graded sand with silt and gravel REMARKS: Figure
35 Particle Size Distribution Report 6 in. 3 in. 2 in. 1½ in. 1 in. ¾ in. ½ in. 3/8 in. # #20 #30 0 #60 # # PERCENT FINER GRAIN SIZE - mm. +3" % GRAVEL % SAND % SILT % CLAY USCS AASHTO PL LL SC-SM SM SM SIEVE PERCENT FINER SIEVE PERCENT FINER Material Description inches number Silty, clayey sand 3/ # Silty sand # # Silty sand # GRAIN SIZE REMARKS: D D D COEFFICIENTS C c C u Source of Sample: CV2 Depth: 4.5' Sample Number: C Source of Sample: CV2 Depth: 8.1' Sample Number: D1 Source of Sample: CV2 Depth: 8.6' Sample Number: D2 NEVADA DEPARTMENT OF TRANSPORTATION Client: Project: Project No.: Carson City Clearview Dr Figure
36 Particle Size Distribution Report 6 in. 3 in. 2 in. 1½ in. 1 in. ¾ in. ½ in. 3/8 in. # #20 #30 0 #60 # # PERCENT FINER GRAIN SIZE - mm. +3" % GRAVEL % SAND % SILT % CLAY USCS AASHTO PL LL SC SC SC SIEVE PERCENT FINER SIEVE PERCENT FINER Material Description inches number Clayey sand 3/ # Clayey sand # # Clayey sand # GRAIN SIZE REMARKS: D D D COEFFICIENTS C c C u Source of Sample: CV2 Depth: 13.0' Sample Number: E Source of Sample: CV2 Depth: 18.1' Sample Number: F1 Source of Sample: CV2 Depth: 18.6' Sample Number: F2 NEVADA DEPARTMENT OF TRANSPORTATION Client: Project: Project No.: Carson City Clearview Dr Figure
37 Particle Size Distribution Report 6 in. 3 in. 2 in. 1½ in. 1 in. ¾ in. ½ in. 3/8 in. # #20 #30 0 #60 # # PERCENT FINER GRAIN SIZE - mm. +3" % GRAVEL % SAND % SILT % CLAY USCS AASHTO PL LL SC SC-SM SC SIEVE PERCENT FINER SIEVE PERCENT FINER Material Description inches number Clayey sand 1/2.0 3/ Silty, clayey sand D 60 D 30 D GRAIN SIZE COEFFICIENTS NEVADA DEPARTMENT OF TRANSPORTATION # #16 0 #50 # C c C u Source of Sample: CV2 Depth: 23.0' Sample Number: G Source of Sample: CV2 Depth: 28.0' Sample Number: H Source of Sample: CV2 Depth: 35.0' Sample Number: I Client: Project: Project No.: Carson City Clearview Dr Clayey sand REMARKS: Figure
38 Particle Size Distribution Report 6 in. 3 in. 2 in. 1½ in. 1 in. ¾ in. ½ in. 3/8 in. # #20 #30 0 #60 # # PERCENT FINER GRAIN SIZE - mm. +3" % GRAVEL % SAND % SILT % CLAY USCS AASHTO PL LL SC SC-SM CL SIEVE PERCENT FINER SIEVE PERCENT FINER Material Description inches number Clayey sand 1/2.0 3/ Silty, clayey sand D 60 D 30 D GRAIN SIZE COEFFICIENTS NEVADA DEPARTMENT OF TRANSPORTATION # #16 0 #50 # C c C u Source of Sample: CV3 Depth: 7.0' Sample Number: A Source of Sample: CV3 Depth: 17.0' Sample Number: B Source of Sample: CV3 Depth: 27.3' Sample Number: C1 Client: Project: Project No.: Carson City Clearview Dr Sandy lean clay REMARKS: Figure
39 Particle Size Distribution Report 6 in. 3 in. 2 in. 1½ in. 1 in. ¾ in. ½ in. 3/8 in. # #20 #30 0 #60 # # PERCENT FINER GRAIN SIZE - mm. +3" % GRAVEL % SAND % SILT % CLAY USCS AASHTO PL LL SC SC-SM SM NP 18 SIEVE PERCENT FINER SIEVE PERCENT FINER Material Description inches number Clayey sand 3/ # Silty, clayey sand # # Silty sand # GRAIN SIZE REMARKS: D D D 0.01 COEFFICIENTS C c C u Source of Sample: CV3 Depth: 27.8' Sample Number: C2 Source of Sample: CV3 Depth: 28.3' Sample Number: C3 Source of Sample: CV3 Depth: 28.5' Sample Number: D NEVADA DEPARTMENT OF TRANSPORTATION Client: Project: Project No.: Carson City Clearview Dr Figure
40 Particle Size Distribution Report 6 in. 3 in. 2 in. 1½ in. 1 in. ¾ in. ½ in. 3/8 in. # #20 #30 0 #60 # # PERCENT FINER GRAIN SIZE - mm. +3" % GRAVEL % SAND % SILT % CLAY USCS AASHTO PL LL SM NP SM SM SIEVE PERCENT FINER SIEVE PERCENT FINER Material Description inches number Silty sand 3/4.0 1/ Silty sand 3/8.0.0 D 60 D 30 D GRAIN SIZE COEFFICIENTS NEVADA DEPARTMENT OF TRANSPORTATION # #16 0 #50 # C c C u Source of Sample: CV3 Depth: 32.1' Sample Number: E1 Source of Sample: CV3 Depth: 32.6' Sample Number: E2 Source of Sample: CV3 Depth: 37.0' Sample Number: F Client: Project: Project No.: Silty sand Carson City Clearview Dr REMARKS: Figure
41 Particle Size Distribution Report 6 in. 3 in. 2 in. 1½ in. 1 in. ¾ in. ½ in. 3/8 in. # #20 #30 0 #60 # # PERCENT FINER GRAIN SIZE - mm. +3" % GRAVEL % SAND % SILT % CLAY USCS AASHTO PL LL SM SM SM SIEVE PERCENT FINER SIEVE PERCENT FINER Material Description inches number Silty sand 3/ # Silty sand # # Silty sand # GRAIN SIZE REMARKS: D D D COEFFICIENTS C c C u Source of Sample: CV3 Depth: 42.0' Sample Number: G Source of Sample: CV3 Depth: 47.0' Sample Number: H Source of Sample: CV3 Depth: 52.0' Sample Number: I NEVADA DEPARTMENT OF TRANSPORTATION Client: Project: Project No.: Carson City Clearview Dr Figure
42 Particle Size Distribution Report 6 in. 3 in. 2 in. 1½ in. 1 in. ¾ in. ½ in. 3/8 in. # #20 #30 0 #60 # # PERCENT FINER GRAIN SIZE - mm. +3" % GRAVEL % SAND % SILT % CLAY USCS AASHTO PL LL SC SC SC SIEVE PERCENT FINER SIEVE PERCENT FINER Material Description inches number Clayey sand 1/ / Clayey sand D 60 D 30 D GRAIN SIZE COEFFICIENTS NEVADA DEPARTMENT OF TRANSPORTATION # #16 0 #50 # C c C u Source of Sample: CV3 Depth: 57.0' Sample Number: J Source of Sample: CV3 Depth: 62.2' Sample Number: K1 Source of Sample: CV3 Depth: 62.7' Sample Number: K2 Client: Project: Project No.: Carson City Clearview Dr Clayey sand REMARKS: Figure
43 Particle Size Distribution Report 6 in. 3 in. 2 in. 1½ in. 1 in. ¾ in. ½ in. 3/8 in. # #20 #30 0 #60 # # PERCENT FINER GRAIN SIZE - mm. +3" % GRAVEL % SAND % SILT % CLAY USCS AASHTO PL LL SC SC SC SIEVE PERCENT FINER SIEVE PERCENT FINER Material Description inches number Clayey sand / Clayey sand 1/ / D 60 D 30 D GRAIN SIZE COEFFICIENTS NEVADA DEPARTMENT OF TRANSPORTATION # #16 0 #50 # C c C u Source of Sample: CV3 Depth: 63.2' Sample Number: K3 Source of Sample: CV3 Depth: 67.0' Sample Number: L Source of Sample: CV3 Depth: 72.0' Sample Number: M Client: Project: Project No.: Carson City Clearview Dr Clayey sand REMARKS: Figure
44 Particle Size Distribution Report 6 in. 3 in. 2 in. 1½ in. 1 in. ¾ in. ½ in. 3/8 in. # #20 #30 0 #60 # # PERCENT FINER GRAIN SIZE - mm. +3" % GRAVEL % SAND % SILT % CLAY USCS AASHTO PL LL SC SC SC SIEVE PERCENT FINER SIEVE PERCENT FINER Material Description inches number Clayey sand 3/ / Clayey sand 3/ D 60 D 30 D GRAIN SIZE COEFFICIENTS NEVADA DEPARTMENT OF TRANSPORTATION # #16 0 #50 # C c C u Source of Sample: CV3 Depth: 77.0' Sample Number: N Source of Sample: CV3 Depth: 82.0' Sample Number: O Source of Sample: CV3 Depth: 87.3' Sample Number: P1 Client: Project: Project No.: Carson City Clearview Dr Clayey sand REMARKS: Figure
45 Particle Size Distribution Report 6 in. 3 in. 2 in. 1½ in. 1 in. ¾ in. ½ in. 3/8 in. # #20 #30 0 #60 # # PERCENT FINER GRAIN SIZE - mm. +3" % GRAVEL % SAND % SILT % CLAY USCS AASHTO PL LL SC SC SC SIEVE PERCENT FINER SIEVE PERCENT FINER Material Description inches number Clayey sand 3/ / Clayey sand 3/ D 60 D 30 D GRAIN SIZE COEFFICIENTS NEVADA DEPARTMENT OF TRANSPORTATION # #16 0 #50 # C c C u Source of Sample: CV3 Depth: 87.8' Sample Number: P2 Source of Sample: CV3 Depth: 88.3' Sample Number: P3 Source of Sample: CV3 Depth: 92.0' Sample Number: Q Client: Project: Project No.: Carson City Clearview Dr Clayey sand REMARKS: Figure
46 EA/Cont # Job Description Carson City Clearview Dr. Boring No. CV1 Elevation (ft) ' Station "CV" ' RT. SAMPLE SAMP- N DRY % STRENGTH TEST SAMPLE DEPTH LER BLOWS SOIL W% UW PASS LL PL PI TEST C C OTHERS NO. (ft) TYPE per ft. GROUP pcf % % % TYPE deg. psi deg. psi Peak Residual A CMS SM SUMMARY OF RESULTS N.D.O.T. GEOTECHNICAL SECTION A CMS SM B SM C CMS SC-SM 8.58* * 21.9* 24* 17* 7* DS a 1.1" b 1.1" c 1.1" d 1.1" e 1.42" C CMS D SC E B45 SM 33.2 CMS = California Modified Sampler 61mm ID U = Unconfined Compressive H = Hydrometer CM = Compaction = Standard Penetration 35mm ID UU = Unconsolidated Undrained S = Sieve E = Swell/Pressure on Expansive Soils CS = Continuous Sample 82mm ID CD = Consolidated Drained G = Specific Gravity SL = Shrinkage Limit RC = Rock Core CU = Consolidated Undrained PI = Plasticity Index UW= Unit Weight PB = Pitcher Barrel DS = Direct Shear LL = Liquid Limit W = Moisture Content CSS = Calif. Split Spoon 61.5mm ID = Friction PL = Plastic Limit K = Permeability CPT = Cone Penetration Test C = Cohesion NP = Non-Plastic O = Organic Content TP = Test Pit N = No. of blows per 0.3m, sampler OC = Consolidation D = Dispersive P = Pushed, not driven Ch = Chemical RQD = Rock Quality Designation R = Refusal N = Field N = (N css )(0.62) RV = R - Value X = X-Ray Defraction Sh = Shelby Tube 73 mm ID MD = Moisture Density HCpot = Hydro-Collapse Potential * = Average of subsamples
47 EA/Cont # Job Description Carson City Clearview Dr. Boring No. CV1 Elevation (ft) Station SAMPLE SAMP- N DRY % STRENGTH TEST SAMPLE DEPTH LER BLOWS SOIL W% UW PASS LL PL PI TEST C C OTHERS NO. (ft) TYPE pcf GROUP pcf % % % TYPE deg. psi deg. psi Peak Residual F SM 21.7 G SM 29.0 H SM 24.4 I SM 21.1 J SM 24.1 K CMS SC-SM.25* * 24.2* 26* 20* 6* DS a 1.15" b 1.15" c 1.15" d 2.55" K CMS SC K CMS SC 28.6 SUMMARY OF RESULTS N.D.O.T. GEOTECHNICAL SECTION CMS = California Modified Sampler 61mm ID U = Unconfined Compressive H = Hydrometer CM = Compaction = Standard Penetration 35mm ID UU = Unconsolidated Undrained S = Sieve E = Swell/Pressure on Expansive Soils CS = Continuous Sample 82mm ID CD = Consolidated Drained G = Specific Gravity SL = Shrinkage Limit RC = Rock Core CU = Consolidated Undrained PI = Plasticity Index UW= Unit Weight PB = Pitcher Barrel DS = Direct Shear LL = Liquid Limit W = Moisture Content CSS = Calif. Split Spoon 61.5mm ID = Friction PL = Plastic Limit K = Permeability CPT = Cone Penetration Test C = Cohesion NP = Non-Plastic O = Organic Content TP = Test Pit N = No. of blows per 0.3m, sampler OC = Consolidation D = Dispersive P = Pushed, not driven Ch = Chemical RQD = Rock Quality Designation R = Refusal N = Field N = (N css )(0.62) RV = R - Value X = X-Ray Defraction Sh = Shelby Tube 73 mm ID MD = Moisture Density HCpot = Hydro-Collapse Potential * = Average of subsamples
48 EA/Cont # Job Description Carson City Clearview Dr. Boring No. CV1 Elevation (ft) Station SAMPLE SAMP- N DRY % STRENGTH TEST SAMPLE DEPTH LER BLOWS SOIL W% UW PASS LL PL PI TEST C C OTHERS NO. (ft) TYPE ft GROUP pcf % % % TYPE deg. psi deg. psi Peak Residual L SC-SM M SC N SM O SM 24.4 SUMMARY OF RESULTS N.D.O.T. GEOTECHNICAL SECTION CMS = California Modified Sampler 61mm ID U = Unconfined Compressive H = Hydrometer CM = Compaction = Standard Penetration 35mm ID UU = Unconsolidated Undrained S = Sieve E = Swell/Pressure on Expansive Soils CS = Continuous Sample 82mm ID CD = Consolidated Drained G = Specific Gravity SL = Shrinkage Limit RC = Rock Core CU = Consolidated Undrained PI = Plasticity Index UW= Unit Weight PB = Pitcher Barrel DS = Direct Shear LL = Liquid Limit W = Moisture Content CSS = Calif. Split Spoon 61.5mm ID = Friction PL = Plastic Limit K = Permeability CPT = Cone Penetration Test C = Cohesion NP = Non-Plastic O = Organic Content TP = Test Pit N = No. of blows per 0.3m, sampler OC = Consolidation D = Dispersive P = Pushed, not driven Ch = Chemical RQD = Rock Quality Designation R = Refusal N = Field N = (N css )(0.62) RV = R - Value X = X-Ray Defraction Sh = Shelby Tube 73 mm ID MD = Moisture Density HCpot = Hydro-Collapse Potential * = Average of subsamples
49 SUMMARY OF RESULTS N.D.O.T. GEOTECHNICAL SECTION EA/Cont # Job Description Carson City Clearview Dr. Boring No. CV2 Elevation (ft) ' Station "CV" ' RT. SAMPLE SAMP- N DRY % STRENGTH TEST SAMPLE DEPTH LER BLOWS SOIL W% UW PASS LL PL PI TEST C C OTHERS NO. (ft) TYPE ft GROUP pcf % % % TYPE deg. psi deg. psi Peak Residual A bulk SM NP NP Ch B CMS SM B CMS SP-SM 11.6 C SC-SM D CMS SM D CMS SM 28.4 E SC F CMS SC 26.4 F CMS SC 27.2 G SC H SC-SM I SC CMS = California Modified Sampler 61mm ID U = Unconfined Compressive H = Hydrometer CM = Compaction = Standard Penetration 35mm ID UU = Unconsolidated Undrained S = Sieve E = Swell/Pressure on Expansive Soils CS = Continuous Sample 82mm ID CD = Consolidated Drained G = Specific Gravity SL = Shrinkage Limit RC = Rock Core CU = Consolidated Undrained PI = Plasticity Index UW= Unit Weight PB = Pitcher Barrel DS = Direct Shear LL = Liquid Limit W = Moisture Content CSS = Calif. Split Spoon 61.5mm ID = Friction PL = Plastic Limit K = Permeability CPT = Cone Penetration Test C = Cohesion NP = Non-Plastic O = Organic Content TP = Test Pit N = No. of blows per 0.3m, sampler OC = Consolidation D = Dispersive P = Pushed, not driven Ch = Chemical RQD = Rock Quality Designation R = Refusal N = Field N = (N css )(0.62) RV = R - Value X = X-Ray Defraction Sh = Shelby Tube 73 mm ID MD = Moisture Density HCpot = Hydro-Collapse Potential * = Average of subsamples
50 SUMMARY OF RESULTS N.D.O.T. GEOTECHNICAL SECTION EA/Cont # Job Description Carson City Clearview Dr. Boring No. CV3 Elevation (ft) ' Station "CV" ' RT. SAMPLE SAMP- N DRY % STRENGTH TEST SAMPLE DEPTH LER BLOWS SOIL W% UW PASS LL PL PI TEST C C OTHERS NO. (ft) TYPE ft GROUP pcf % % % TYPE deg. psi deg. psi Peak Residual A SC B SC-SM C CMS CL 22.15* 98.5* 55.1* 45* 22* 23* DS a 1.1" b 1.1" 18.6 n/a c 1.1" d 2.66" C CMS SC C CMS SC-SM D SM NP NP E CMS SM 8.33* * 16* 17* NP* NP* DS a 1.1" CMS = California Modified Sampler 61mm ID U = Unconfined Compressive H = Hydrometer CM = Compaction = Standard Penetration 35mm ID UU = Unconsolidated Undrained S = Sieve E = Swell/Pressure on Expansive Soils CS = Continuous Sample 82mm ID CD = Consolidated Drained G = Specific Gravity SL = Shrinkage Limit RC = Rock Core CU = Consolidated Undrained PI = Plasticity Index UW= Unit Weight PB = Pitcher Barrel DS = Direct Shear LL = Liquid Limit W = Moisture Content CSS = Calif. Split Spoon 61.5mm ID = Friction PL = Plastic Limit K = Permeability CPT = Cone Penetration Test C = Cohesion NP = Non-Plastic O = Organic Content TP = Test Pit N = No. of blows per 0.3m, sampler OC = Consolidation D = Dispersive P = Pushed, not driven Ch = Chemical RQD = Rock Quality Designation R = Refusal N = Field N = (N css )(0.62) RV = R - Value X = X-Ray Defraction Sh = Shelby Tube 73 mm ID MD = Moisture Density HCpot = Hydro-Collapse Potential * = Average of subsamples
51 SUMMARY OF RESULTS N.D.O.T. GEOTECHNICAL SECTION EA/Cont # Job Description Carson City Clearview Dr. Boring No. CV3 Elevation (ft) Station SAMPLE SAMP- N DRY % STRENGTH TEST SAMPLE DEPTH LER BLOWS SOIL W% UW PASS LL PL PI TEST C C OTHERS NO. (ft) TYPE ft GROUP pcf % % % TYPE deg. psi deg. psi Peak Residual b 1.1" c 1.1" d 2.68" E CMS SM 19.0 F SM 20.8 G SM 25.7 H SM 26.8 I SM 20.2 J SC K CMS SC K CMS SC 14.9* 115.7* 32* 36* 16* 20* DS a 1.1" CMS = California Modified Sampler 61mm ID U = Unconfined Compressive H = Hydrometer CM = Compaction = Standard Penetration 35mm ID UU = Unconsolidated Undrained S = Sieve E = Swell/Pressure on Expansive Soils CS = Continuous Sample 82mm ID CD = Consolidated Drained G = Specific Gravity SL = Shrinkage Limit RC = Rock Core CU = Consolidated Undrained PI = Plasticity Index UW= Unit Weight PB = Pitcher Barrel DS = Direct Shear LL = Liquid Limit W = Moisture Content CSS = Calif. Split Spoon 61.5mm ID = Friction PL = Plastic Limit K = Permeability CPT = Cone Penetration Test C = Cohesion NP = Non-Plastic O = Organic Content TP = Test Pit N = No. of blows per 0.3m, sampler OC = Consolidation D = Dispersive P = Pushed, not driven Ch = Chemical RQD = Rock Quality Designation R = Refusal N = Field N = (N css )(0.62) RV = R - Value X = X-Ray Defraction Sh = Shelby Tube 73 mm ID MD = Moisture Density HCpot = Hydro-Collapse Potential * = Average of subsamples
52 SUMMARY OF RESULTS N.D.O.T. GEOTECHNICAL SECTION EA/Cont # Job Description Carson City Clearview Dr. Boring No. CV3 Elevation (ft) Station SAMPLE SAMP- N DRY % STRENGTH TEST SAMPLE DEPTH LER BLOWS SOIL W% UW PASS LL PL PI TEST C C OTHERS NO. (ft) TYPE ft GROUP pcf % % % TYPE deg. psi deg. psi Peak Residual b 1.1" 14.6 n/a c 1.1" d 2.58" K CMS SC L SC M SC 29.0 N SC O SC 22.3 P CMS SC P CMS SC P CMS SC 31.6 Q SC CMS = California Modified Sampler 61mm ID U = Unconfined Compressive H = Hydrometer CM = Compaction = Standard Penetration 35mm ID UU = Unconsolidated Undrained S = Sieve E = Swell/Pressure on Expansive Soils CS = Continuous Sample 82mm ID CD = Consolidated Drained G = Specific Gravity SL = Shrinkage Limit RC = Rock Core CU = Consolidated Undrained PI = Plasticity Index UW= Unit Weight PB = Pitcher Barrel DS = Direct Shear LL = Liquid Limit W = Moisture Content CSS = Calif. Split Spoon 61.5mm ID = Friction PL = Plastic Limit K = Permeability CPT = Cone Penetration Test C = Cohesion NP = Non-Plastic O = Organic Content TP = Test Pit N = No. of blows per 0.3m, sampler OC = Consolidation D = Dispersive P = Pushed, not driven Ch = Chemical RQD = Rock Quality Designation R = Refusal N = Field N = (N css )(0.62) RV = R - Value X = X-Ray Defraction Sh = Shelby Tube 73 mm ID MD = Moisture Density HCpot = Hydro-Collapse Potential * = Average of subsamples