The Metropolitan District. Water Bureau Presentation May 18, 2016
|
|
|
- Harold Parsons
- 5 years ago
- Views:
Transcription

1 The Metropolitan District Water Bureau Presentation May 18, 2016
2 TOPICS WATER SUPPLY SAFE YIELD DROUGHT WATERSHED MANAGEMENT 2

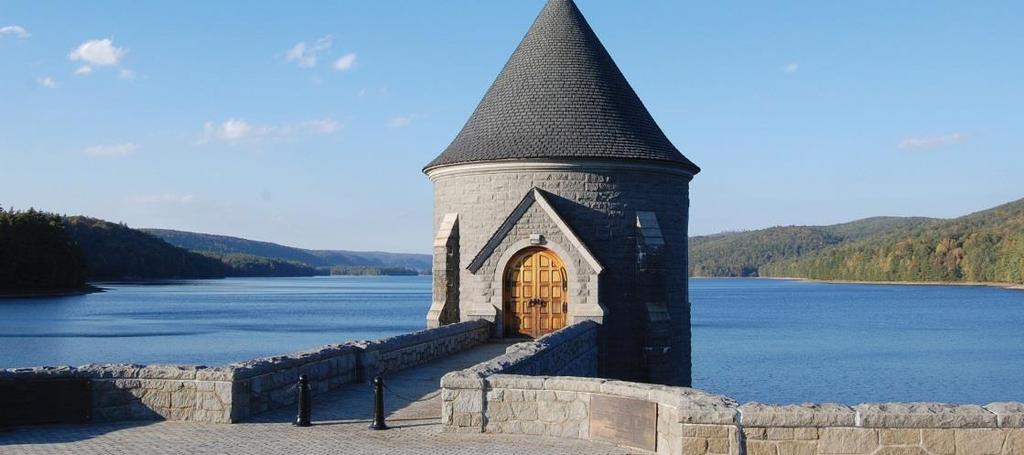
3 ACTIVE WATER SUPPLY SOURCES Nepaug Reservoir 9.5 BG completed in 1917 Barkhamsted Reservoir 30.3 BG completed in 1940 These reservoirs provide drinking water to a population of approximately 400,000 people 3
4 4
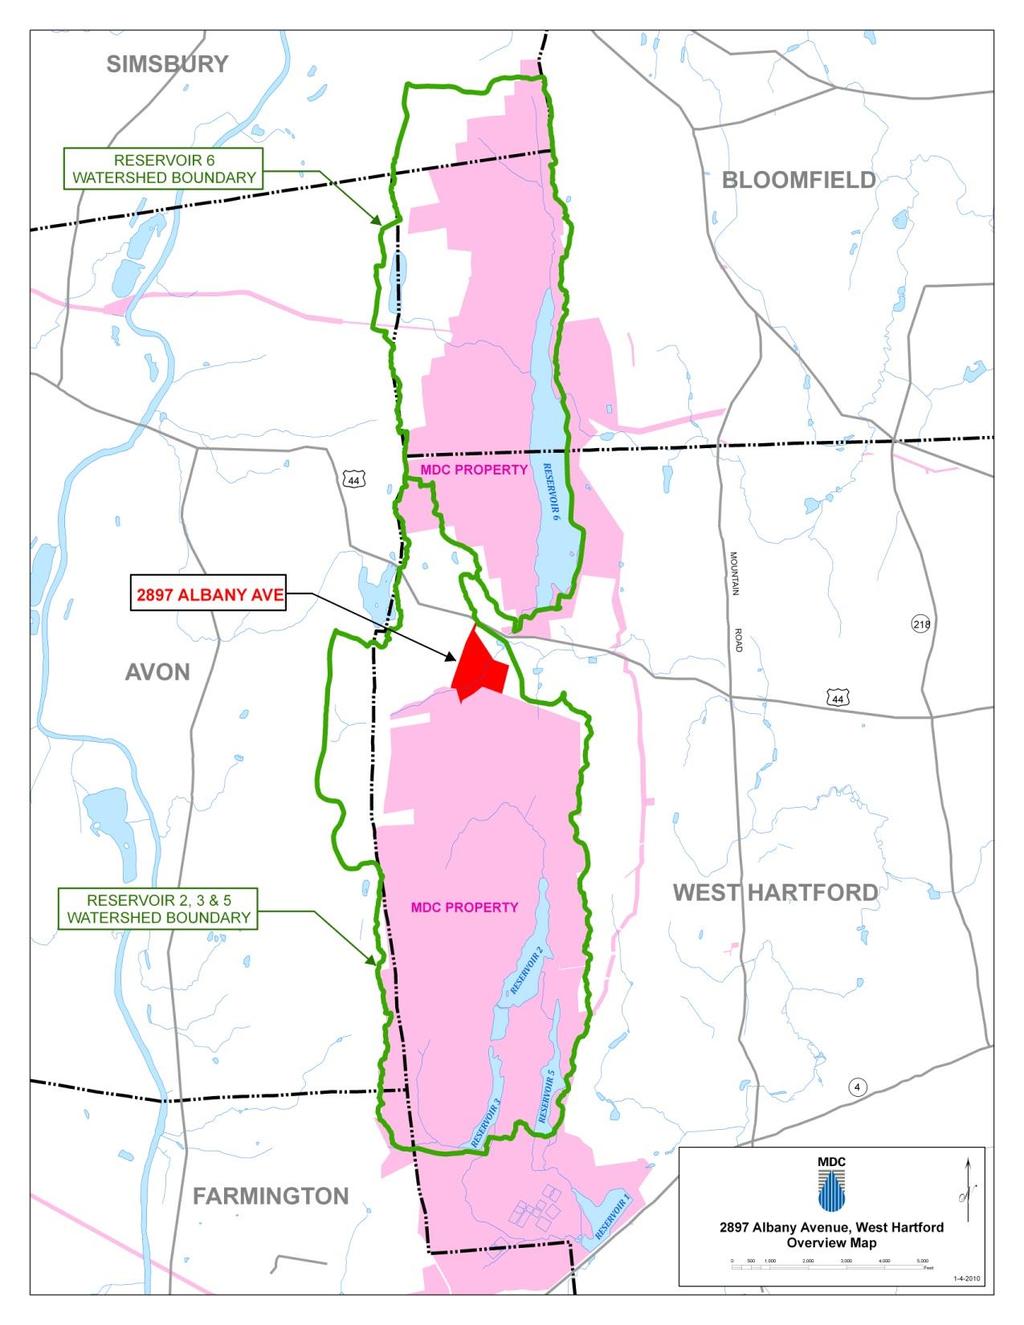
5 WATER SALES IN THE MDC S EXCLUSIVE SERVICE AREAS AND SALES OF EXCESS WATER The MDC does not have contracts with any of its customers within its exclusive service area. The MDC does have contracts for sale of excess water to customers outside of its exclusive service area. Examples outside of service area: Portland Unionville 5
. MDC Reservoirs Are All Rated Class Aa. Lake McDonough Is Rated Class A.")
6 The FARMINGTON RIVER WATERSHED has a DRAINAGE AREA of 609 SQUARE MILES. BARKHAMSTED RESERVOIR Watershed is 53.8 square miles (8.8% of River watershed). NEPAUG RESERVOIR Watershed is 31.9 square miles (5.2 % of River watershed). MDC Reservoirs Are All Rated Class Aa. Lake McDonough Is Rated Class A. The Farmington River Mainstem Is Rated Class B Under Connecticut Law Class B Waters Cannot Be Used For Drinking Water Supply MDC DRINKING WATER RESERVOIRS TOTAL MDC Watershed 85.7 square miles (14 % OF TOTAL FARMINGTON RIVER watershed) Designation Of West Branch And Colebrook River Lake As Potential Drinking Water Sources Protects The West Branch From Future Industrial And Wastewater Discharges. The MDC does not make any withdrawals directly from The Farmington River 6


7 MDC S WATER COMES FROM SURFACE WATER RESERVOIRS 7

8 NOT FROM GROUNDWATER WELLS 8
9 9
10 MDC SAFE YIELD The CT DPH approved SAFE YIELD for the Barkhamsted/Nepaug Reservoir System is 77.1 MGD The MDC uses a more conservative approach (1960s drought) than the 1-in-100 year drought analysis required of all water companies by the CT DPH. Safe Yield using the CT DPH guidelines would be 83.9 MGD for Barkhamsted and Nepaug reservoirs. Safe yield calculation was developed and approved in 1996.DPH, DEEP, OPM and PURA reviewed and approved the water supply plan in 2003 and
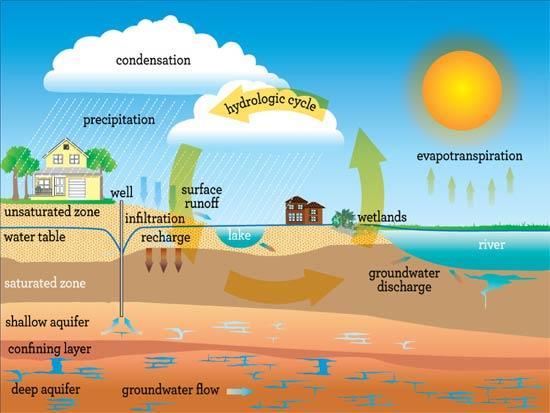
11 CALCULATION OF SAFE YIELD Factors Considered: STORAGE CAPACITY INFLOW: Direct Rainfall Run-off from Watershed (Typically 55-70% of precipitation) Transfers from other reservoirs OUTFLOW Water Supply Withdrawals Spillage over spillway Downstream releases Losses (Evaporation + Seepage) 11
12 12
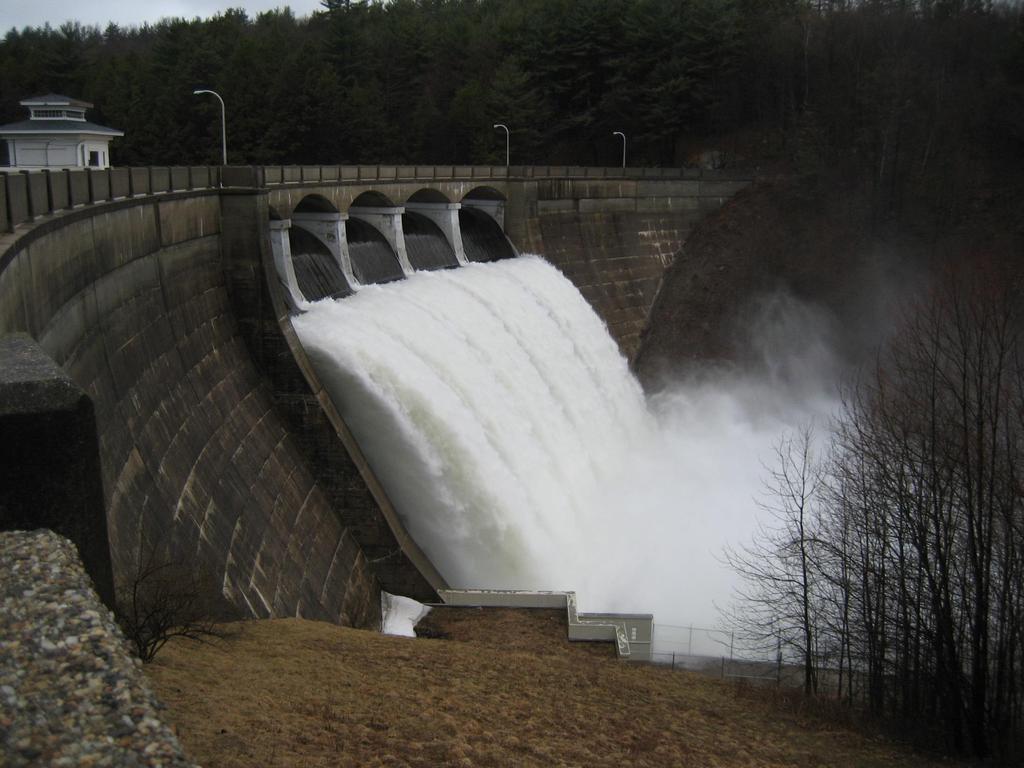
13 RESERVOIR INFLOWS AND OUTFLOWS 13
14 14
15 15
16 YEAR Average Daily Production (MGD) 1960s DROUGHT Total Annual Precipitation Nepaug Reservoir (inches) Precipitation Deficit (100 YR AVG 47 per year) Percent Capacity End of Year (Barkhamsted + Nepaug) Reservoir Levels Volume in Storage End of Year (Billion Gallons) Days Supply at Average Daily Demand (Days) 1965** **Safe yield of 77.1 MGD is based on the extreme drought event of
17 WHY THE 1960S DROUGHT IS STILL APPROPRIATE MDC s reservoirs are LARGE, Multi-Year Reservoirs. Larger reservoirs have sufficient storage to carry them through short term droughts (less than 1 year). Large reservoirs with storage ratios greater than 150 MG per Square mile are insensitive to short term droughts and have sufficient storage to last through multi year droughts such as 1960s. Historic Drought of Record for Connecticut. Almost 16-inch rainfall deficit. More Severe than 100 year drought. MDC s analysis uses real stream flow gage data which is monitored for changes. 17
18 DROUGHT Why aren t residents given priority over businesses in a drought? A mandatory restriction on public water for commercial entities so residential customers can wash their cars and water their lawns would effectively halt all commercial activity in the state, closing restaurants, manufacturing facilities, hospitals and alike. CT DPH already has the discretion to prioritize water customers in the event of an emergency under existing law. As to residential use, the MDC s drought contingency plan does not include ANY restrictions on the use of water for drinking and sanitary purposes under any circumstances. Historically, any time the MDC has requested a water use restriction in the last 50 years, it has been voluntary, including the severe drought of the 1960s. In fact, actual data recorded at the MDC s Nepaug Reservoir over the last 100 years has shown that the annual precipitation has increased by almost 10% over that time period. 18
. DROUGHT TRIGGERS: Days of Water Supply Remaining in reservoirs. Percent of Reservoir Capacity.")
19 DROUGHT CONTINGENCY PLANNING (MDC s DROUGHT CONTINGENCY PLAN is approved by CT DPH and is based on Connecticut Preparedness and Response Plan created by CT DEEP, CT DPH, CT DPUC, CT OPM, and CT Office of Emergency Management). DROUGHT TRIGGERS: Days of Water Supply Remaining in reservoirs. Percent of Reservoir Capacity. DROUGHT STAGES: Drought Advisory Drought Watch Drought Warning Drought Emergency 19

20 DROUGHT CONTINGENCY PLANNING MDC monitors: Reservoir Levels Precipitation Streamflows 20


21 MDC uses the 1960s drought to calculate its safe yield as it is the worst on record in CT, with a 16 inch rainfall deficit. Stream flow gages serve as real stream flow data confirmation that the safe yield calculations based on the drought of 1965 are still valid today. 21

22 USGS Data Hubbard River 22
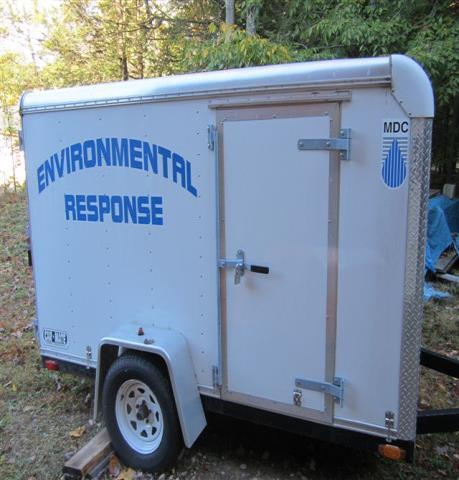
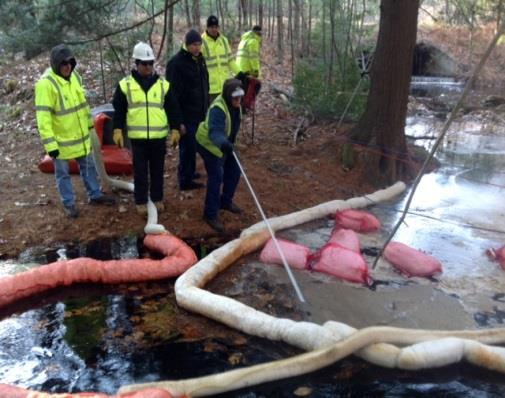
23 70 Hubbard River Gage-Mean Monthly Flow (MGD) Qmean Qmean Qmean
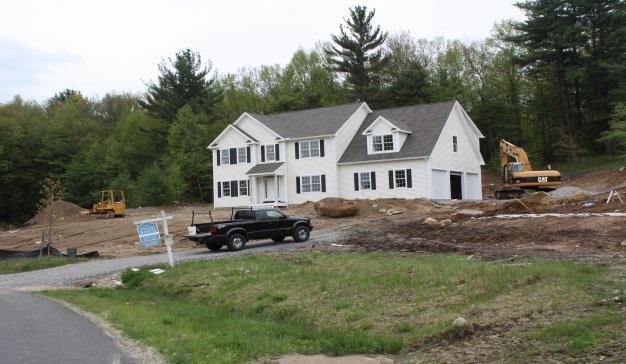
24 PLANNING FOR THE FUTURE IMPACT OF BUILDING and LAND DEVELOPMENT IMPACT OF CLIMATE CHANGE SOURCE WATER PROTECTION 24
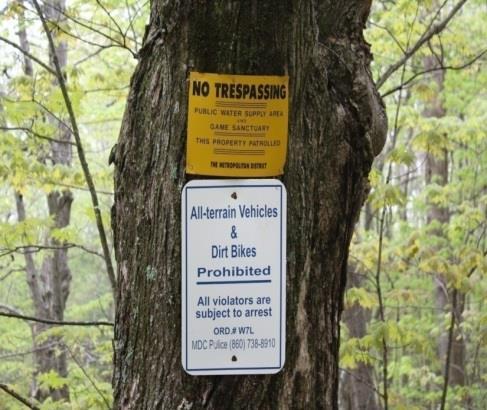
25 CHANGING CONDITIONS What we are seeing: Increasing ANNUAL RAINFALL Totals At MDC Reservoirs Over The Past Years. Increase In EXTREME STORM EVENTS and FLOODING. What we can expect Increase in average temperature. Continued increase in annual precipitation with more intense, heavy rain events. Impact on water quality due to increased run-off. Increase in Evaporation. 25
26 Total Precipitation (inches) Nepaug Reservoir- Total Annual Precipitation (Inches) YEAR 26
27 27

28 2016 Drought Outlook 28
29 29


30 MDC Watershed Management Unit Responsible for protecting and managing the lands that drain to our water supply reservoirs Goal is to provide an abundant source of clean water to our water treatment facilities 30


31 Source Water Protection Water quality sampling - reservoirs and streams Watershed inspections 31


32 Source Water Protection Review land use proposals in the watersheds Monitor on-going development & other activities Emergency spill response Patrol & enforcement 32

33 The cumulative impact of residential and other development results in more impervious surfaces (roads, driveways, parking lots, roof tops, sidewalks), less ground water infiltration, and an increase in storm water runoff to streams and reservoirs. A rule of thumb for any given watershed or drainage area: Water quality decreases as impervious surfaces increase. This graphic is taken from UCONN s NEMO Fact Sheet #3 entitled: Impacts of Development on Waterways. 33
 in the Barkhamsted Reservoir watershed through a partnership with the Commonwealth of MA, Town of Granville, and New England Forestry Foundation")
34 Source Water Protection Watershed Land Acquisition & Protection Acquired 211 acres since parcels in 3 different watersheds protected 2 parcels (715 acres) in the Barkhamsted Reservoir watershed through a partnership with the Commonwealth of MA, Town of Granville, and New England Forestry Foundation 34
35 35

36 A healthy forest and watershed protects both the quality and quantity of our water supply for the future. 36