Cooperative Policy Mechanism to Promote China s Renewable Energy Consumption based on CGE Model
|
|
|
- Joshua Rice
- 5 years ago
- Views:
Transcription
1 Cooperative Policy Mechanism to Promote China s Renewable Energy Consumption based on CGE Model Yongxiu He, Yuexia Pang North China Electric Power University 14 Feb.-17 Feb
2 Content Research Background Research Status Research Contents Conclusions 2
3 Research Background 3
4 Environment The rate of cities below the standard in air quality 100% 90% 80% 70% 60% 50% 40% 30% 20% 10% 0% SO₂ NO₂ PM10 PM2.5 O₃ CO The proportion of cities below the standard in China of 2013 The proportion of cities below the standard in China of 2014 China Beijing- Tianjin- Hebei area 100% 90% 80% 70% 60% 50% 40% 30% 20% 10% 0% SO₂ NO₂ PM10 PM2.5 O₃ CO The proportion of cities below the standard in Beijing-Tianjin-Hebei area of 2013 The proportion of cities below the standard in Beijing-Tianjin-Hebei area of % 90% 80% 70% Yangtze River Delta Pearl River Delta 100% 90% 80% 70% 60% 60% 50% 50% 40% 40% 30% 30% 20% 20% 10% 10% 0% SO₂ NO₂ PM10 PM2.5 O₃ CO 0% SO2 NO2 PM10 PM2.5 o3 co The proportion of cities below the standard in Yangtze River Delta of 2013 The proportion of cities below the standard in Yangtze River Delta of 2014 Data Sources: The proportion of cities below the standard in Pearl River Delta of 2013 The proportion of cities below the standard in Pearl River Delta of


5 Environment 22.90% 12.90% 8.00% 6.20% 47.60% 2.40% Excellent Good Severe contamination 5 High pollution Middle pollution Mild pollution 4.5 Average Number of Days of Air Quality in 2013 Data Sources: PM 2.5 in typical cities Beijing Tianjin Shijiazhuang Shanghai Nanjing Hangzhou Guangzhou Multiple relationship of PM2.5 based on "air quality standards"from WTO of 2014 Multiple relationship of PM2.5 based on "air quality standards"from China of

6 wind curtailment phenomenon TWh Wind curtailment of 2015 Wind curtailment of 2014 Wind curtailment rate 45% 40% Wind curtailment 35% 30% 25% 20% 15% 10% 5% 0% Year Jinlin Inner Mongolia Gansu Heilongjiang Liaoning Hebei Yunnan Xinjiang Data Sources: National renewable energy information management center ; National Energy Administration 6

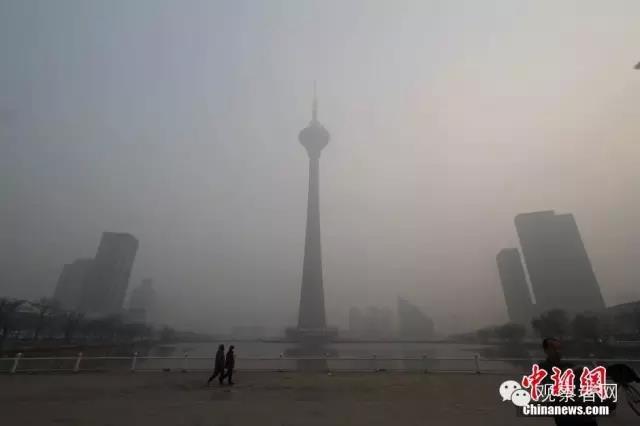
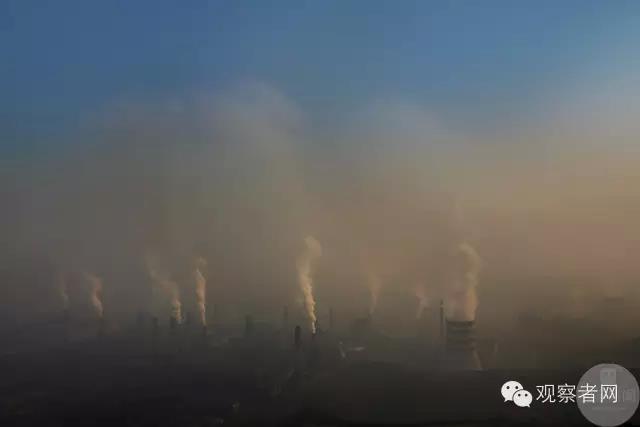
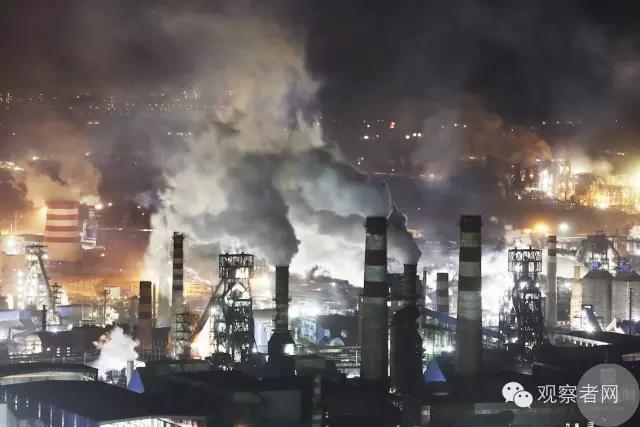
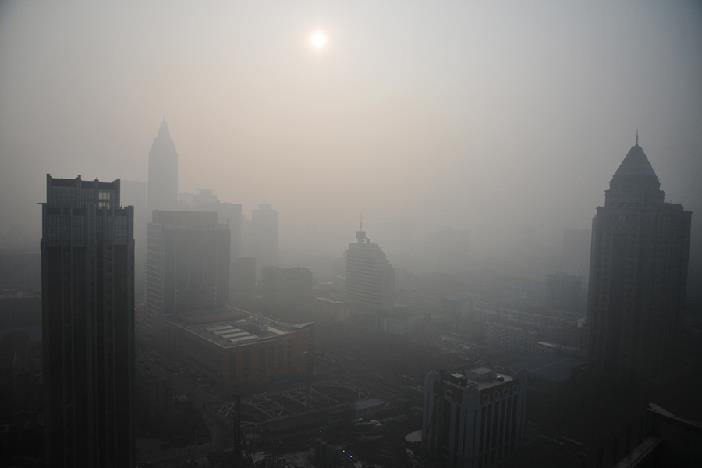
7 Solar and water curtailment phenomenon TWh 40% 35% 30% 25% 20% 15% 10% 5% Facing the so serious environment and renewable energy consumptive problem, it is important to research how to promote renewable energy consumption Solar curtailment Solar curtailment rate Year 0% TWh Solar curtailment in Gansu Year Prediction Water curtailment in Yunnan 7
8 Content Research Background Research Status Research Contents Conclusions 8

9 Renewable energy price policy in China One price one generator Benchmark prices for different resources area Benchmark price is 0.43 Yuan/kWh (After January ). Adjust benchmark prices for different resources area Government guides the feed-in tariff. Benchmark price for different production time The benchmark price is implemented in province. The price is negotiated by both parties across different provinces. Adjusted benchmark prices for different resources area Nuclear Wind power Solar power Hydropower 9
10 Electricity price in China 10
11 Renewable energy subsidy policy in China Wind power/ Solar power s subsidy per kwh Wind power/ Solar power s benchmark price Coal-fired power Units desulfurization benchmark price The total subsidy is from the electricity sell price uplift for renewable energy. And the renewable energy electricity price additional fund changes are as follows: 2005 Nov Dec. 1, 2011 Sept Present 0.2 Fen/kWh 0.4 Fen/kWh 0.8 Fen/kWh 1.5 Fen/kWh 11
12 Resources tax in China Participating in the cooperative exploitation of offshore petroleum resources of Chinese and foreign enterprises shall pay a concession. Resources tax would be levied for crude oil, natural gas and coal from October 1 in Threshold was set by profit rate, and the tax was progressive. According to the quantity of sales or self-use, resources tax was levied. For example, the coking coal rate is 6 Yuan/ton, the steam coal rate is between 2 Yuan/ ton and 4 Yuan/ton. The resources tax of coal was levied by quantity of sales or self-use, however, the resources tax of crude oil and natural gas were levied by sales, and the rate is 5%~10%. The resources tax of coal, crude oil and natural gas were levied by sales, and the rate of coal is 2%~10%, the rate of crude oil and natural gas is 5%~10%.
13 Environment tax in China Pollution Discharge Fee System is established. Environmental protection tax is studied. Levying Environmental tax at the right moment is proposing year 2003 year 2011 year 2012 year 2014 year 2015 year The pollution discharge fee is paid by polluters, according to species, the emission of pollutants. Pollution Discharge Fee System is improved. Enterprises, institutions and other production operators, who discharge taxable pollutants into the environment directly, are taxpayers.
14 Content Research Background Research Status Research Contents Conclusions 14
15 Structural framing Tax Research Contents Resource tax Environment tax Renewable Energy Consumption Environment Resource depletion Subsidy Price The highest price marginal cost 15
16 3.1 Tax model (1) Resources tax Taxation according to quantity T At = Q At At Taxation according to price T Bt = R Bt Bt Further improve resources tax rates on the basis of the existing tax burden level. 16
17 3.1 Tax model Environment tax R [ B ( Q ) B ( Q ) ] etax 1 coal coal 1 2 coal coal 2 [ B ( Q ) B ( Q ) ] 1 oil oil 1 2 oil oil 2 [ B ( Q ) B ( Q ) ] 1 gas gas 1 2 gas gas 2 Environment tax is the sum of carbon tax and sulfur tax. They are levied based on the carbon/sulfur content of the fuels in accordance with the standard specific duty in consumption links to compensate environment cost. 17
18 3.2 Subsidy model Renewable energy subsidy mechanism Environment cost resource depletion cost governance environment cost Health cost governance environment cost of carbon dioxide governance environment cost of sulfur dioxide governance environment cost of nitrogen oxide compound Illness cost Death loss 18
19 3.2 Subsidy model Governance environment cost C a q a q a q g CO CO SO SO NO NO X X Health cost C h P H (1 r ) P r HC q q eo L d eo d m HC m n i=1 Rf (1 ) n (1 r) n Resource Depletion Cost D R (1 r ) T Subsidy for per kwh renewable energy C C C D + g h 19
20 Basic principles 3.3 Price model During the initial stages of power system market, because of the oversupply of renewable energy, it can be accepted the electricity prices that could maintain a litter profit or compensate for the cost of electricity by electricity suppliers. The demanders can get benefits by using renewable energy compared with the use of fossil energy. The theoretical payoff matrix main body Purchase renewable energy demanders Not purchase renewable energy The highest price ( PQ bq C, PQ PQ) 0 d 1 d d i i e e 0, PQ PQ e e i i Suppliers The lowest price k 1 b B Q C, PQ PQ 1 1 d d i i e e (0, PQ PQ) e e i i 20

21 4 Scenario analysis by CGE model 12% 10% 8% 6% 4% 2% 0% 4.1 Environment tax of carbon dioxide policy 0.0% -1.0% -2.0% -3.0% -4.0% The change rate of carbon dioxide The change rate of sulfur dioxide The change rate of nitrogen oxide compound Environment The rate of carbon tax The rate of carbon tax Yuan/t The degree of substitution of electric power to fossil fuels 0.5% 0.0% -0.5% -1.0% -1.5% -2.0% -2.5% -3.0% -3.5% 12% 10% 8% 6% 4% 2% 0% The rate of carbon tax Yuan/t Fossil energy thermal power generation renewable energy Energy structure The rate of carbon tax Yuan/t The degree of substitution of renewable energy to fossil fuels With the increase of the carbon tax rate, the emissions of carbon dioxide, sulfur dioxide and nitrogen oxides gradually reduce, the consumptions of renewable energy gradually increase, and the ability that electricity power and renewable energy instead of fossil fuels gradually increases. 21
22 4.2 Carbon dioxide policy and subsidy policy 4 Scenario analysis by CGE model Comprehensive scenarios of carbon tax policy and subsidy policy Scenario I II III The rate of carbon tax The change rate of subsidy subsidy (Yuan/kW h) A IV 10 Yuan/t Base Scenari o (V) VI VII VIII -30% -20% -10% 0 10% 20% 30%
23 4 Scenario analysis by CGE model The change rate of GDP The change rate of energy consumption 0.10% 0.18% 0.08% 0.06% 0.13% 0.04% 0.08% 0.02% 0.00% -30% -20% -10% A 0% 10% 20% 30% 0.03% -0.02% -0.04% -0.02% -30% -20% -10% A 0% 10% 20% 30% -0.06% -0.08% -0.07% Fossil energy hydropower Wind power solar power the maximum amount of unit subsidy cannot exceed the environment cost of renewable energy. 23
24 4 Scenario analysis by CGE model 4.3 Environment tax of carbon dioxide policy, subsidy policy and price policy Comprehensive scenarios of carbon tax policy, subsidy policy and price policy scenario I II III IV V VI VII VIII IX The rate of carbon tax 10 Yuan/t Unit subsidy 0.24 Yuan/kWh k
25 4 Scenario analysis by CGE model The change rate of GDP The change rate of energy -0.18% -0.19% -0.20% -0.21% % 0.40% 0.35% 0.30% 0.25% 0.20% 0.15% -0.22% -0.23% -0.24% -0.25% 0.10% 0.05% 0.00% -0.05% -0.10% the change rate of fossil energy the change rate of wind power k In order to promote renewable energy consumption, the renewable energy market price should gradually reduce. Although the lower price of wind power is benefited to the stable of social economy, however, the minimum price should be marginal cost of unit subsidy to achieve sustainable development. 25
26 Content Research Background Research Status Research Contents Conclusions 26

27 5 Conclusions 1 Hydropower can be drew into Renewable Portfolio Standard, in order to promote the development of renewable energy in China Energy price, tax and subsidy policy should be maintained coordination in consideration of the balance of market supply and demand, including the coordination of administrative authorities. 3 In order to promote renewable energy consumptive, price, subsidies and tax policies should conform to the requirements of different development stages in the process of the gradual marketization of the power industry. 4 5 The coordination among tax, prices, subsidies, RPS, carbon trading, financial support and other policies can promote sustainable energy source system construction. 27
28 Thank you for your attention! 28