Subsurface Seawater Intake Gallery
|
|
|
- Lydia Page
- 5 years ago
- Views:
Transcription


1 Long Beach Water Department Subsurface Seawater Intake Gallery 7 Years and Going Strong Sunny Wang, Brown and Caldwell Tai Tseng, Long Beach Water Department Yan Zhang, Long Beach Water Department
2 Contents Long Beach Water Department (LBWD) Desalination Program Overview Demonstration Scale Seawater Intake Research and Findings Design Considerations Operation Data Flow Water Quality Environmental Conclusion Findings Upcoming Work Brown and Caldwell 2


3 LBWD Desalination Program Overview
4 Seawater Desalination Program A $20 M, 10-year investment Leverage various partnerships for technical input and other support Federal/state/local funds, 50% funding by U.S. Bureau of Reclamation Pretreatment Intake/Discharge NF 2 or RO Post Treatment/Distribution Subsurface Intake 7 years in operation Prototype UV/ClO 2 Mitigation of WQ impacts due to integration of new source Brown and Caldwell 4

5 Demonstration Scale Seawater Intake Research and Findings Design Considerations
6 Considerations for Seawater Intake Open Ocean Seawater Intake Lower cost intake option Impingement and entrainment of marine life Requires further pretreatment prior to membrane desalination (conventional or membrane pretreatment) Subsurface Seawater Intake Eliminates impingement and entrainment of marine life Reduces pretreatment requirements for SWRO Minimal industry experience Permitting Considerations in California (2006) Preference for subsurface intakes Need to conduct through feasibility analysis of subsurface intake options Brown and Caldwell 6
7 Available Subsurface Intake Options Intake Method / Technology Traditional Horizontal Collector Wells Modified Columbia Bottoms Method Infiltration Gallery/ Open Cut Construction Microtunneling Horizontal Directional Drilling Modified Vertical Well Technology Pressurized Water Jetting Remarks Established technology Capacity is limited by local hydrogeology Requires deep, permeable sand layer Long lateral lengths Uses conventional construction methods Concerns with construction dewatering and turbidity Minimal surface impacts Long lateral lengths High construction risk Minimal surface impacts Long lateral lengths High construction risk, long-term O&M Technology being developed for this application Need to be installed at an angle (typically installed vertically) Established technology Low cost Construction risk, long-term O&M Issues with scalability Unknown Variables Adequate cover for jacking pressure Suitability of geology Suitability of geology Adequate cover, drilling fluids Screen installation methodology No known application No large applications Brown and Caldwell 7


8 Site Specific Geotechnical and Hydrogeological Conditions Ocean floor topography is relatively flat and smooth = depth of -10 feet MSL approximately 300-ft offshore. Permeable sand layer extends to depths of 20 feet from parking lot to 200-ft offshore Seafloor is capped by up to 1-ft of very fine silty sand deposits Aquifer testing results: Low permeability due to fine sands Hydraulic conductivity of native beach sand ranges from 10 to 140 ft/day Brown and Caldwell 8
9 Available Subsurface Intake Options Intake Method / Technology Traditional Horizontal Collector Wells Modified Columbia Bottoms Method Infiltration Gallery/ Open Cut Construction Microtunneling Horizontal Directional Drilling Modified Vertical Well Technology Pressurized Water Jetting Remarks Established technology Capacity is limited by local hydrogeology Requires deep, permeable sand layer Long lateral lengths Uses conventional construction methods Concerns with construction dewatering and turbidity Minimal surface impacts Long lateral lengths High construction risk Minimal surface impacts Long lateral lengths High construction risk, long-term O&M Technology being developed for this application Need to be installed at an angle (typically installed vertically) Established technology Low cost Construction risk, long-term O&M Issues with scalability Unknown Variables Adequate cover for jacking pressure Suitability of geology Suitability of geology Adequate cover, drilling fluids Screen installation methodology No known application No large applications Brown and Caldwell 9

10 Research of Similar Subsurface Approaches Fukuoka Seawater Desalination Facility, Japan
11 Key Design Features Native beach sand replaced with engineered sand to increase overall yield/production A minimum cover of 5-ft is to be maintained throughout to protect the perforated plastic pipe A separation distance of 10-ft will be provided between collection pipes (zone of influence) Loading rate of the sand box will not exceed 0.1 gpm/ft 2 to mimic slow sand filtration Upflow discharge velocity shall not exceed the fluidization velocity of the discharge gallery sand Furthest offshore collection pipe for the infiltration gallery will be placed 10 ft past the mean lower low water elevation Nearest on-shore collection pipe will not be placed closer than the mean high water line Brown and Caldwell 11
12 Infiltration Gallery Design Criteria Criteria Average Sand Particle Size Virtual Sand Box Value 0.02 inches (0.50 mm) Uniform Coefficient 2 Density of Sand 100 1bs/ft 3 (1548 kg/m 3 ) Porosity 0.25 D 60 Limiting Hydraulic Conductivity Infiltration Gallery Intake Rate (as determined by hydrogeological modeling) 1.0 mm 100ft/day (1.2 x 10 3 ft/s) 1.6 gpm/ft of lateral Max Surface Loading Ocean Floor w/ 10ft separation (based on engineered sand) 0.16 gpm/ft 2 Operating Loading Rate 0.10 gpm/ft 2 Number of Collection 60ft length 5 Total Surface Area (based on 10ft separation) 3100 ft 2 Operating Capacity 0.40 mgd (250 gpm) Max Intake Capacity 0.70 mgd (550 gpm) Brown and Caldwell 12

13 Brown and Caldwell 13

14 Rendering of Submerged Intake/Discharge System Brown and Caldwell 14


15 Under Ocean Seawater Intake System Engineered Sand 1 Engineered Sand 2 Slotted PVC Screens Brown and Caldwell 15


16 Construction of Under Ocean Floor Seawater Intake and Discharge System Brown and Caldwell 16
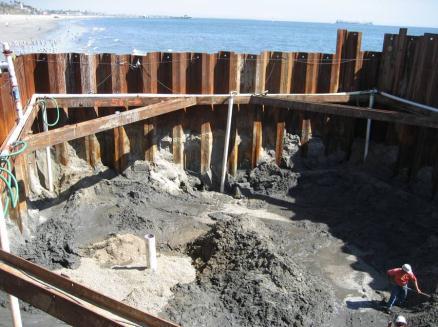


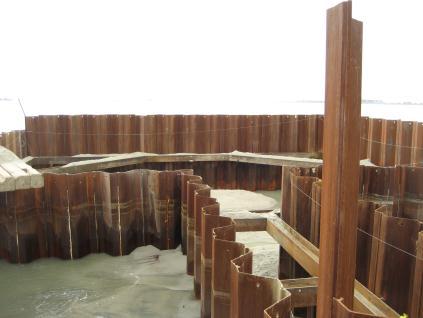

17 Construction Photos Brown and Caldwell 17
18 Demonstration Scale Seawater Intake Research and Findings Operational Data

19 View at Low Tide Brown and Caldwell 19
20 Research Objectives and Approach Can we sustain overall yield from intake? Investigate infiltration rates of 0.05, 0.10, and 0.15 gpm/ft 2. System capacity investigation Determine pretreatment water quality for downstream treatment processes Continuous filtrate monitoring Bi-weekly raw and filtrate grab sample monitoring Rain, tidal and upstream water quality impacts Quantify environmental impact (e.g. impingement and entrainment) Video survey Brown and Caldwell 20
21 Flow through system (Jun '08- Oct '08, 155 gpm or 0.05 gpm/ft 2 ) Yield Tide Wet well level Yield, gpm/ft Level, ft /11/08 7/21/08 7/31/08 8/10/08 8/20/08 8/30/08 9/9/08 9/19/08 9/29/08 Brown and Caldwell 21
22 Flow through system (Oct '08- Mar '09, 310 gpm or 0.1 gpm/ft2) Brown and Caldwell 22

23 Flow through system (Sep 10- Jul 12, 465 gpm or 0.15 gpm/ft 2 ) Brown and Caldwell 23
 10-12 inch local sand on top")

24 Sand Profile in the Filter Bed (-1 ft tide) inch local sand on top Engineered sand inch local sand on top Engineered sand Brown and Caldwell 24
25 Filter Bed at Low Tide filter bed Brown and Caldwell 25
26 System Capacity Investigation Frequent system shut downs at 465 gpm (0.15 gpm/ft 2 infiltration rate) Possible air binding/local sand build up on top reduced the capacity Side contribution is significant Maximum sustainable yield? Brown and Caldwell 26

27 System Yield at Fixed Wet Well Level (Jul 12-Current, daily yield 0.05 to 0.2 gpm/ft 2 ) Brown and Caldwell 27
28 Yield Testing Summary The system can maintain consistent production at 0.05 and 0.10 gpm/ft 2 (normal design capacity). The system will frequently shut down on low wet well level at 0.15 gpm/ft 2 (max design capacity) Daily system yield ranges from 0.05 to 0.2 gpm/ft 2 when maintaining wet well level Brown and Caldwell 28
29 Rain/Sewage Spill Impact 1,800 1,600 Raw Water Coliform Filtrate Coliform Sewer Spill 1,400 Total Coliform, cfu/100 ml 1,200 1, inch 0.34 inch 0.44 inch 0.30 inch 3 day cumulative rain /29/10 10/9/10 10/19/10 10/29/10 11/8/10 11/18/10 Brown and Caldwell 29
30 Water Quality Summary The intake filtrate can consistently maintain high water quality When raw water microbial level spikes due to rain and upstream sewer spill, the intake system consistently removes microbial contaminant Brown and Caldwell 30


31 Visual Inspection Evidence infiltration system is not entraining marine life after 1 year of operation after 6 years of operation Brown and Caldwell 31
32 Marine Entrainment What you do not want to see Brown and Caldwell 32
33 Conclusion
34 Findings Operation The system can maintain production at design capacity The system maintains high product water quality (< 0.2 NTU) and prevents microbial contamination in the event of raw water deterioration No indication of marine life entrainment Future Design Considerations Place the system at a location with good local sand permeability Ensure saturated bed level, even during low tide, to prevent air binding Consider contribution from all sides of the infiltration gallery when estimating capacity Brown and Caldwell 34
35 Future Work Continue operation of the intake system and monitor long term system performance Survey system changes over time Brown and Caldwell 35
36 Acknowledgement Long Beach Water Department treatment plant maintenance and water quality lab staff California Department of Water Resources and the U.S. Bureau of Reclamation for partial funding of this project Technical Advisory Committee: Dr. Steve Duranceau, Steven Hubbs, and Gary Logsdon Black & Veatch Brown and Caldwell 36
37 Thank you. Questions?