PHPP V9.6 Validation using ANSI/ASHRAE Standard
|
|
|
- Lisa Terry
- 5 years ago
- Views:
Transcription
1 PHPP V9.6 Validation using ANSI/ASHRAE Standard Prepared for: Passive House Canada, Passive House California, New York Passive House, and the Passive House Institute Prepared by: Remi Charron, Sole Proprietor Remi Charron Consulting Services January 23, 2019
2 EXECUTIVE SUMMARY Introduction The Passive House Canada, Passive House California, New York Passive House and the Passive House Institute contracted Remi Charron Consulting Services, to test PHPP Version 9.6 using ANSI/ASHRAE Standard 140 in order to give more building officials the authority to accept PHPP as an energy model for building code energy performance compliance. The project objectives were to: 1. Evaluate PHPP using the ASHRAE Standard test cases and to record the results; 2. Examine and comment on PHPP s predictions in comparison to benchmarks provided in Standard 140 and suggest sources of observed differences; and 3. Document findings in a comprehensive report. ASHRAE Standard Originally published in 2001, this standard is in its 5 th edition released in 2017 (previous versions in 2001, 2007, 2011 and 2014). Each different edition increased the number of test cases, but otherwise stayed the same. ANSI/ASHRAE Standard , Standard Method of Test for the Evaluation of Building Energy Analysis Computer Programs, is a comprehensive standard method of test (SMOT) for evaluating whole building energy analysis and simulation software programs. These tests are part of an overall validation methodology. The validation tests consist of a series of carefully described sample case building plans and mechanical equipment specifications. Results from modelling the different cases with the software being tested are compared to those of reference software results and used in conjunction with diagnostic logic to determine the sources of predictive differences. ASHRAE Standard 140 classifies tests in two different classes: Class I (Section 5) test cases detailed diagnostic tests mainly intended for hourly and sub-hourly energy analysis programs. Class I tests are designed to test algorithms for building envelope, solar and internal gains and space heating, cooling and ventilation systems. Class II (Section 7) test cases whole building load calculations regardless of time steps geared towards simplified software for residential buildings. Class II test cases are geared towards whole building energy analysis and these test cases have been taken from the Home Energy Rating System Building Energy Simulation Test (HERS BESTEST) 2. HERS BESTEST is a comparative validation method for evaluating building energy software used for home energy rating. The 2014 version of Std 140 extended test cases for ground-coupling (for slab-on-grade, crawlspace and basement foundations). No substantive change to Class II test cases were introduced in the 2017 release. Given that PHPP is not an hourly simulation tool, but used in evaluating annual building energy use, the validation of PHPP V9.6 only considered ASHRAE Standard Class II test cases. Compliance Std 140 does not specify pass/fail criteria for evaluating an energy analysis software. Informative ANNEX B22 of the Standard provides guidance on developing an acceptance range in which the results of the 1 ANSI/ASHRAE Standard , Standard Method of Test for the Evaluation of Building Energy Analysis Computer Programs, Published by ASHRAE Inc., Atlanta, GA. 2 Procedures for Verification of RESNET Accredited HERS Software Tools, RESNET Publication No , Published by Residential Energy Services Network, Inc., Oceanside, CA. ( PHPP V9.6 Validation using ANSI/ASHRAE Standard i
3 tested software should fall within. Using the guidance provided, the acceptance range was calculated by finding minimum and maximum confidence intervals using the largest range by either adding +/- 4 million Btu (~ 4.2 GJ or 1170 kwh) 3 to the range of results from the reference software, or calculating the statistical 93% confidence interval of the range of reference results. Whole House Energy Analysis - Class II Results The results of PHPP agreed very well with those of the other software. Table 1 presents the results of the modelled heating energy consumption and Table 2 presents the cooling results for the Class 2 test cases. For heating, PHPP results fell within the confidence interval in all cases. For sensible cooling energy demand, PHPP was within the confidence interval for all but the case testing the impact of a south-facing overhang, where PHPP predicted more cooling energy savings than the reference software. The Passive House Institute is currently developing a more detailed shading analysis for their Sketchupbased PHPP preprocessor designph, which could be used in cases where building designs are relying on shading to achieve design objectives. Table 1: ASHRAE Standard 140 Class II Annual Heating Loads (10 6 Btu/y = ~1 GJ/year) Test Case Description Min. Confidence Max Confidence PHPP v9.6 % Beyond Range L100A Base case % L110A High infiltration test % L120A Well insulated walls and roof % L130A Double low-e windows % L140A Zero window area % L150A All south-facing windows % L155A South facing overhangs % L160A East/West window orientation % L170A No internal loads % L200A Low efficiency construction % L202A Low exterior solar absorptance % L302A Uninsulated slab-on-grade % L304A Perimeter insulated slab % L322A Uninsulated full basement % L324A Insulated full basement % L165A East/West shaded windows % P100A Passive solar base case % P105A South window overhangs % P110A Low mass version of P % P140A Zero window area % P150A Even window distribution % 3 This range, suggested in the Std 140, is a reasonable threshold of economic uncertainty. It means the energy analysis of software disagreements within this range would result in relatively insignificant utility cost disagreements based on principal fuel charges, and also on the overall total energy utility costs for a homeowner. PHPP V9.6 Validation using ANSI/ASHRAE Standard ii
4 Table 2: Standard 140 Class II Results Annual Sensible Cooling Loads (10 6 Btu/y = ~1 GJ/year) Test Case Description Min Confidence Max Confidence PHPP v9.6 % Beyond Range L100A Base case % L110A High infiltration test % L120A Well insulated walls and roof % L130A Double low-e windows % L140A Zero window area % L150A All south-facing windows % L155A South facing overhangs % L160A East/West window orientation % L170A No internal loads % L200A Low efficiency construction % L202A Low exterior solar absorptance % L165A East/West shaded windows % P100A Passive solar base case % P105A South window overhangs % P110A Low mass version of P % P140A Zero window area % P150A Even window distribution % Figure 1 and Figure 2 present the heating and cooling results, respectively, in a graphical format. PHPP V9.6 Validation using ANSI/ASHRAE Standard iii
5 Figure 1: ASHRAE Standard 140 Class II Annual Heating Loads (10 6 Btu/y = ~1 GJ/year) Figure 2: Standard 140 Class II Results Annual Sensible Cooling Loads (10 6 Btu/y = ~1 GJ/year) PHPP V9.6 Validation using ANSI/ASHRAE Standard iv
6 Conclusions In the ASHRAE standard 140, results from modelling the different cases with the software being tested are compared to those of reference software results. ASHRAE standard 140 suggests a confidence interval, which describes a reasonable threshold of economic uncertainty. It means the energy analysis of software disagreements within this range would result in relatively insignificant utility cost disagreements based on principal fuel charges. For a total of 38 test cases described by ASHRAE 140, PHPP results were within the confidence interval of the reference software for all but one case, which modelled the impact of a south window overhang on cooling energy demand. PHPP V9.6 Validation using ANSI/ASHRAE Standard v
7 Table of Content EXECUTIVE SUMMARY... i Table of Content... vi 1. Introduction This Report Background Class 2 Test Cases Base Case House Description Class 2 Validation Results Further Results Analysis Conclusions Space Heating Space Cooling Appendix A Modeling Notes for Class 2 ASHRAE Standard Introduction Software Information Alternative Modelling Methods Equivalent Modelling Methods Use of Non Specified Inputs Omitted Test Cases and Results Changes to Source Code Anomalous Results Appendix B CLASS 2 Results PHPP V9.6 Validation using ANSI/ASHRAE Standard vi
8 List of Figures Figure 1: Diagram of base building for Cases L100A through L324A Figure 2: Plan view of Case P100A showing window, door, and mass wall locations Figure 3: ASHRAE Standard 140 Class II Annual Heating Loads (10 6 Btu/y = ~1 GJ/year) Figure 4: Standard 140 Class II Results Annual Sensible Cooling Loads (10 6 Btu/y = ~1 GJ/year) Figure 5: Typical window module used in Class II test cases Figure 6: Window and overhangs used for Case L Figure 7: Windows and shading used for Test Case L Figure 8: Differences in heating and cooling energy demand between cases with all south facing windows with overhangs (L155) and without (L50) and with all East and West facing windows with shading (L165) and without shading (L160) Figure 9: Difference in annual heating and sensible cooling energy demand comparing the passive solar design case with thermal mass (P100) versus without additional thermal mass (P110) Figure 10: Differences in heating and cooling energy demand between cases with all south facing windows with overhangs (L155) and without (L50) and with all East and West facing windows with shading (L165) and without shading (L160) using specified heat capacity List of Tables Table 1a: ASHRAE 140 Class 2 Confidence Intervals for Heating Applying Annex B Table 1b: ASHRAE 140 Class 2 Confidence Intervals for Cooling Applying Annex B Table 2: Description of Class 2 test cases used for ASHRAE 140 validation... 7 Table 3: ASHRAE Standard 140 Class II Results Annual Heating Loads (10 6 Btu/y)... 8 Table 4: ASHRAE Standard 140 Class II Results Annual Sensible Cooling Loads (10 6 Btu/y) 9 Table 5: PHPP Shading Tab Modelling Inputs PHPP V9.6 Validation using ANSI/ASHRAE Standard vii
9 1. Introduction Passive House Canada, Passive House California, New York Passive House and the Passive House Institute contracted Remi Charron Consulting Services, to test PHPP Version 9.6 using ANSI/ASHRAE Standard 140 in order to give more building officials the authority to accept PHPP as an energy model for building code energy performance compliance. The project objectives were to: Evaluate PHPP using the ASHRAE Standard test cases and to record the results; Examine and comment on PHPP s predictions in comparison to benchmarks provided in Standard 140 and suggest sources of observed differences; and Document findings in a comprehensive report. 1.1 This Report This report presents the findings of the study. The main report summarizes the compliance assessment of PHPP version 9.6. ASHRAE Standard 140 has a standard reporting method for documenting assumptions and reporting results. This reporting is found in the Appendices. 1.2 Background ASHRAE Standard Originally published in 2001, this standard is in its 5 th edition released in 2017 (previous versions in 2001, 2007, 2011 and 2014). Each different edition increased the number of test cases, but otherwise stayed the same. ANSI/ASHRAE Standard , Standard Method of Test for the Evaluation of Building Energy Analysis Computer Programs, is a comprehensive standard method of test (SMOT) for evaluating whole building energy analysis and simulation software programs. These tests are part of an overall validation methodology. The validation tests consist of a series of carefully described sample case building plans and mechanical equipment specifications. Results from modelling the different cases with the software being tested are compared to those of reference software results and used in conjunction with diagnostic logic to determine the sources of predictive differences. ASHRAE Standard 140 classifies tests in two different classes: Class I (Section 5) test cases detailed diagnostic tests mainly intended for hourly and sub-hourly energy analysis programs. Class I tests are designed to test algorithms for building envelope, solar and internal gains and space heating, cooling and ventilation systems. Class II (Section 7) test cases whole building load calculations regardless of time steps geared towards simplified software for residential buildings. Class II test cases are geared towards whole building energy analysis and these test cases have been taken 4 ANSI/ASHRAE Standard , Standard Method of Test for the Evalaution of Building Energy Analsysis Computer Programs, Published by ASHARE Inc., Atlant, GA. PHPP V9.6 Validation using ANSI/ASHRAE Standard
10 from the Home Energy Rating System Building Energy Simulation Test (HERS BESTEST) 5. HERS BESTEST is a comparative validation method for evaluating building energy software used for home energy rating. The 2014 version of Std 140 extended test cases for ground-coupling (for slab-on-grade, crawlspace and basement foundations). No substantive changes for Class II test cases were introduced in the 2017 version. Given that PHPP is not hourly simulation tool, but used in evaluating the annual building energy use, the validation of PHPP V9.6 only considered ASHRAE Std Class II test cases ASHRAE Standard 140 Evaluation Criteria There is no pass/fail criteria established in Std 140 when testing a software. Certifying or accrediting agencies can develop an acceptance range for a tested software following procedures presented in Informative ANNEX B22 Example Procedures for Developing Acceptance Range Criteria. The informative annexes are not part of the official standard, and it is clearly stated that: it is intended to be illustrative only and that it does not imply in any way that results from software tests are required by Standard 140 to be within any specific limits. The use of statistical confidence intervals provides a theoretical basis for developing acceptance ranges. It was determined empirically that, for most cases, confidence coefficients corresponding to confidence intervals in the range of 80% to 95% yield reasonable acceptance ranges. The acceptance range is calculated statistically using the following equations where the confidence coefficient varies depending on the desired confidence intervals and sample size: The challenge in following this approach is that selecting the confidence level varies between 80% and 95% for each test case, depending on the range of results between the minimum and maximum heating demand calculated in the reference software. Using a higher (e.g. 95%) confidence interval can widen the acceptance range to a point where the test cases lack meaning (i.e. are too easy to pass) and using lower values (e.g. 80%) can make it too narrow. For this project, the recommended range of 93% was used. In addition to the statistical confidence intervals, Informative ANNEX B22 provides a second method to evaluate the confidence interval, and recommends to take the larger range between the two methods for each case. In the second method, it adds an allowance of ±5% of the base case (e.g. Case L100A) mean heating demand 6 to the range of reference software results:. 5 Procedures for Verification of RESNET Accredited HERS Software Tools, RESNET Publication No , Published by Residential Energy Services Network, Inc., Oceanside, CA. 6 This range, suggested in the Std 140, is a reasonable threshold of economic uncertainty. It means the energy analysis of software disagreements within ±5% of the reference results extremes for a given case, would result in relatively insignificant utility cost disagreements based on principal fuel charges, and also on the overall total energy utility costs for a homeowner. PHPP V9.6 Validation using ANSI/ASHRAE Standard
11 This range provides a reasonable threshold of economic uncertainty. That is, any software disagreements within ±5% of the reference results extremes for a given case, would result in relatively insignificant utility cost disagreements and therefore should not be cause for eliminating a given software tool. ANNEX B22 goes on to say that depending on fuel prices, climate, mortgage lending policy, and other circumstances in specific regions, it may make sense to adjust this criterion. Table 1a presents the calculated confidence interval for heating energy demand, and Table 1b, presents calculated confidence intervals for the cooling energy demand used in this report. Table 1a: ASHRAE 140 Class 2 Confidence Intervals for Heating Test Case BLAST 3.0 DOE 2.1E SERIES 5.7 Min. 93% Conf. Int. Max 93% Conf. Int. Min +/- 4 Mbtu Max +/- 4 Mbtu Min Conf. Interval L100A Max Conf. Interval L110A L120A L130A L140A L150A L155A L160A L170A L200A L202A L302A L304A L322A L324A L165A P100A P105A P110A P140A P150A PHPP V9.6 Validation using ANSI/ASHRAE Standard
12 Table 1b: ASHRAE 140 Class 2 Confidence Intervals for Cooling Test Case BLAST 3.0 DOE 2.1E SERIRES 5.7 Min. 93% Conf. Int. Max 93% Conf. Int. Min +/- 4 Mbtu Max +/- 4 Mbtu Min Conf. Interval L100A L110A L120A L130A L140A L150A L155A L160A L170A L200A L202A L165A P100A P105A P110A P140A P150A It is important to note that this acceptance range is provided for reference purposes and that there is no pass/fail criteria established in Std 140 when testing a software. Max Conf. Interval PHPP Version 9.6 According to the Passive House Institute, the Passive House Planning Package 7 : was introduced for the first time in 1998 and has been continually further developed ever since. Calculation sheets for space heating balances (annual and monthly methods), and for heat distribution and supply as well as for the electricity and primary energy demand, constitute the main features of this tool. Essential modules were successively supplemented for the practical planning of energy efficiency projects throughout the world, including the calculation of characteristic values of windows, shading, heating load and summer behaviour, cooling and dehumidification demand, ventilation for large objects and non-residential buildings, taking into account of renewable energy sources, and EnerPHit certification (retrofitting of existing buildings). The PHPP is continually being validated and extended on the basis of measured values and new research findings. In the context of accompanying scientific research in several objects, measured results were compared with the calculated results. In the process, a high correlation could be demonstrated between the demand calculated using the PHPP 7 PHPP V9.6 Validation using ANSI/ASHRAE Standard
13 and the consumption ascertained through scientific monitoring projects. With careful planning of building efficiency, there will be no performance gaps. 2. Class 2 Test Cases 2.1 Base Case House Description The Std 140 validation exercise works by modelling a base house in the software being evaluated and comparing its predicted heating and cooling energy demand against the results of other reference software programs. One change to the house model is made at a time, and the results are again compared to those from reference software. In addition to simply comparing the overall heating and cooling energy consumption, comparisons are made in the change in modelled energy consumption from one case to the other. For example, heating energy consumption is evaluated for the base house (Case L100). For the next Case L110, the modelled infiltration rate is changed. When evaluating the results, both the heating energy consumption of the house with higher ventilation rates, and the increase in space heating that occurred by increasing the ventilation rate are examined. For Class 2 test cases, PHPP results are compared against those from Blast 3.0, DOE 2.1E and SRES/SUN 5.7. Heating results are calculated using a Colorado climate file, and cooling results are based on a Las Vegas weather file, with the exception of the passive solar cases where cooling is calculated using the Colorado climate. The base case house is 27 ft x 57 ft (8.2 m x 17.4 m) and is depicted in Figure 1. There is a series of passive solar test cases that use the same footprint, but have only south facing windows, more thermal mass, better windows and more insulation (Figure 2). Figure 1: Diagram of base building for Cases L100A through L324A. PHPP V9.6 Validation using ANSI/ASHRAE Standard
14 Figure 2: Plan view of Case P100A showing window, door, and mass wall locations. Table 2 8 lists the Class 2 test cases that are used for the Std 140 validation. As described, a base case is first modelled (L100) and then one parameter is changed at a time to see its impact on modelled heating and cooling energy consumption. Table 2 provides a description of the parameter that was changed as well as its modelled value. 8 Table extracted from : Haltrecht, D., K. Fraser Validation of HOT2000 using HERS BESTEST. Fifth International IBPSA Conference, Prague, Czech Republic. PHPP V9.6 Validation using ANSI/ASHRAE Standard

15 Table 2: Description of Class 2 test cases used for ASHRAE 140 validation 2.2 Class 2 Validation Results The results of PHPP agreed very well with those of the other software. Table 3 presents the results of the modelled heating energy consumption and Table 4 presents the cooling results for the Class 2 test cases. For heating, PHPP results fell within the confidence interval in all cases. For sensible cooling energy, PHPP was within the confidence interval for all but the case testing the impact of a south-facing overhang, where PHPP predicted more cooling energy savings than the reference software. Figure 3 and Figure 4 present the heating and cooling results, respectively, in a graphical format. PHPP V9.6 Validation using ANSI/ASHRAE Standard
16 Table 3: ASHRAE Standard 140 Class II Results Annual Heating Loads (10 6 Btu/y) DOE Min. BLAST 3.0 SERIES 5.7 Test Case Description 2.1E Confidence Max Confidence L100A Base case % L110A High infiltration test % L120A Well insulated walls and roof % L130A Double low-e windows % L140A Zero window area % L150A All south-facing windows % L155A South facing overhangs % L160A East/West window orientation % L170A No internal loads % L200A Low efficiency construction % L202A Low ext. solar absorptance % L302A Uninsulated slab-on-grade % L304A Perimeter insulated slab % L322A Uninsulated full basement % L324A Insulated full basement % L165A East/West shaded windows % P100A Passive solar base case % P105A South window overhangs % P110A Low mass version of P % P140A Zero window area % P150A Even window distribution % PHPP v9.6 % Beyond Range PHPP V9.6 Validation using ANSI/ASHRAE Standard
17 Table 4: ASHRAE Standard 140 Class II Results Annual Sensible Cooling Loads (10 6 Btu/y) Test Case Description BLAST 3.0 DOE 2.1E SERIRES 5.7 Min Confidence Max Confidence PHPP v9.6 L100A Base case % L110A High infiltration test % L120A Well insulated walls and roof % L130A Double low-e windows % L140A Zero window area % L150A All south-facing windows % L155A South facing overhangs % L160A East/West window orientation % L170A No internal loads % L200A Low efficiency construction % L202A Low exterior solar absorptance % L165A East/West shaded windows % P100A Passive solar base case % P105A South window overhangs % P110A Low mass version of P % P140A Zero window area % P150A Even window distribution % % Beyond Range PHPP V9.6 Validation using ANSI/ASHRAE Standard
18 Figure 3: ASHRAE Standard 140 Class II Annual Heating Demand (10 6 Btu/y = ~1 GJ/year) Figure 4: Standard 140 Class II Results Annual Sensible Cooling Demand (10 6 Btu/y = ~1 GJ/year) PHPP V9.6 Validation using ANSI/ASHRAE Standard
19 2.3 Further Results Analysis In comparing results of PHPP to those of the reference software, one must both compare results for each specific case, as well as the difference in modelled energy use between cases to examine the impact of specific modelling inputs. This section will examine results where the differences in PHPP results between test cases varied more significantly from the differences observed from the reference software. Specifically, this will include: 1. Shaded versus unshaded windows 2. Passive solar design with and without thermal mass. In order to give another data-point for comparison purposes, results from HOT are also presented. HOT2000 is an energy simulation and design tool for low-rise residential buildings, which is currently the de-facto choice for energy advisors in Canadian residential market for energy analysis. The results from HOT2000 were taken from a 2018 conference paper Shaded versus Unshaded Windows Case L150 is the same as the base case (L100A), except that all the windows are on the south façade. For Case L155, a 2.5 feet (0.76 m) overhangs is added over the south facing windows. Case L160 is modeled exactly as the base case (L100A), except that all windows are moved to the east and west walls. Case L165A is modeled exactly as Case L160A, except that an opaque overhang and ten opaque fins are added to the east and west walls for shading. Figure 5 shows the dimensions of the individual windows modelled. Figure 6 shows the south-facing shading, and Figure 7 shows the east/west shading. In PHPP, each individual window was modelled as two separate windows, one depicting the top half, and the other depicting the bottom half in order to more accurately account for the middle framing element in the shading calculations. The vertical shading elements were modelled using PHPP s Lateral Reveal inputs in the Shading Tab. PHPP Shading Tab modelling inputs are presented in Table 5. 9 HOT2000 Residential Energy Analysis Program. Housing division, Office of Energy Efficiency, Natural Resources Canada, Ottawa Available for free download at 10 A. Parekh, R. Charron, S. Poirier, L. Roux, Testing of HOT2000 version 11 in Accordance with ASHRAE Standard esim 2018 Conference, Montreal, Canada, May PHPP V9.6 Validation using ANSI/ASHRAE Standard
20 Figure 5: Typical window module used in Class II test cases Figure 6: Window and overhangs used for Case L155 PHPP V9.6 Validation using ANSI/ASHRAE Standard
21 Figure 7: Windows and shading used for Test Case L165 Table 5: PHPP Shading Tab Modelling Inputs Lateral reveal Overhang Description Window reveal depth Distance from glazing edge to reveal Overhang depth Distance from upper glazing edge to overhang o Reveal [m] d Reveal [m] o over [m] d over [m] OH Case L155 Top OH Case L155 Bottom L165 East/West Top L165 East/West Bottom Figure 8 shows the impact of the shading on heating and cooling energy demand calculated by all of the software. HOT2000 does not have the capability to model vertical shading elements, thus results for the shaded vs unshaded East and West facing windows are not presented for HOT2000. For the South-facing windows and shading, PHPP modelled a heating energy demand increase of 5.4 MBtu (1,580 kwh) compared to roughly 2.8 MBtu (820 kwh) for the reference software and for cooling, PHPP modelled a reduction in cooling energy demand of 21.8 MBtu (6,400 kwh) compared to between 13.6 and 18.3 MBtu (4,000 and 5,400 kwh) for the reference software. This indicates that PHPP finds that southfacing overhangs have a larger energy impact than what is modelled by the reference software. For the East/West windows and shading, PHPP calculates a higher increase in space heating energy demand with the shading than the reference software, but the cooling energy demand reduction is within the range of the reference software. In all cases, the differences calculated with PHPP are within 4 MBtu (1,200 kwh) of the difference calculated by the reference software, which is the recommended compliance range provided in Informative ANNEX B22. PHPP V9.6 Validation using ANSI/ASHRAE Standard
22 Figure 8: Differences in heating and cooling energy demand between cases with all south facing windows with overhangs (L155) and without (L50) and with all East and West facing windows with shading (L165) and without shading (L160) Passive Solar Design with and without Thermal Mass For the L100 series of test cases, the total thermal capacity of the building is given as 6006 BTU/ºF, and for 143 m 2 floor area, equals 22.3 Wh/m 2. The PHPP manual says that 60 Wh/m 2 should be used as a minimum, and this was followed for the analysis. For the higher thermal mass P100 series of test cases, the total thermal capacity provided is BTU/F, or 84.5 Wh/m 2. However, PHPP says to start with 60 Wh/m 2, and add 24 Wh/m 2 for each massive envelope component. For P100, there would be a floor, and an internal wall that are massive, resulting in a Specific Heat Capacity (SHC) of 60+2 x24 = 108 Wh/m 2. Given that for the other cases, the PHPP instructions were followed, the same was done for P100 where the Specific Capacity in the Verification worksheet was set to 108 Wh/m 2. Figure 9 presents differences in annual heating and sensible cooling energy demand comparing the passive solar design base case with thermal mass (P100) versus without additional thermal mass (P110). Case P100 has heavy mass elements added to the design as discussed in Section 2.1. The space heating energy demand savings associated with the thermal mass is only 4.2 x 10 6 Btu (1,200 kwh), whereas it ranged from 9.4 to 10.2 x 10 6 Btu for the reference software. For cooling, PHPP predicts only 5.3 x 10 6 Btu (1,600 kwh), whereas it ranged from 10.8 to 13.5 x 10 6 Btu (3,200 to 4,000 kwh) for the reference software. HOT2000 does not consider the impact of thermal mass in its cooling load calculations, so its cooling results are significantly different. The differences calculated with PHPP are just above the 4 MBtu (1,200 kwh) from the reference software results, indicating that it would be very close to the range of economic uncertainty. PHPP V9.6 Validation using ANSI/ASHRAE Standard
 instead of following the PHPP instructions.")

23 Figure 9 also presents the results of the heating and cooling energy demand having input the specific heat capacity indicated in the Standard 140 (i.e Wh/m 2 for P100 and 22.3 Wh/m 2 for P110) instead of following the PHPP instructions. As can be seen in the Figure, PHPP results go from underestimating thermal mass, to being just slightly higher than the reference software values. Repeating all test cases with the actual specific heat capacity, all of the Std 140 test cases fall within the confidence intervals for both heating and cooling. PHPP results for shading differences persist to some extent as presented in Figure 10. Figure 9: Difference in annual heating and sensible cooling energy demand comparing the passive solar design case with thermal mass (P100) versus without additional thermal mass (P110). PHPP V9.6 Validation using ANSI/ASHRAE Standard
 and without shading (L160) using specified heat capacity in PHPP 3. Conclusions 3.")

24 Figure 10: Differences in heating and cooling energy demand between cases with all south facing windows with overhangs (L155) and without (L50) and with all East and West facing windows with shading (L165) and without shading (L160) using specified heat capacity in PHPP 3. Conclusions 3.1 Overall test results Only testing against reference software results, the ASHRAE standard 140 suggests a confidence interval, which describes a reasonable threshold of economic uncertainty. For a total of 38 test cases described by ASHRAE 140, PHPP results were within the confidence interval of the reference software for all but one case, which modelled the impact of a south window overhang on cooling energy demand. 3.2 Space Heating In the majority of the space heating cases, PHPP results were within the range of results predicted by the reference software, and in all cases were within the threshold of economic uncertainty as defined in Informative ANNEX B22: Where reference results are very close together, such that the confidence interval maximum or minimum values could fall very close to the reference results maximum or minimum values, a value of ±5% of the base case (L100A) mean heating load is applied to the range. For the cases reported here, that value is ±4 million Btu. This value is taken as a reasonable threshold of economic uncertainty. That is, any software disagreements within ±4 million Btu of the PHPP V9.6 Validation using ANSI/ASHRAE Standard
25 reference results extremes for a given case, including difference (or delta ) cases, would result in relatively insignificant utility cost 3.3 Space Cooling The cooling loads calculated in PHPP for the Class 2 test cases were mostly within the range from the reference software, and in all cases within the threshold of economic uncertainty with the exception of the cooling energy demand calculated for the case with south-facing windows and overhangs. The modelled impact of thermal mass was to be found within the range of the suggested confidence interval, but lower in PHPP compared to the reference software. However, this difference was found to be attributed to the modelling of thermal mass in PHPP, where the PHPP procedure was followed instead of inputting the actual specific heat capacity specified in the Standard. Following the PHPP procedure for modelling thermal mass instead of calculating actual thermal mass may lead to differences in results, but still within the economic uncertainty threshold. The only area where there seem to be a slightly higher difference in results, is the modelled impact of the south overhangs, where PHPP predicts a slightly higher reduction in cooling load than the reference software. The Passive House Institute is currently developing a more detailed shading analysis for their Sketchup-based PHPP preprocessor designph, which may address this issue. PHPP V9.6 Validation using ANSI/ASHRAE Standard
26 Appendix A Modeling Notes for Class 2 ASHRAE Standard Introduction This document shall include supplemental information about the ASHRAE Standard 140 tests performed. The types of information listed below are provided in this document, each in a separate section: A. Software Information B. Alternative Modeling Methods C. Equivalent Modeling Methods D. Non-Specified Inputs E. Omitted Test Cases and Results F. Changes Made to Source Code for the Purpose of Running the Tests, where such changes are not Available in Publicly Released Versions of the Software G. Anomalous Results. 1.1 Software Information 1. Software Vendor: Passive House Institute 2. Software Name: PHPP 3. Software Version: V Operating System Requirements: Not reported 5. Approximate Hard Disk Space Required: 6 MB 6. Minimum RAM Required for Software Operation: Not reported 7. Minimum Display Monitor Requirements: Not reported 1.2 Alternative Modelling Methods NOTE 1 PHPP Ground Worksheet 1.1 Describe the Effect Being Simulated: Slabs, basements and suspended floors 1.2 Optional Settings or Modeling Capabilities: PHPP has a worksheet that allows for more detailed modelling for slabs, basements and suspended floor. This worksheet could be left blank to not included these modelling capabilities. 1.3 Setting or Capability Used: The Ground worksheet was not used. The suspended floor above a ventilated crawlspace was modelled as a floor exposed to outdoor air, as is intended to represent in Std 140. The ASHRAE method was used for modelling the basement, which precludes the use of more sophisticated modelling. PHPP V9.6 Validation using ANSI/ASHRAE Standard
27 1.3 Equivalent Modelling Methods This section shall describe equivalent modeling methods used to perform the tests. When PHPP does not model an effect exactly as stated in the Standard or does not permit the input values required, equivalent modeling is described in this section. NOTE 1 - Thermal Mass 1.1 Effect Being Simulated: Thermal mass of the building 1.2 Section(s) of the Standard where Relevant Inputs are Specified: , , Equivalent Input(s) Used: Total thermal capacity of building is 6006 BTU/F, which equals Btu/C, which equals kwh/c, and for 143 m 2, gives 22.3 Wh/m 2 of treated floor area. The PHPP user manual and software says that 60 Wh/m 2 needs to be used as a minimum. Input value of 60 Wh/m 2. For case P100, the total thermal capacity of building is BTU/F, which equals 41,212.8 Btu/C, which equals kwh/c, and for 143 m 2, gives 84.5 Wh/m 2 of treated floor area. However, the PHPP manual says to start with 60 Wh/m 2 K, and add 24 Wh/m 2 K for each massive envelope component. For P100, there would be a floor, and internal wall that are massive, resulting in a specific thermal capacity of 60+2 * 24 = 108 Wh/m 2. Given that for the other cases, the PHPP instructions were followed, the same is done for P100. Changed Specific Capacity in Verification worksheet to 108 Wh/m Use of Non Specified Inputs Air density is either assumed constant or calculated within PHPP. Default values were used in all test cases. 1.5 Omitted Test Cases and Results All Class II test cases were modelled in PHPP. Class I test cases were not modelled based on the Std 140 note that they were designed for hourly or subhourly modelling software. 1.6 Changes to Source Code No changes to the source code were done. 1.7 Anomalous Results Results and anomalies are presented in Section 2 of the report. Overall there was good agreement between the PHPP results and those of other software. Most of the individual test case results were within the range of results obtained with the other software. PHPP V9.6 Validation using ANSI/ASHRAE Standard


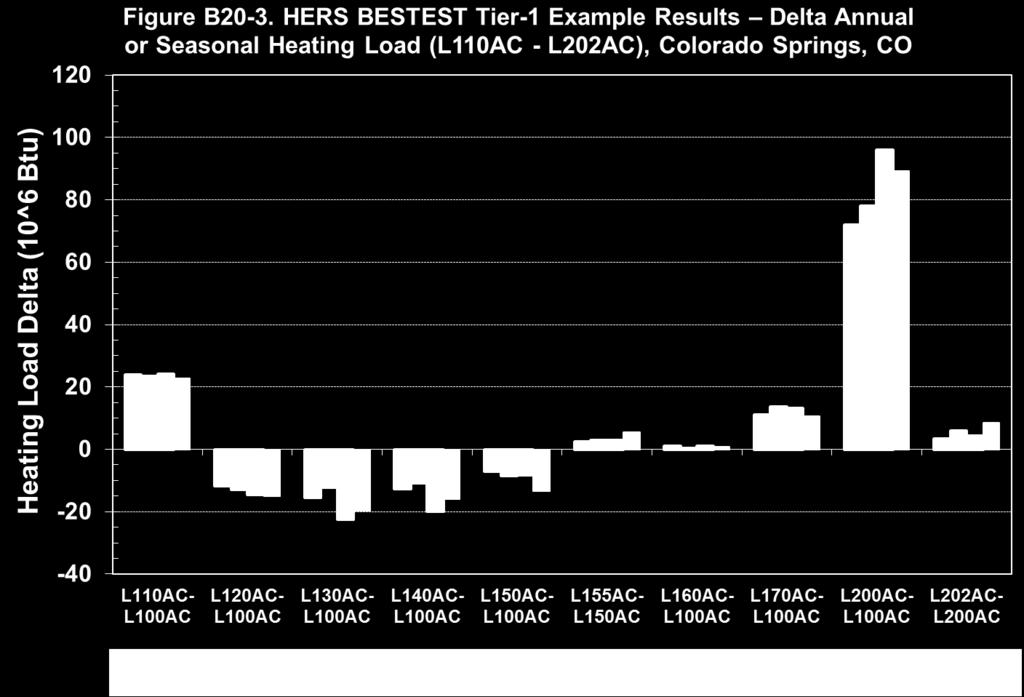
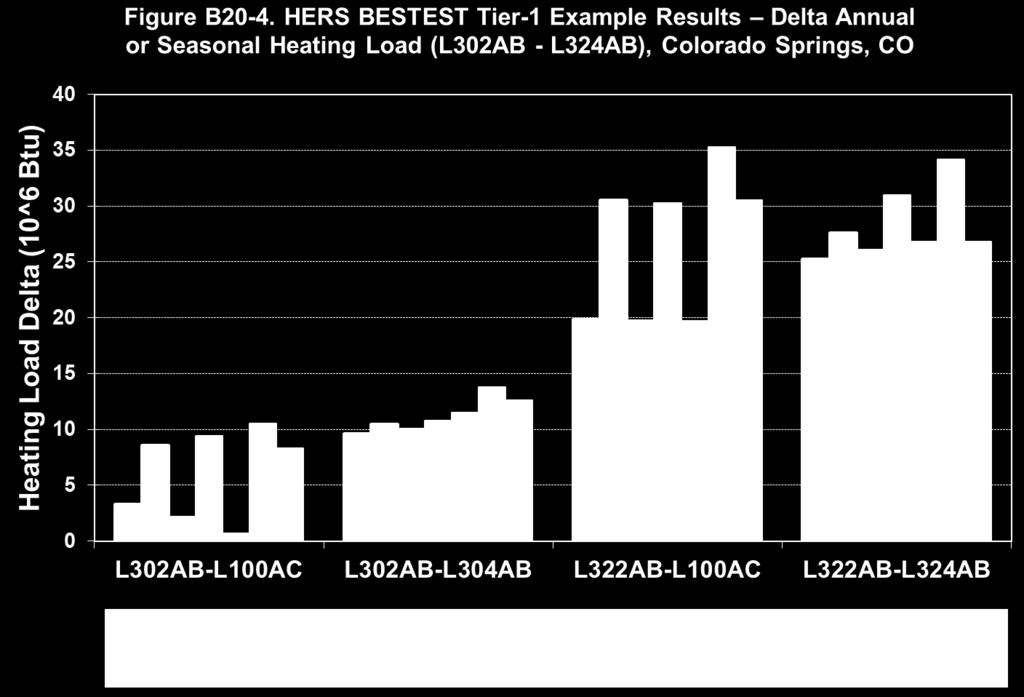
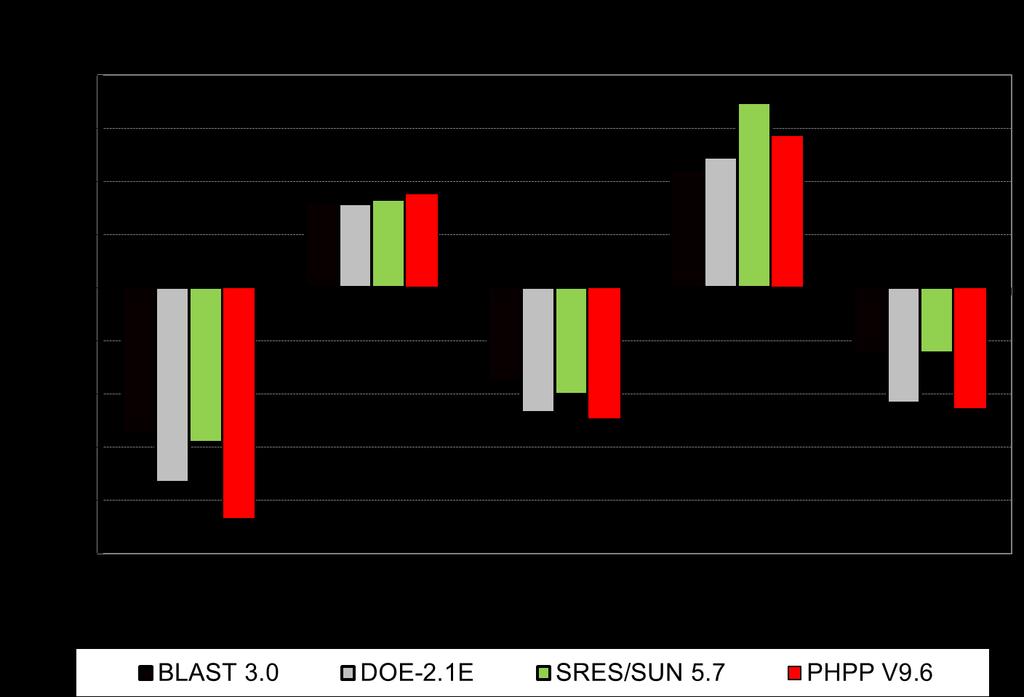
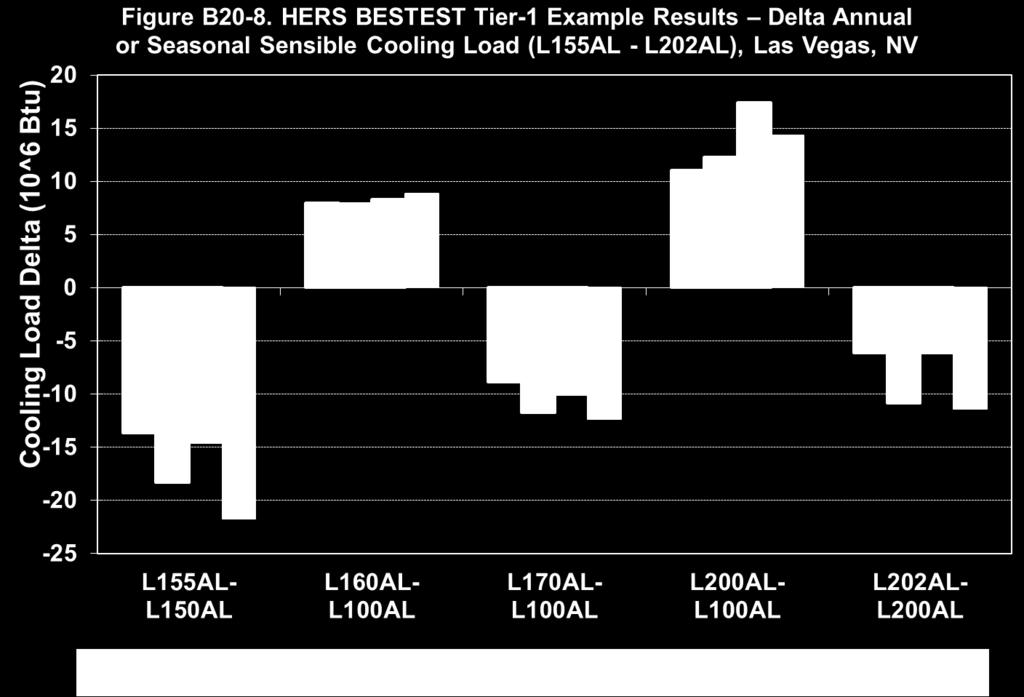
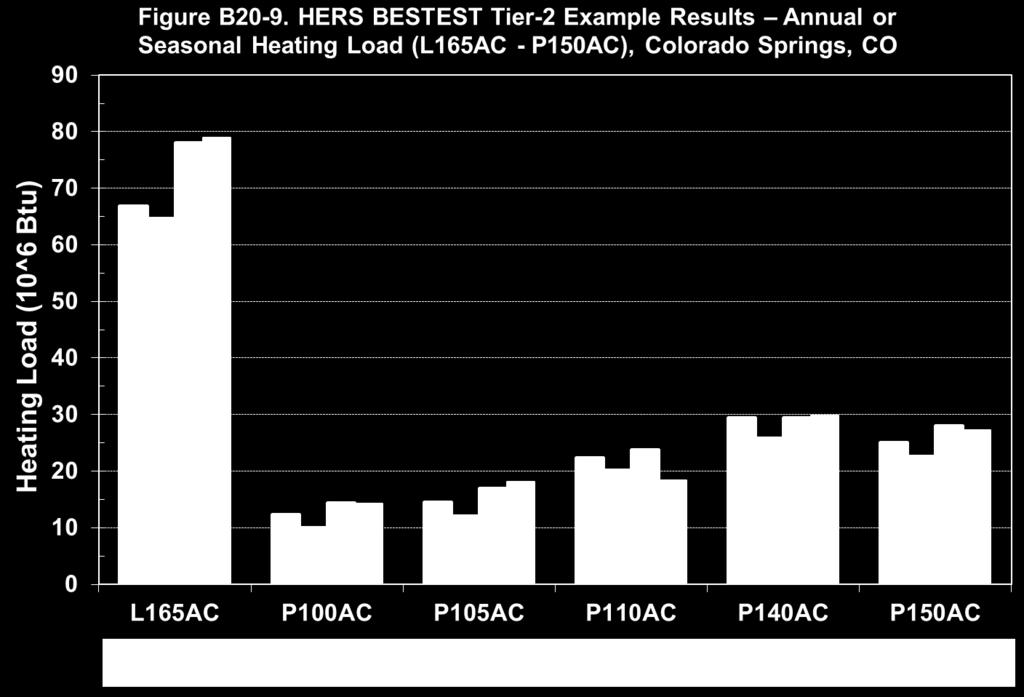
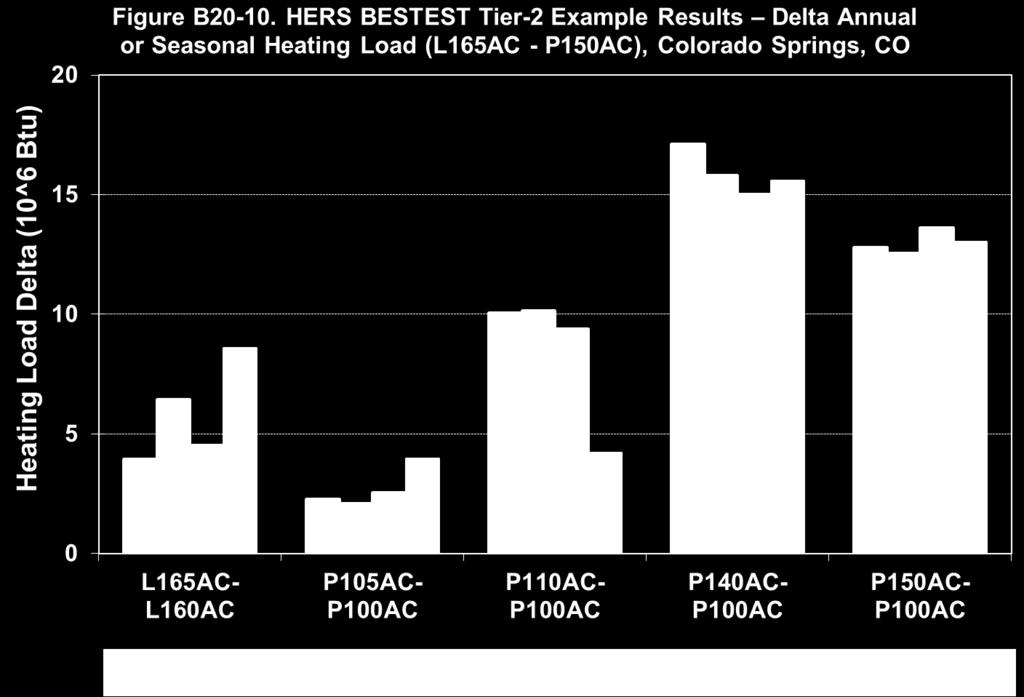
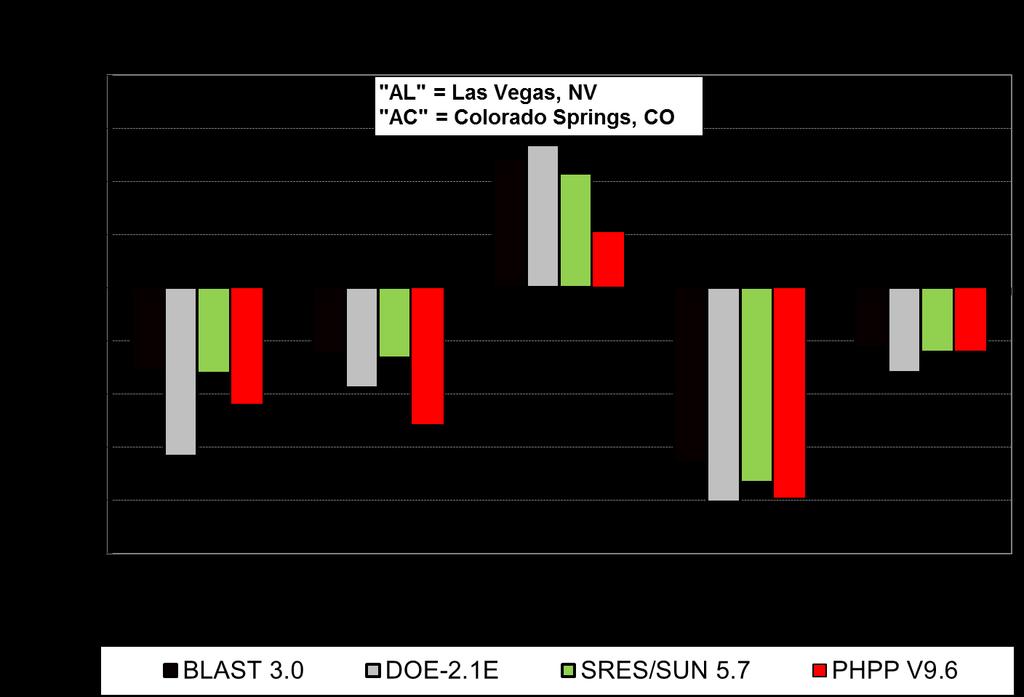
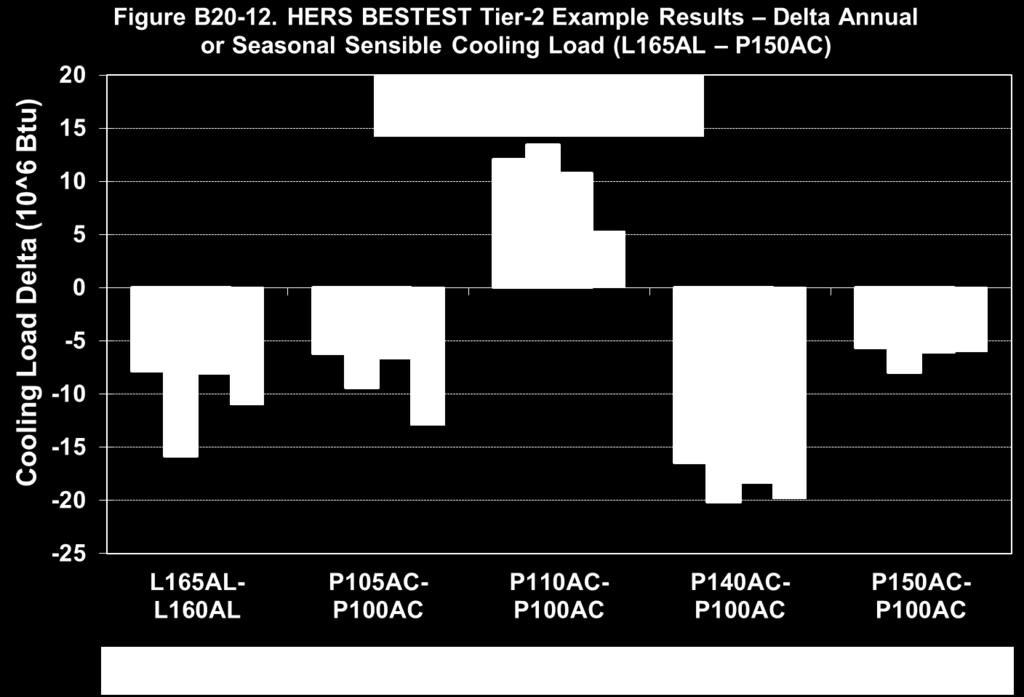
28 Appendix B CLASS 2 Results This section presents all of the figures that are in the Excel spreadsheets that come with ANSI/ASHRAE Standard PHPP V9.6 Validation using ANSI/ASHRAE Standard

29 PHPP V9.6 Validation using ANSI/ASHRAE Standard


30 PHPP V9.6 Validation using ANSI/ASHRAE Standard

31 PHPP V9.6 Validation using ANSI/ASHRAE Standard

32 PHPP V9.6 Validation using ANSI/ASHRAE Standard

33 PHPP V9.6 Validation using ANSI/ASHRAE Standard