World Energy Outlook, Energy Efficiency and Cities
|
|
|
- Christiana Gaines
- 5 years ago
- Views:
Transcription

1 World Energy Outlook, Energy Efficiency and Cities Brian Motherway Head of Energy Efficiency Division International Energy Agency International Conference on Energy Efficiency in Cities 2015


2 IEA and Energy Efficiency
3 The start of a new energy era? 2015 saw lower prices for all fossil fuels Oil & gas could face second year of falling upstream investment in 2016 Coal prices remain at rock-bottom as demand slows in China Signals turned green ahead of key Paris climate summit Pledges of 150+ countries account for 90% of energy-related emissions Renewables capacity additions at a record-high of 130 GW in 2014 Fossil-fuel subsidy reform, led by India & Indonesia, reduces the global subsidy bill below $500 billion in 2014 Multiple signs of change, but are they moving the energy system in the right direction?
4 Projected demand growth Change in energy demand in selected regions, Mtoe European Union United States Japan Latin America Middle Southeast East Asia Africa China India By 2040, India s energy demand closes in on that of the United States, even though demand per capita remains 40% below the world average
5 Policies spur innovation and tip the balance towards low-carbon Costs in 2040 for different energy sources/technologies, relative to % 40% 20% 0% -20% -40% -60% Solar PV Onshore wind Efficient lighting Efficient industrial heat production Upstream oil and gas
6 Efficiency measures on the rise, but significant potential still exists Share of global mandatory efficiency regulation of final energy consumption 40% 30% 20% 10% Industry Steam boilers Process heat Motors Buildings Heating/Cooling Lighting/Appliances Transport Cars Trucks Ships Energy efficiency policies are introduced in more countries and sectors; they continue to slow demand growth but more can be done

7 ENERGY EFFICIENCY IS OF GROWING IMPORTANCE
8 COP21 Paris Agreement 195 Nations agreed ( ) to uphold and promote regional and international cooperation in order to mobilize stronger and more ambitious climate action by all Parties and non- Party stakeholders, including civil society, the private sector, financial institutions, cities and other subnational authorities, local communities and indigenous peoples
9 Gt CO 2 -eq The IEA s Bridge Scenario Global energy-related GHG emissions Savings by measure, INDC Scenario Bridge Scenario Upstream methane reductions Fossil-fuel subsidy reform 15% 10% 49% Energy efficiency 25 Renewables investment 17% 9% Reducing inefficient coal Source: World Energy Outlook Special Report: Energy and Climate Change (2015). Five measures shown in a Bridge Scenario achieve a peak in emissions around 2020, using only proven technologies & without harming economic growth
10 IEA s Bridge Scenario by Region United States European Union Middle East Russia China India Southeast Asia Efficiency Inefficient coal plants Renewables Methane reductions Fossil-fuel subsidies Latin America Africa Source: World Energy Outlook Special Report: Energy and Climate Change (2015). The measures in the Bridge Scenario apply flexibly across regions, with energy efficiency & renewables as key measures worldwide

11 The Multiple Benefits of Energy Efficiency Energy efficiency is a means to support economic and social development at national and local level Source: Capturing the Multiple Benefits of Energy Efficiency (2014).

12 CITIES ARE UNIQUELY IMPORTANT Source: ADB
13 Population (millions) Growing urban populations 7,000 6,000 5,000 4,000 3,000 2,000 1, Urban Rural Source: United Nations, Department of Economic and Social Affairs, Population Division (2014). World Urbanization Prospects: The 2014 Revision


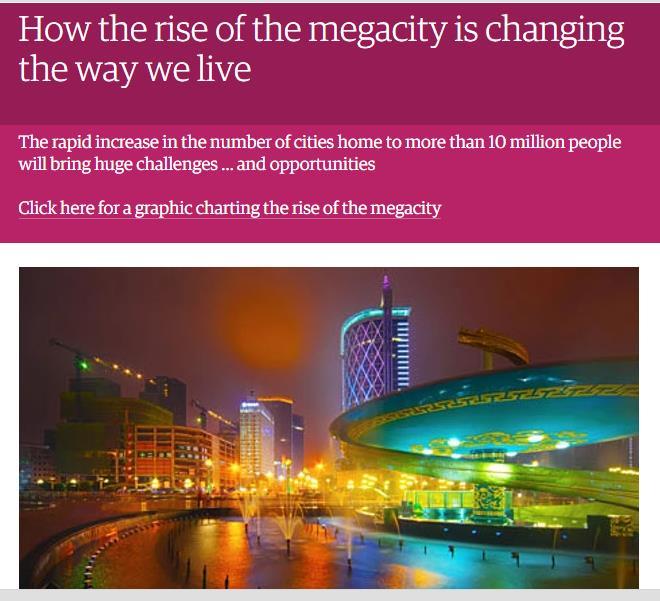

14 New challenges, new opportunities
15 Distinct energy patterns Japan Vs Tokyo Total Final Energy Consumption Services 21% Others 14% Industry 26% Services 36% Industry 9% Transport 23% Residential 15% Transport 24% Residential 32% Japan (2013) Tokyo (2012) Source: Energy Efficiency Market Report 2015
16 The national and the local Cities have influence, but are often takers of national policy and structures National policy needs to enable cities, but that is not always the same as devolving There is always room for innovative action by cities
17 City governance and action Distinct characteristics Key implementers and enforcers of national policy Policy innovators, when allowed Close to the action Capacity to act Distinct roles Land-use and transport planning Service delivery Energy management


18 Policies and actions Energy Management Enacting Enabling Energy Data Collection and Analysis Energy Management Systems for Municipalities Public Lighting Public buildings and fleets Building Energy Codes Building Retrofit Programmes District Heating Awareness Campaigns Energy Efficiency Funds and Incentives Pilot Projects Public-Private Partnerships & Energy Service Companies Public Procurement Underpinning Integrated Planning Cross-Government Engagement (vertical & horizontal)

19 Energy Efficiency in Cities - India

20 Energy Efficiency in Cities - India Government-owned Super ESCO Street Lighting Programme aims to replace 35 million inefficient light street lights 302 urban local bodies have registered No additional investment by municipalities ESCO-financed paid back through savings Results to date: 600,000 street lights replaced since January million USD cost reduction


21 Energy Efficiency in Cities - India Source: Energy Efficiency Services Limited, Vizag Street Lighting Project

22 Energy Efficiency in Tokyo, Japan
23 GJ per thousand 2005 USD PPP GJ/capita Energy Efficiency in Tokyo, Japan Source: Energy Efficiency Market Report 2015
24 Energy Efficiency in Tokyo, Japan How did Tokyo s Metropolis Prefecture become one of the most energy efficient cities in the world? Target to cut 25% of its GHG emissions by 2020 from 2000 levels, primarily using energy efficiency Key policies: Land-use Planning Cap and Trade Program for large emitters Green Building Program for new residential buildings District Plan for Energy Efficiency

25 Energy Efficiency in Los Angeles, US
26 Energy Efficiency in Los Angeles City Leadership in setting stringent municipal building policies Green Building Ordinance required new municipal buildings to be LEED silver certified in In 2008, extended to residential households Influenced California s 2010 building code first state-wide mandatory green building code in the US Shows cities can be leaders in innovation and policy

27 Cities and Energy Data Amsterdam s Energy Atlas - Buildings Source: Amsterdam Energy Atlas

28 Cities and Energy Data Amsterdam s Energy Atlas Waste Heat Source: Amsterdam Energy Atlas

29 Energy Efficiency in Mexican States and Cities Source: alef.mx
30 Energy Efficiency in Mexican States and Cities EcoCasa BRT system in Mexico City, León and others FIPATERM Programme in Mexicali State Green Mortgage National Municipal Public Lighting Programme Cool Roofs Programme And many others
31 Important lessons Alignment is key all elements working towards the same goals Integration Vertical Horizontal Using all tools available Understanding energy patterns means understanding priorities
32 Cities can innovate Can take action at smaller scale and faster pace Use procurement and purchasing power Stimulate new finance and business models The value of connections with citizens
33 Key Messages Cities are key to energy sustainability Strategies must take account of their particular energy patterns and governance models National policy should align and enable Cities can be the engine of innovation and action
34 World Energy Outlook, Energy Efficiency and Cities Brian 2015