within the Southwest Florida Water Management District
|
|
|
- Vivian Rodgers
- 5 years ago
- Views:
Transcription
1 within the Southwest Florida Water Management District quifer Characteristics Revised March 2018 Prepared by Technical Services Department Resource Regulation of the Southwest Florida Water Management District Sixth Edition Report 99 1
2 TBLE OF CONTENTS INTRODUCTION... 1 HYDROGEOLOGY... 2 FLORIDN QUIFER SYSTEM... 3 HWTHORN QUIFER SYSTEM... 3 SURFICIL QUIFER... 3 DISCUSSION OF DEFINITIONS... 3 Transmissivity... 3 Hydraulic conductivity... 4 Saturated thickness... 4 Storativity... 4 Specific yield... 4 Leakance coefficient... 5 Formation penetrated... 5 Location... 6 References... 6 Production well data... 6 quifer penetration... 6 Discharge... 6 Observation well data... 6 Radii... 7 Duration of test... 7 Comments... 7 GIS TBLES... 7 REGIONL QUIFER PERFORMNCE TEST DT TBLES... 7 RCMP TTRIBUTE TBLES... 7 TEST WELL SPECS... 8 HYDRULIC PRMETERS... 9 OBSERVTION (OB) WELL SPECS... 9 REFERENCES GIS FIGURES FIGURE 1 HYDROGEOLOGIC FRMEWORK WITHIN THE SWFWMD 12 FIGURE 2 GIS MP OF SURFICIL QUIFER PT LOCTIONS..13 FIGURE 3 GIS MP OF HWTHORN QUIFER PT LOCTIONS 14 FIGURE 4 GIS MP OF UPPER FLORIDN QUIFER PT LOCTIONS 15 FIGURE 5 GIS MP OF LOWER FLORIDN QUIFER PT LOCTIONS...16
3 INTRODUCTION This report represents the sixth update to the original 1987 report entitled quifer Characteristics Within the Southwest Florida Water Management District 1. Results of new aquifer performance tests (PT) have been added to the previous update (SWFWMD, March ,3,4,5 ); however, the general presentation of the data remains unchanged. This report is a compilation of selected aquifer pumping tests within the Southwest Florida Water Management District (SWFWMD) and is intended as a reference guide for aquifer tests within the SWFWMD area. Individual aquifer characteristics, as well as general information and comments concerning each aquifer test for the Floridan, Hawthorn, and surficial aquifer systems, are included. This report is presented in electronic format to add new data or information on a periodic basis without having to republish the entire document. s information becomes available, the new aquifer information will be appended to the end of the corresponding aquifer information tables within the Floridan, Hawthorn and surficial aquifer sections. The updates to be provided to users will include the necessary shapefiles and attribute tables to substitute and add to this electronic document. Due to the numerous sources of data, the variety of analytical methods used, and the wide range of field conditions encountered, users are cautioned to review the individual test analyses before applying these values to their own work. ny questions regarding the information presented in this report should be directed to the author at the Water Resources Bureau of the Southwest Florida Water Management District, (352) , ext If errors are identified in the shapefiles or the aquifer information tables, please notify the Water Resources Bureau so that the respective attributes or table can be corrected. Users of the data provided in this report for modeling analyses should use caution when developing a conceptual model and grid design for a hydrogeologic framework, and specifying the model parameters. quifer parameters obtained from aquifer performance tests are highly variable and extremely dependent on site-specific conditions, so it may not be appropriate to extrapolate the data over large areas. ll relevant aquifer performance test data within the vicinity of a model site must be considered when selecting the appropriate parameters for the model. 1 Resource Management Department, SWFWMD, quifer Characteristics within the Southwest Florida Water Management District. 2 Technical Services Department, SWFWMD, quifer Characteristics within the Southwest Florida Water Management District. 3 Regulation Performance Management Department, SWFWMD, quifer Characteristics within the Southwest Florida Water Management District. 4 Regulation Performance Management Department, SWFWMD, quifer Characteristics within the Southwest Florida Water Management District. 5 Regulation Performance Management Department, SWFWMD, 2009 quifer Characteristics within the Southwest Florida Water Management District. 1
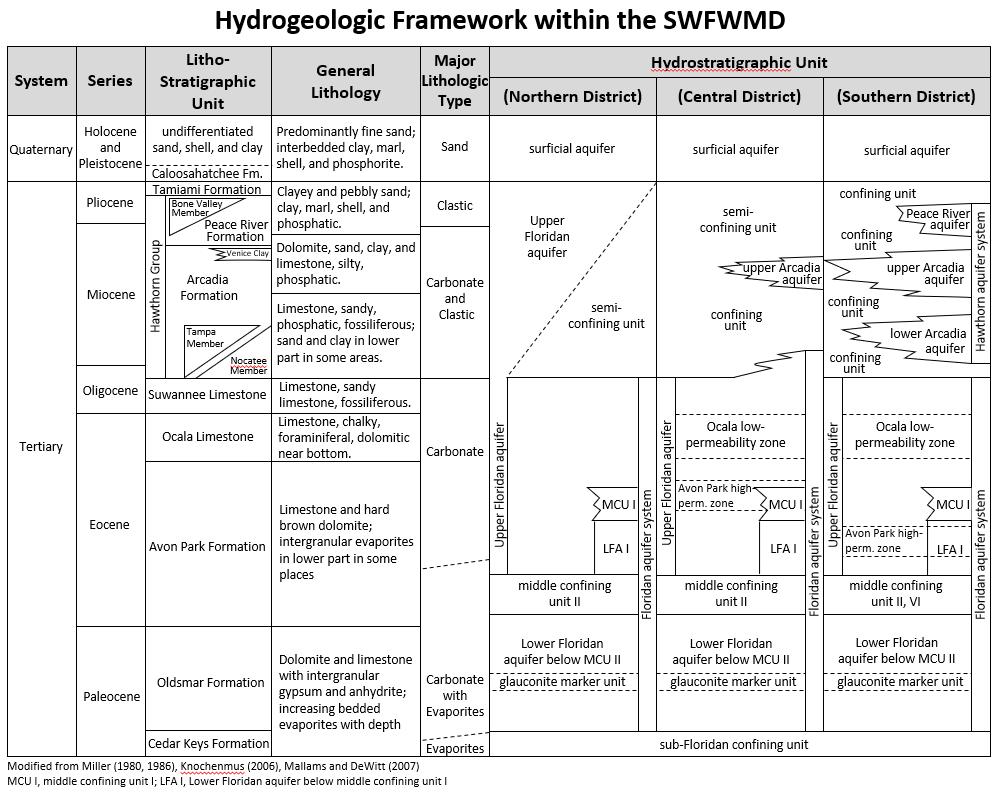
4 Special consideration must be given when choosing parameters for specific hydrostratigraphic production zones. Note the hydrostratigraphic intervals in which the aquifer performance test(s) were conducted and attempt to match the parameters with the production intervals. Keep in mind that the analytical procedures used to generate parameters for the various aquifers and confining layers have specific assumptions that should be considered when making use of the data for modeling purposes. Likewise, MODFLOW and other finite difference groundwater flow models that use aquifer performance test data will have simplifying assumptions as well. ll relevant assumptions for these analyses need to be addressed when making use of the data published in this report. When using the data provided in this report, the user must also be sure to perform the appropriate conversions to the data for use in the selected model. For example, MODFLOW, used in qusi-3d simulation, requires that parameters for transmissivity and leakance be expressed in square feet per day (ft 2 /day) and cubic feet per day per cubic foot (ft 3 /day/ft 3 ) units while the Jacob-Hantush model requires that parameters be in the gallons per day per foot of aquifer (gpd/ft) and gallons per day per cubic foot (gpd/ft 3 ) units, respectively. The hydraulic terms of specific yield and storativity are dimensionless and require no conversion. Conversely, parameter conversion for MODFLOW simulations of full 3D conceptualization are in feet/day units. HYDROGEOLOGY general description of the hydrogeology of the District is provided to assist the reader in correlating aquifer performance tests to the regional hydrostratigraphic units of the Floridan aquifer system, Hawthorn aquifer system, and surficial aquifer. For site specific information, the reader is urged to refer to the specific reference for each aquifer performance test contained in the References / Comments columns of the quifer Characteristics tables. The Southeastern Geological Survey provides a generalized guide to the relationship of regional hydrogeologic units to major stratigraphic units in southern Florida 6. This chart has been modified from the chart contained in the referenced report to show the hydrogeologic and stratigraphic relationships of southern, central and northern portion of the SWFWMD (use highlighted link to refer to Figure 1). 6 Southeastern Geological Society d Hoc Committee on Florida Hydrostratigraphic Unit Definition, 1986, Florida Hydrogeologic Units; Florida Geological Survey Special Publication No
5 FLORIDN QUIFER SYSTEM The Floridan aquifer system consists primarily of vertically continuous sequences of carbonate rocks of generally high permeability, and is separated into two principal hydrostratigraphic units consisting of the fresh potable water of the Upper Floridan aquifer and the highly mineralized water of the Lower Floridan aquifer. Some areas in the Lower Floridan aquifer, in the extreme northeast and eastern portion of the District, have potable zones found immediately below middle confining unit I (MCU I) and/or middle confining unit II (MCU II) of Miller (1986). These potable zones are principally found in high recharge areas where little or no evaporates exist in MCU I and MCU II or the upper portions of the Lower Floridan quifer. The Upper Floridan aquifer is the principal source of water in the SWFWMD and is used for major industrial, mining, public supply, domestic use, irrigation, and brackish water desalination in coastal communities. HWTHORN QUIFER SYSTEM In southern Manatee County, Sarasota County, western DeSoto County and the central and western portions of Charlotte County, the Hawthorn aquifer system is made up of the Peace River aquifer, upper rcadia, and lower rcadia aquifers. These aquifers are separated by varying thicknesses of low permeability confining units. In other areas where the Hawthorn aquifer system exists, one or more of the aquifers may pinch out or combine with other aquifers. The approximate northern boundary of the Hawthorn aquifer system runs unevenly across Polk, Hillsborough and Pinellas counties. The Hawthorn aquifer system is used primarily for public supply, domestic use and irrigation. SURFICIL QUIFER The surficial aquifer consists primarily of undifferentiated sands, shell material, silts and clayey sands of varying thickness and is found throughout the SWFWMD in areas where the Hawthorn Group and underlying carbonate units are not exposed at land surface, where adequate basal confinement of the surficial deposits exist, and where concentrated ground-water withdrawals have not dewatered the aquifer. The principal uses for the surficial aquifer are irrigation, limited domestic use, and dewatering projects for mining and infrastructure installation. DISCUSSION OF DEFINITIONS Transmissivity (T) is defined as the rate at which water is transmitted through a unit width of aquifer under a unit hydraulic gradient. Transmissivity is the product of the aquifer hydraulic conductivity (K) and the saturated aquifer thickness (b), such that T = K * b 3
6 Transmissivity has dimensions of length squared divided by time (L 2 /T). Transmissivity units expressed as feet squared per day (ft 2 /day) are multiplied by 7.48 gal/ft 3 to obtain units of gpd/ft. Transmissivity values of the Floridan aquifer range from 8 ft 2 /day as measured from a packer test conducted on fine grain sediments of the Ocala limestone in northern Sarasota County to 9,400,000 ft 2 /day in thick and highly cavernous dolostone units at the northern boundary of Hardee County. In the Hawthorn aquifer system, transmissivity values range from 3 ft 2 /day in Highlands County to 17,900 ft 2 /day in Sarasota County. The surficial aquifer values for transmissivity range from 8 ft 2 /day in southern Polk County to 30,100 ft 2 /day. Hydraulic conductivity (K) measures the linear permeability of an aquifer. It is determined by dividing the transmissivity value by the saturated thickness of the aquifer. Hydraulic conductivity has dimensions of length divided by time (L/T). It is expressed in feet per day (ft/day). Reported hydraulic conductivity values in the surficial aquifer system range from 0.3 ft/day to 1,370 ft/day. The unit of feet per day (ft/day) may be converted to gallon per day per square foot (gpd/ft 2 ) by multiplying by the conversion factor of 7.48 gal/ft 3. Saturated thickness (b) in unconfined aquifers is the height of the water table above the top of the underlying confining unit. In confined aquifers the saturated thickness is simply the thickness of the aquifer between confining units. The thickness is expressed in feet. Storativity (S) or storage coefficient is a dimensionless term, and is expressed as a decimal fraction. It is defined as the total volume of water that an aquifer releases from or takes into storage per unit horizontal surface area of the aquifer per unit change in the component of head normal to that surface. It is generally calculated as the sum of the specific yield (SY) and the product of specific storage (Ss) to the saturated thickness (b) of the aquifer, such that S = SY + Ssxb Specific storage (Ss) is the volume of water (L 3 ) a unit volume of saturated aquifer releases from storage for a unit decline in hydraulic head by expansion of water or compression of rock/soil matrix. It has the dimensions of (L -1 ). Specific yield (SY) is defined as the volume of water that an aquifer releases from storage per unit surface area of the aquifer per unit decrease in the water table under the effect of gravity drainage. Specific yield is also a dimensionless value (L 3 /L 3 ), and it is expressed as a decimal fraction. Specific yield of confined aquifers is generally negligible (SY = 0) since the aquifer remains saturated during pumping. Therefore, the estimated values of confined aquifers (Floridan and Hawthorn aquifer systems) storativity reported here are expressed in terms of the dimensionless product of the aquifer specific storage (Ss) multiplied by its saturated thickness (b), such that S(confined aquifer) = Ss x b 4
7 Storativity values for the Floridan and Hawthorn aquifer systems within the SWFWMD area range from 3 x 10⁻⁹ to 4 x 10⁻¹, and 3 x 10⁻⁶ to 2.8 x 10⁻², respectively. The wide range of storativity values from tests of the Floridan and Hawthorn aquifer systems is primarily due to the variations in lithology or aquifer matrix. By contrast, in unconfined aquifers as the specific storage becomes negligible, the specific yield is much more significant during pumping as the aquifer is gradually dewatered under gravity drainage when the water table is lowered. Thereupon, the storativity is equal only to the specific yield, such that S(unconfined aquifer) = SY Reported specific yield values of the Surficial aquifer system within the SWFWMD area range from 5 x 10⁻⁵ to 3 x Leakance coefficient (L) is defined as the volume of water that flows through a unit area of a semi-confining layer separating two aquifers per unit of head difference per unit of time. In this report, the leakance coefficient is expressed in per day (dy -1 ). Leakance coefficient units expressed in per day are multiplied by 7.48 gal/ft 3 to obtain units of gpd/ft 3. Leakance is determined by the analysis of constant-rate pump test data of an observation well. Reported leakance values for the Floridan and Hawthorn aquifer systems within the SWFWMD range from 3.7 x 10⁻⁶ dy -1 to 31.2 dy -1, and from 2 x 10⁻⁷ dy -1 to 0.12 dy -1, respectively. Many of the test sites do not give a value for leakance because a substantially longer period of pumping is needed to show deviation from the theoretical log-log plot, time-drawdown curve, or the Theis curve. Leakance values provided in this report for areas where the confining unit is relatively thin and leaky may be underestimated due to the inability to achieve steady-state conditions during the aquifer performance test analyses. The user of this data is cautioned to thoroughly evaluate the data and methods of analysis to be certain that reported leakance values are appropriate. Formation penetrated refers to the geologic formations to which the pumping well is open. Each aquifer system is a collection of stratigraphic and hydrogeologically related units or formations. The abbreviations of the formation names associated with the surficial aquifer, Hawthorn aquifer system and Floridan aquifer system are explained as follows: 5
. References are composed of a condensed bibliography of source documents for each test.")
8 Location refers to the location of the pumped well. In cases where multiple wells were pumped, the location was plotted as the center of pumpage. Each test site will be located based on the township-range-section system (T-R-S). References are composed of a condensed bibliography of source documents for each test. Many of these reports are located either in the library or the Water Use Permit (WUP) files at the SWFWMD headquarters and service offices. Production well data refers to the well construction details of the production well used in the pumping test. The upper set of values refers to the depth of the longest string of casing and the diameter of that casing. Depth of the casing is indicated on the upper left and the diameter is indicated on the upper right side of the data set. The lower value refers to the total depth of the well at the time of the pumping test. dash ( - ) indicates that the data is unknown. quifer penetration is the thickness of the aquifer (in feet) that the production well penetrates, to the nearest ten-foot interval. The value includes the extent of the casing and the amount of open borehole or screen in the well. There is also a second quifer penetration designation (QU PEN 2 ) for the Upper Floridan aquifer tests to differentiate between partial penetration and full penetration. Partially penetrating wells of the Upper Floridan aquifer are typically open to only the Tampa / Suwannee / Ocala limestones, while fully penetrating wells have open hole intervals extending into the von Park Formation. Discharge (Q) refers to the discharge of the production well during the test and is expressed in gallons per minute (gpm). Observation well data includes the well construction data for all observation (OB) wells that were used for calculation of the aquifer characteristics where applicable. The format used for this data set is the same as 6
9 the production well data set. When available, the total number and specifications of observation wells are indicated. Radii is the distance (in feet) from the production well to each of the observation wells that were used for the calculation of the aquifer characteristics. Duration of test is the length (in hours) of each aquifer pumping test. Comments noted include, but are not limited to, partial penetration of any well, regional trends from outside pumpage which may have influenced the test, barometric and tidal fluctuations that were or were not accounted for, whether the upper and lower zones were monitored, any calculation corrections made, and the analytical methods used. TBLES ND FIGURES REGIONL QUIFER PERFORMNCE TEST GIS DT TTRIBUTE TBLES ND FIGURES The data contained in these files were compiled from publications from both private and public agencies. ll values were verified wherever possible from the original source document. ny missing values (indicated as 'na') represent parameters that were not available in the original publication. ny values previously reported in older editions of the PT report that could not be verified in the source document are noted in the comments section. rcmap Figures 2-5 present the locations of PTs conducted throughout the District within the surficial, Hawthorn, Upper Floridan and Lower Floridan aquifer systems as of this publication (Link to View Figures). The rcmap shape files and metadata for these coverages are provided here and will be updated on routine basis to incorporate new PT data at: RCMP TTRIBUTE TBLES Column Headers Description NME designation of the test or pumped well; usually indicates location; e.g., city, county, property name, wellfield etc. 7
10 TEST RTING indicates reliability of the test; G = good, = acceptable, P = poor; rating determined by the review of appropriate documentation supporting listed values of T, S and L. PTs are rated good if supporting documentation was found showing that the test was performed for a sufficient time, that the underlying assumptions for the test were met, that the appropriate regional trend corrections were made to the raw data in deriving the parameters, and that sufficient well construction and PT operation specifications were provided. Parameters are compared with aquifer information obtained from tests conducted in the same area of the District in addition to model-derived values and other information to determine if the reported values are in an acceptable range. PT results lacking documentation of well construction specifications, PT operation, or data correction methods were categorized as acceptable or poor. Sites classified as poor were found to have limited documentation supporting the operation and results of the PT. Note: It is important to recognize that the evaluation of an PT rating from the review of available information is subjective in nature. The user is cautioned to perform their own evaluation of sites specific documentation in determining the appropriate uses of test values. LT_DDG latitude coordinate in decimal degrees LONG_DDG longitude coordinate in decimal degrees LT_UTM Universal Transverse Mercator coordinates corresponding to latitude (Northing) LONG_UTM Universal Transverse Mercator coordinates corresponding to longitude (Easting) T-R-S T = Township North; R = Range East; S = Section TEST WELL SPECS DIM Effective diameter of test well; in instances where diameter changes along depth of cased well extending to land surface, smaller (limiting) value is reported; units = inches CSG Depth to which well is cased; units = feet 8
11 TD Total open depth of well; units = feet Q PEN quifer penetration (open interval between bottom of casing and total depth of well); units = feet Q Discharge rate at which test well was pumped; "stepped" indicates varied pumping rate where step-drawdown method was used; units = gallons per minute (gpm) HYDRULIC PRMETERS (IN UF & IS) T Transmissivity of aquifer tested; value represents logarithmic average where results from multiple analyses were reported; units = square feet per day (ft 2 /day) S Storativity (or storage coefficient); value represents logarithmic average where results from multiple analyses were reported; units = none (dimensionless) L Vertical leakance; value represents logarithmic average where results from multiple analyses were reported; units = per day (d -1 ) SY (in SS only) Specific yield; value represents volume of water that an unconfined aquifer releases from storage per unit surface area of aquifer per unit decline in water table; units = none (dimensionless) K Horizontal conductivity; represents the ability of the media to transmit water horizontally; units = feet per day (ft/dy) Q THICK quifer thickness (the term b in T = K * b); saturated thickness of water table; units = feet OBSERVTION (OB) WELL SPECS # OB WELLS Number of observation wells monitored or used for analysis 9
12 DIM Same description as for test well; units = inches CSG Same description as for test well; units = feet TD Same description as for test well; units = feet RD Radial distance from test well; units = feet FMN PEN Formation penetrated by test well (see previous definition for abbreviations) QU PEN 2 quifer penetration (Full F, vs. Partial - P) TEST DUR Test duration; units = hours SOURCE DOC VERIFIED REFERENCES Indicates if original source publication was available for review Citation of source document(s) COMMENTS Notes concerning details about that particular well; content varies between tests 10
13 REFERENCES Bear, J., Beljin, M.S. and Ross, R.R., Fundamentals of Ground-Water Modeling; USEP Ground Water Issue Reilly, T.E. and Harbaugh,.W, Guidelines for Evaluating Ground-Water Flow Models; USGS Scientific Investigations Report Southeastern Geological Society d Hoc Committee on Florida Hydrostratigraphic Unit Definition, 1986, Florida Hydrogeologic Units; Florida Geological Survey Special Publication No. 28. SWFWMD, 2006, quifer Characteristics within the Southwest Florida Water Management District, Regulation Performance Management Department. SWFWMD, quifer Characteristics within the Southwest Florida Water Management District, Resource Management Department. SWFWMD, 2009, quifer Characteristics within the Southwest Florida Water Management District, rcmap Shape Files, Tampa Regulation Department. Technical Services Department, SWFWMD, quifer Characteristics within the Southwest Florida Water Management District. 11
14
15 >> PG 9 SURFICIL QUIFER TEST SITES SRWMD SJRWMD 75 SWFWMD SFWMD 275 Figure 2 75 Well Locations County Boundary WMD Boundaries Water Resources Dept. March 15, Miles µ
16 HWTHORN QUIFER SYSTEM TEST SITES >> PG 9 SRWMD SJRWMD 75 SWFWMD Figure 3 SFWMD Well Locations County Boundary WMD Boundaries Water Resources Dept. March 15, Miles µ
17 PG 9 UPPER FLORIDN QUIFER TEST SITES SRWMD SJRWMD 75 SWFWMD SFWMD Figure 4 Well Locations County Boundary WMD Boundaries Water Resources Dept. March 15, Miles µ >>

18 PG 9 LOWER FLORIDN QUIFER TEST SITES SRWMD SJRWMD 75 SWFWMD SFWMD Figure 5 Well Locations County Boundary WMD Boundaries Water Resources Dept. March 15, Miles µ