Water Availability and Use Science Program. WestFAST September 24, 2015
|
|
|
- Holly Cole
- 5 years ago
- Views:
Transcription


1 Water Availability and Use Science Program WestFAST September 24, 2015

2 WAUSP Objective To place technical information and tools in the hands of stakeholders, allowing them to answer questions they face about water availability: Does the Nation have enough freshwater to meet both human and ecological needs? Will this water be present to meet future needs? SECURE Water Act Public Law , 9507 and 9508

3 Water Availability Analysis The process of determining the quantity and timing-characteristics of water, which is of sufficient quality, to meet both human and ecological needs. Types of Information Technical Socio-economic Legal Regulatory Political

4 Our Approach Water Budgets provide a unifying theme to achieve our goals Precipitation + Flow in = Evapotranspiration + Storage Change + Flow out


5 A Nationwide system to deliver water accounting information Precipitation Runoff Baseflow ET Recharge Surface Storage

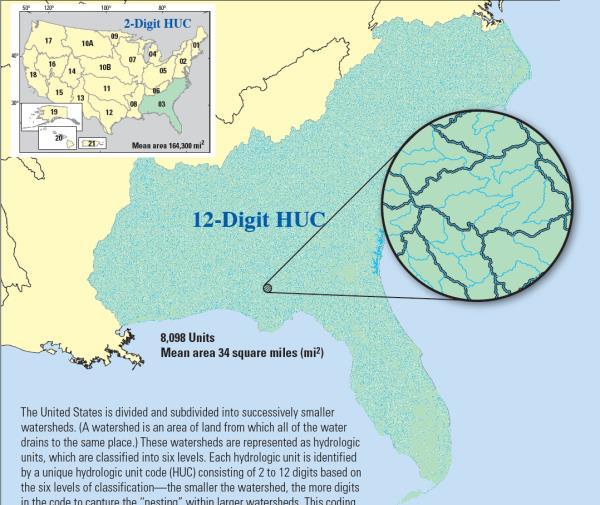
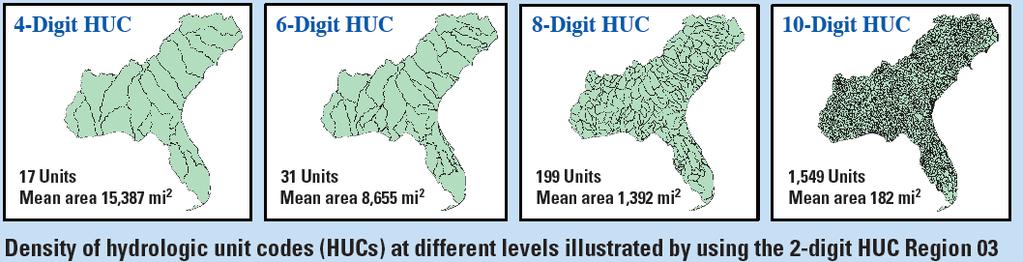
6 Scale Matters


7 WAUSP Components Expected funding for FY16 is approximately $40M National Water Census (WaterSMART) Topical Studies Focus Area Studies State Water Use Grants Research and Development Cooperative Matching Funds

8 National Water Census Topical Studies Estimation of Flow in Ungaged Basins Groundwater Availability Estimation of Evapotranspiration Ecological Water Science Water Use
9 National Water Census Existing FAS ACF Focus Area Studies Colorado Delaware New FAS (2016) Red River Upper Rio Grande Coastal Carolinas

10 Information Delivery Water Budgets Streamflow statistics Aquatic biology Data and reports


11 Surface Water Models Estimating Flows in Ungaged Basins Models provide us a means of estimating streamflow for time periods where we don t have record or places where we don t have monitoring capabilities.

12 Assess Groundwater s role in Water Use the strength of and enhance the resources within this program to provide information on: Recharge GW yields Changes in storage. Trends in GW Indices GW/SW Interactions Availability


13 Evapotranspiration Water Use Effort: For irrigation water use to estimate consumptive use. Small Watershed Scale Water Budget Effort: Total ET as a component of the water budget.


14 Flows Needs for Wildlife and Habitat Classify streams - hydro-ecological type Tools to systematically assess ecological affects of hydrologic alteration Develop flow alteration ecological response relationships by h-e type


15 Water Withdrawals by Category, 2010 Livestock Self-Supplied Domestic Public Supply Thermoelectric Power 1 percent 1 percent 12 percent 45 percent 1 percent 3 percent 4 percent 33 percent Mining Aquaculture Self-Supplied Industrial Irrigation

16 Withdrawals, in billion gallons per day Population, in millions Population and Total Withdrawals Total Withdrawals Population


17 Water Use Topical Studies Public Supply Inventory and Use Irrigation Consumptive Use Thermoelectric Unconventional Oil and Gas
 consumptive use and losses EPA Safe Drinking Water Information (SDWIS) Multi-year project About 56,000 systems About 8,000 intakes About 128,000")
18 Public Supply Inventory and Use Enhance the nation s publicsupply water information Track human water as it moves through systems to use Withdrawals and deliveries (annual/monthly) consumptive use and losses EPA Safe Drinking Water Information (SDWIS) Multi-year project About 56,000 systems About 8,000 intakes About 128,000 wells
 Watershed and county scale Monthly ET from Landsat (30 m) Focus Area Study, field")
19 Irrigation Consumptive Use Satellite Data and ET Annual and monthly ET from MODIS (1 km) Watershed and county scale Monthly ET from Landsat (30 m) Focus Area Study, field scale
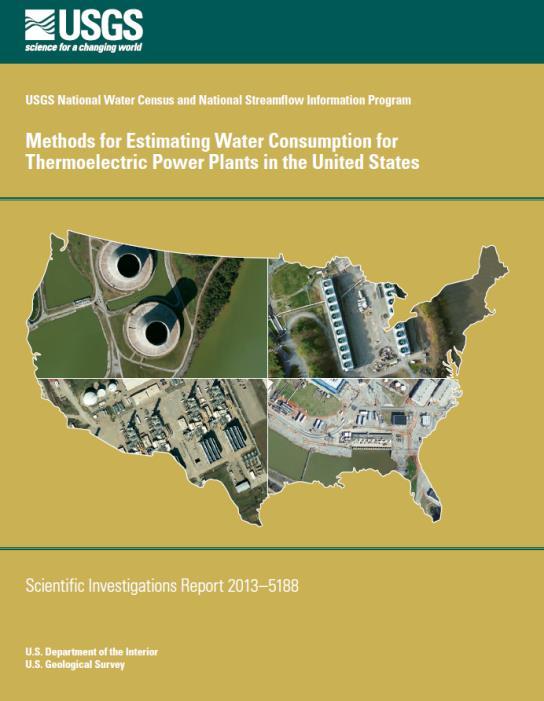
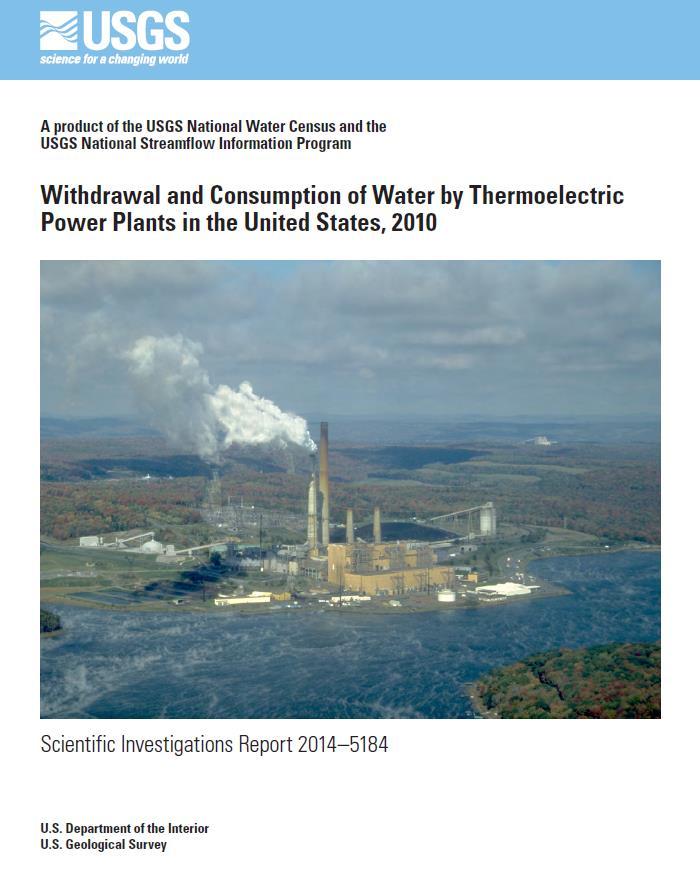
20 Thermoelectric

21 Unconventional Oil and Gas Water Use
 Red River Upper Rio Grande Coastal")
22 Focus Area Studies Existing FAS ACF Colorado Delaware New FAS (2016) Red River Upper Rio Grande Coastal Carolinas
 The Chattahoochee River is the primary source of water supply for the Atlanta Metro Area (~6M population and growing) Extensive use of groundwater and surface water for agricultural irrigation is")
23 Apalachicola, Chattahoochee, Flint River Basin Long term conflict over water continues in the ACF Basin among Alabama, Florida, and Georgia (Supreme Court case: FL vs. GA) The Chattahoochee River is the primary source of water supply for the Atlanta Metro Area (~6M population and growing) Extensive use of groundwater and surface water for agricultural irrigation is increasing and produces lower than normal streamflows in much of the Flint River Basin Apalachicola Bay s oyster population has seen declines that coincide with the development of water resources upstream in the ACF Basin
 Snowpack dynamics; runoff forecasting Importance of Groundwater (contribution to")
24 Colorado River Basin Increasing demand Drought conditions Water Use (incl. ET) Snowpack dynamics; runoff forecasting Importance of Groundwater (contribution to streamflow)


25 Delaware River Basin 12,000 square mile four-state basin provides water to >15 million people. Export from northern reservoirs provide half of New York City supply. Supreme Court and River Basin Commission mandated flows. Mandated reductions in ground- water withdrawals in Philadelphia Region due to declining water levels. Flow needs for endangered and other riverine species are not well understood. How will changes in land-use and climate impact all of the above?

26 Coastal Carolinas Ongoing/projected population increases in this land limited coastal region = higher population density and shaper interface between fresh and saltwater ecosystems. Frequent Droughts/Hurricanes Groundwater Capacity-use Area Sea-level rise, land-use change and climate change will impact aquifer water levels and frequency, duration and magnitude of streamflow and salinity intrusion near watersupply intakes.
 Disruption of aquatic ecosystems Drought in Texas Water quality Salinity")
27 Red River (of the South): Increasing water demands (municipal, Ag.) Disruption of aquatic ecosystems Drought in Texas Water quality Salinity Natural chloride


28 Upper Rio Grande Recent changes in climate, water demand, and water management are placing increased pressure on the Upper Rio Grande Basin s limited water resources
29 Water Use Data and Research (WUDR) (aka State Water Use Grants) The SECURE Water Act authorized a program that will provide financial resources, through cooperative agreements with State water resource agencies. Funding should be used to improve the availability, quality, compatibility and delivery of water use data that is collected and/or estimated by States. Data must be integrated with appropriate datasets that are developed and/or maintained by the USGS.
30 WUDR, cont. $12.5 million over 5 years $1.352 million for FY 2015 Each State $26,000 to write workplan $1.5 million for 2016 and beyond (pending) Competitive process $250,000 State limit Grant Program Guidelines provided
31 WUDR, cont. Interstate Council on Water Policy hosting 3 stakeholder meetings Salt Lake City Utah September 17, 2015 Tuscaloosa, Alabama October 15th, 2015 Chicago, Illinois October 27th, 2015 Encourages cooperation and collaboration between State agency and USGS to improve and build better water-use databases. Tiered criteria for major categories in guidelines. Ultimate goals for site-specific, watershed (HUC 8) and aquifer-based data, including improved consumptive use.
32