Ozone Based In-Situ Remediation of a PCB and Total Petroleum Hydrocarbon Release. John M. Mateo The Resource Renewal Companies, Moorestown, NJ
|
|
|
- Madlyn Higgins
- 5 years ago
- Views:
Transcription

1 Ozone Based In-Situ Remediation of a PCB and Total Petroleum Hydrocarbon Release John M. Mateo The Resource Renewal Companies, Moorestown, NJ
 Multiple ASTs,")

2 Historic Site Layout Former Heating Oil Distribution Facility (1940) Multiple ASTs, USTs, and Piping Repurposed Use as Hazardous Waste Storage Releases via spills, leaks, poor housekeeping 2


3 3 COC Distribution

: 9800 mg/kg Highest VOC (TCE) in GW")

4 Summary of RI Findings Hydrocarbon impacted soil 5-14 bgs Highest PCBs in soil Shallow (1.5-2 bgs): 4020 mg/kg. Deep ( bgs): 9800 mg/kg Highest VOC (TCE) in GW 550 ug/l (28 30 bgs). Most values at or below 10 ug/l. PCBs absent in groundwater. Profile View 4

5 Summary of RI Findings (Cont d) Relative Incidence of PCB Aroclors in RI Samples Collected Aroclor % % % % ND 1% << Highest Incidence 5
6 Remedial Alternative Evaluation No Action Excavation and Off-site Disposal In-situ Dual Phase Extraction In-Situ Chemical Oxidation Fenton s Ozone Persulfate Permanganate Literature Review Pilot Test ROI Bench Study #1 Bench Study #2 6
7 ISCO with Ozone Robust body of real world case histories for effectiveness of Ozone on site COCs (except PCBs) Ozone effective on PCBs in microcosm Conducted site specific Bench and Pilot Scale Testing Site conditions ideal 7
; approach is dependent on delivery efficiency Fenton s was not efficient ROI range from 10.")
8 Bench & Pilot Results Persulfate showed varied reductions (approximately 50% - 85%); approach is dependent on conditions / mixing / contact efficiency Ozone showed most effective reduction (>90%); approach is dependent on delivery efficiency Fenton s was not efficient ROI range from 10.5 to 30+ feet 8
9 Geomorphology of plume in the matrix ROI, permeability, DTW Benefits ISCO with Ozone (O 3 ) No disposal No dioxin production No toxic bi-products Variability in delineation easily addressed 9
10 Remedial Design Components Mass Loadings Treatment Requirements 3,100 lbs PCBs 200 lbs Ozone/day 54,000 lbs petroleum months hydrocarbons Delivery Requirements: Clean-up Objectives Multiple injection points: 1 ppm in soil (on-site) Three injection depth 0.2 ppm in soil (off-site) intervals (~20 centers) 0.5 ppb in groundwater Shallow points at 9 bgs Middle depth points at 15 Approvals bgs Remedial Action WorkPlan Deep points at 40 bgs DGW-PBR Emission Control (e) waiver 10


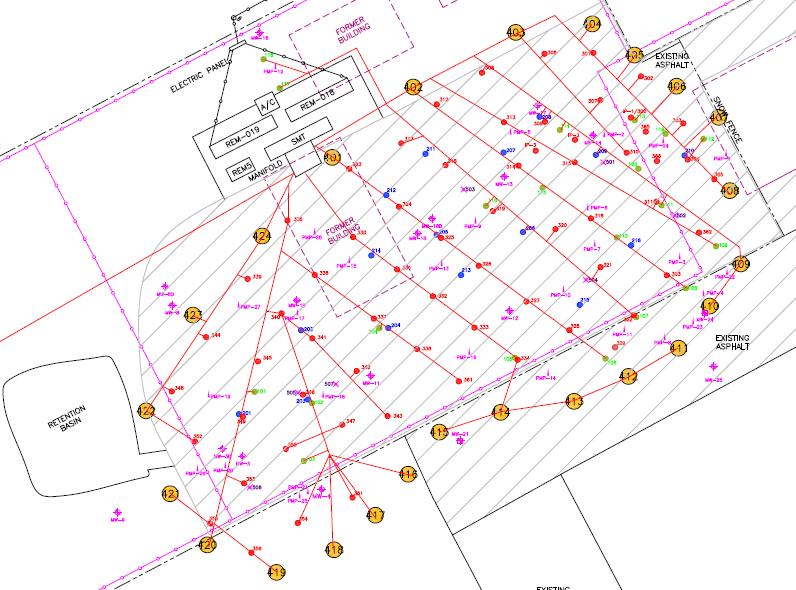

11 The Delivery Network 11


12 Production Capabilities Two RemedO 3 zone TM Systems Including Air compressors, Oxygen Separators, 100-PPD Ozone Generators, 10 valve primary manifolds, PLC controllers, O 2 /O 3 sensors and alarms Secondary Manifold Trailer Including 20 secondary manifolds, double containment, ozone destruction and O 3 sensor SVE Manifold, Knockout, and 7.5 hp Blower Two 300 lbs VGACs 12
13 Operational Data Ozone Conc. 10 Conc. (% by 8 wt) Jan 31-Jan 1-Mar 31-Mar 30-Apr 30-May 29-Jun 29-Jul 28-Aug Date Runtimes Hours 12,768 Days 532 Months 17.5 Injections Daily Average (LBS/DAY) Total (LBS) Ozone ,981 Oxygen 2,974 1,582,286 Average 75% uptime since startup 13
 VOCs/SVOCs (EPA Method 8260/8270) Chlorides (SM 4500 CL-B) Modeling CTech MVS Kriging 14")
14 Monitoring Data Analysis PCBs (EPA Method 8082) Aroclors 1016, 1221, 1232, 1242, 1248, 1254, 1260, 1262, 1268 TPH (NJ-OQA_QAM-025) VOCs/SVOCs (EPA Method 8260/8270) Chlorides (SM 4500 CL-B) Modeling CTech MVS Kriging 14
15 Performance Network - GW 15 Upgradient MW-15, -16 Source Area MW-17, -14, -13, -18, -12, -19, -11, -3, -8 Downgradient MW-9, -7, -6
16 Dissolved Oxygen and ORP in Monitoring Well MW-14 16
17 17
18

19 Sitewide PCB in GW Jul 2010 Jan 2011 Oct 2011 Jul 2011 Jan 2012 Aug
; VD (2.5-7.0 bgs) WT (7.0-8.5 bgs) SI (8.")
20 Performance Network - Soils 32 Locations 4 Quadrants 5 Discrete Depths VS (0-2.5 bgs); VD ( bgs) WT ( bgs) SI ( bgs); SD (16-24 bgs) 20


21 PCB Reduction Trend in Soils June 2010 Sept 2010 Mar 2011 Sept Months 21 Mar 2012 Sep 2012
22 PCB Mass Reductions Site-wide PCB Reductions % change from highest % change from baseline Months Dates LBS % change from last 0 Sep Mar % -45% 12 Sep % 33% 3% 18 Mar % 56% 37% 24 Aug % 59% 40% PCB LBS Baseline to Present PCB LBS

23 Petroleum Hydrocarbon Remediation Trend in Soil: 0-24 Months Sept 2010 Mar 2011 Sept 2011 TPH Months 0 Sep-10 6 Mar Sep Mar Aug-12 TPH LBS Reductions % change from highest % change from baseline % change from last % 47% % -22% % 55% 45% % 50% 40% 23 Mar 2012 Sep 2012


24 Are we on Track? 24
25 Operations Summary Attaining production capacity targets Maintaining desirable runtime percentages Preventing fugitive emissions Remediation Achieving the liberation of COCs from soil and waste matrices Achieved 59% reduction in target PCB COCs Future Uses Non-residential reuse Renewable Energy Alternatives 25


26 Partners in the Project The Resource Renewal Companies 30 Twosome Drive, Suite 1, Moorestown, New Jersey, USA BLUE Blue Lightning Underground Enterprises» Remediation Contracting RCC Resource Control Consultants» Engineering and Project Management Antea TM Group, USA 1031 US Highway 22, Bridgewater, New Jersey, USA Formerly Delta Consultants International Engineering & Environmental Consultancy S2C2 5 Johnson Drive, Suite 12, Raritan, New Jersey, USA High Resolution Site Characterization 26