SAN FRANCISCO BAY SPORT FISH MONITORING, 2009 AND BEYOND
|
|
|
- Matthew Chambers
- 5 years ago
- Views:
Transcription


1 SAN FRANCISCO BAY SPORT FISH MONITORING, 2009 AND BEYOND
2 Background: Objectives Produce the information needed for updating human health advisories and conducting human health risk assessments Measure contaminant levels in fish species over time to track temporal trends and to evaluate the effectiveness of management efforts Evaluate spatial patterns of contamination in the Bay food web Understand factors that influence contaminant accumulation in sport fish in order to better resolve signals of temporal and spatial trends
3 Background Collaboration with SWAMP (and the Bight Program) Additional sampling: more species, more replicates No reporting cost for RMP RMP prioritization Move to a five year cycle

4 Sampling Locations 6 SF Bay 9 Coast
5
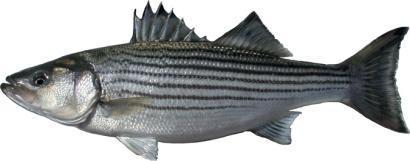
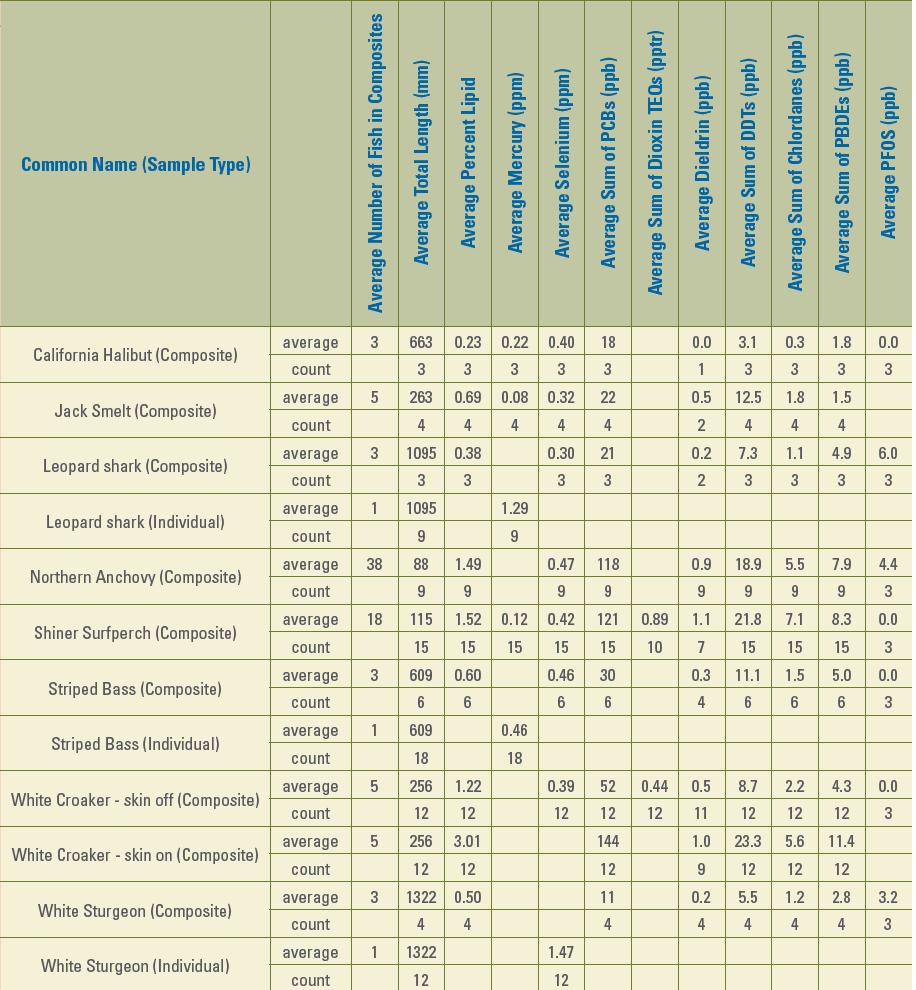
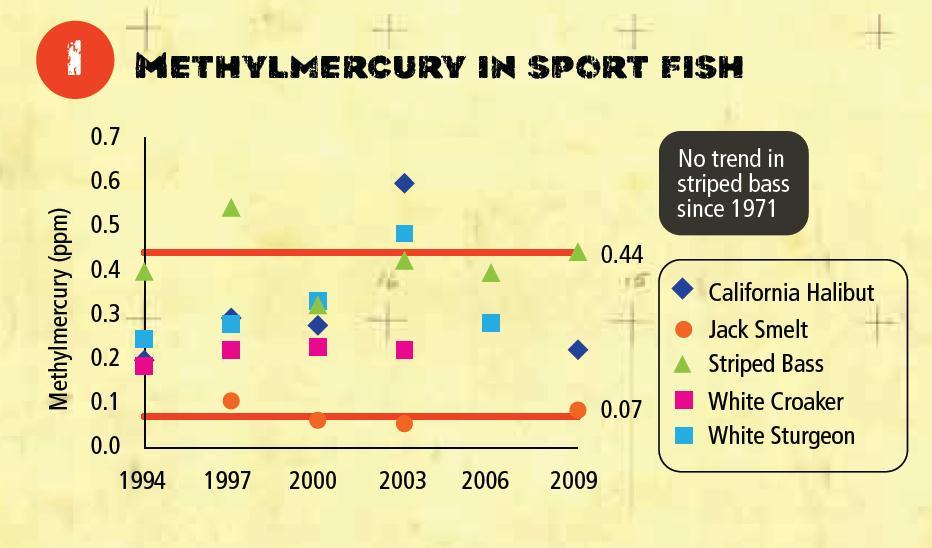
6 Mercury Hot sharks Striper high Others not that high, but above 0.07 ppm
7 Mercury Shiner Surfperch Stunning spatial indicator Oakland Harbor is highest (2X San Pablo), South Bay also higher than others
8 Mercury Striped bass: integrative Estuary indicator All concentrations standardized to 60 cm Some spatial variance in here
9
10
11 Methylmercury High concentrations across much of the coast, especially North and Central
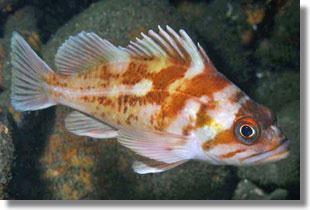
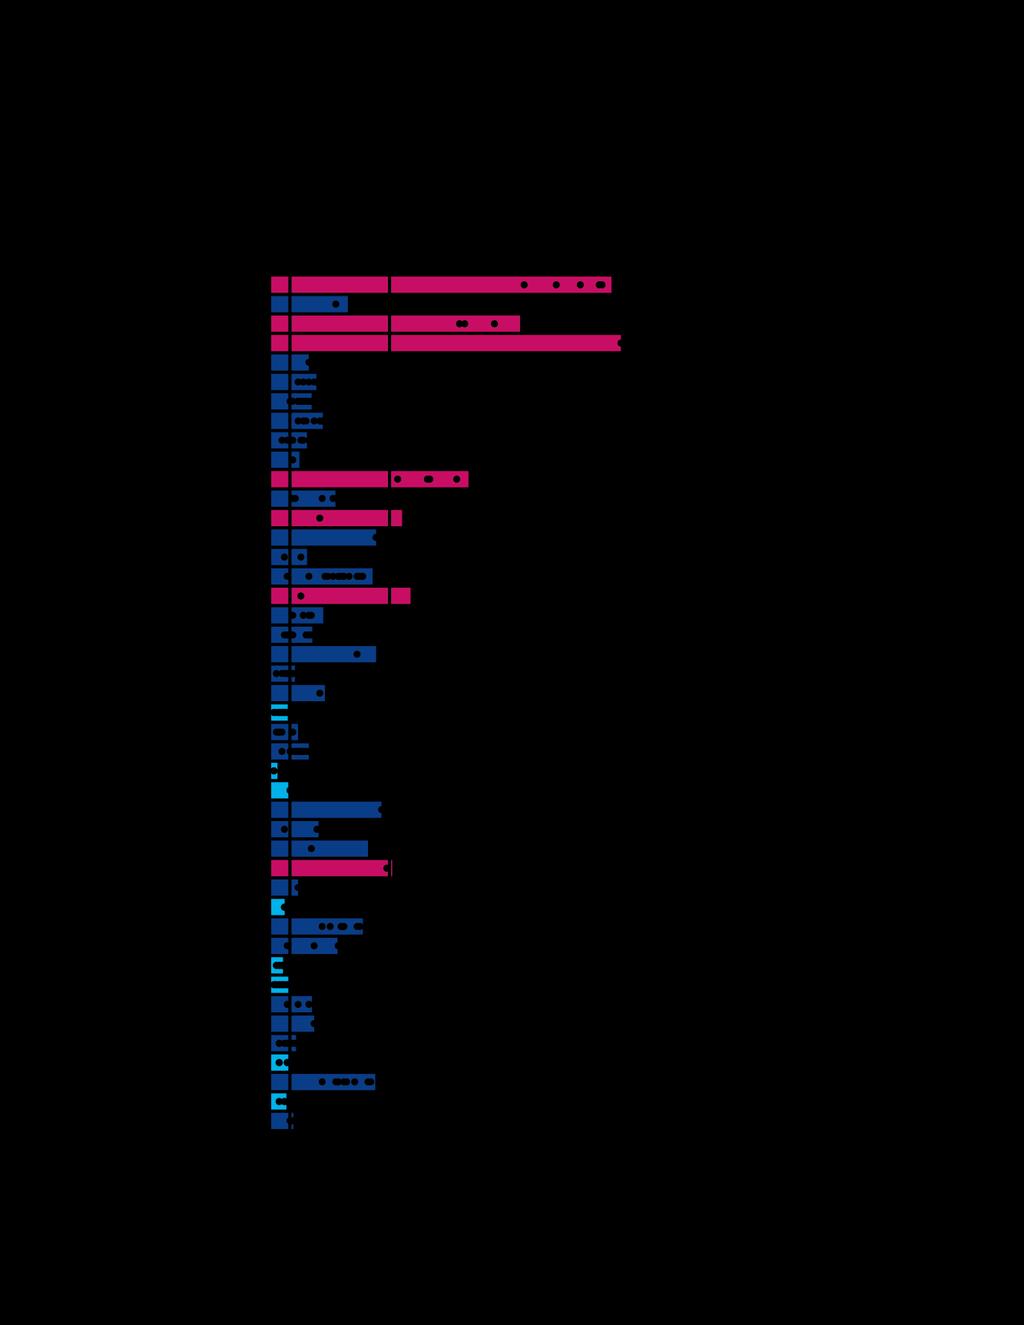
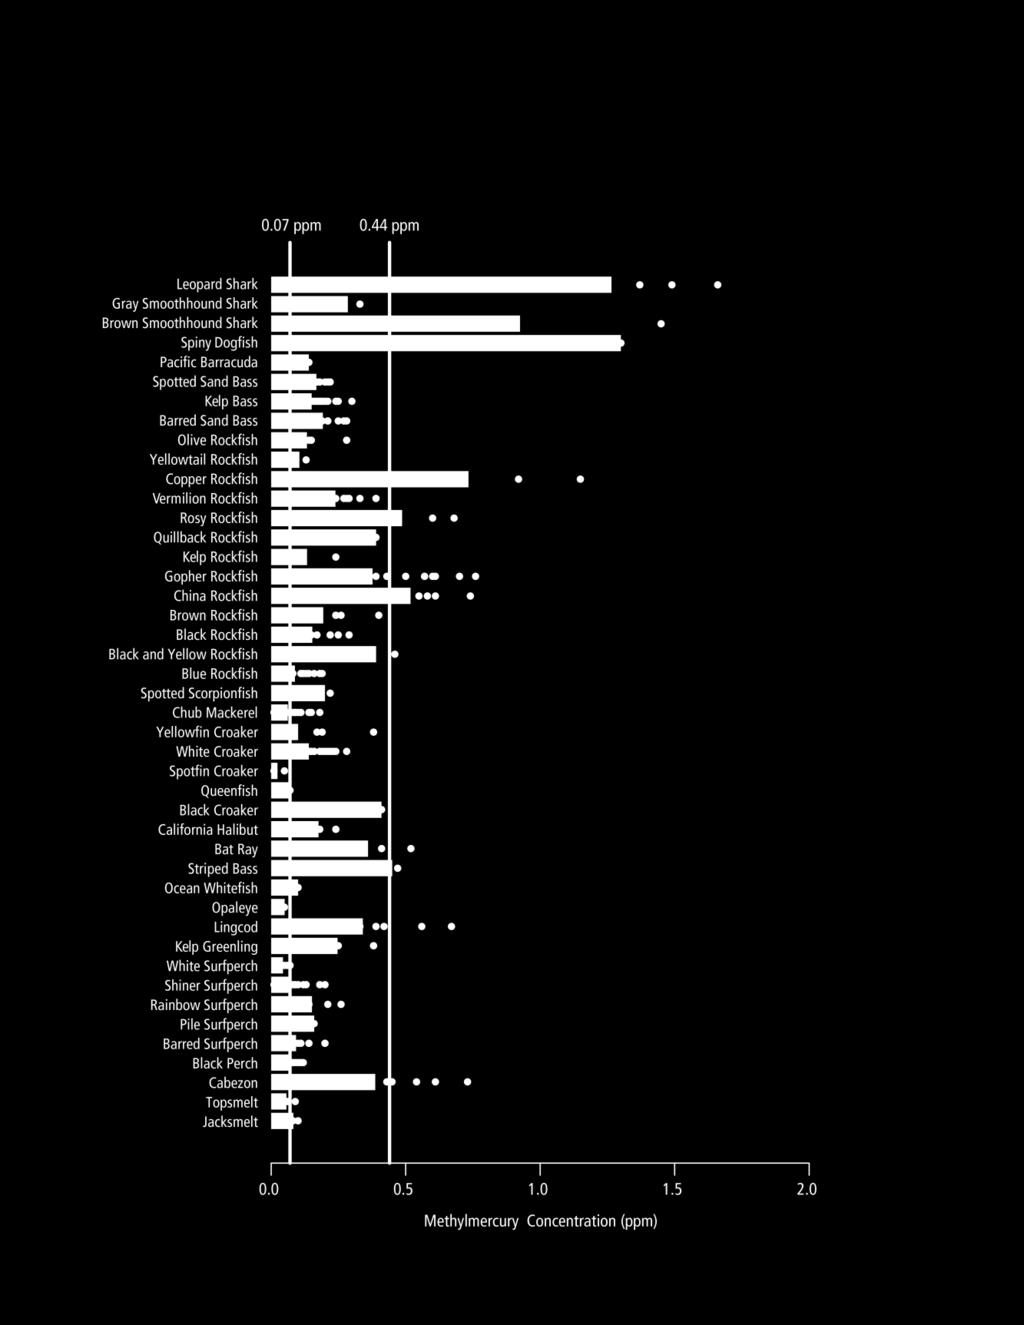
12 Methylmercury (ppm) High Species Sharks Rockfish Striped bass Lingcod Cabezon
13 Methylmercury (ppm)


14 Mercury in Striped Bass San Francisco Bay New Jersey South Carolina Chesapeake Bay Narragansett Bay Louisiana Mercury (ppm wet)
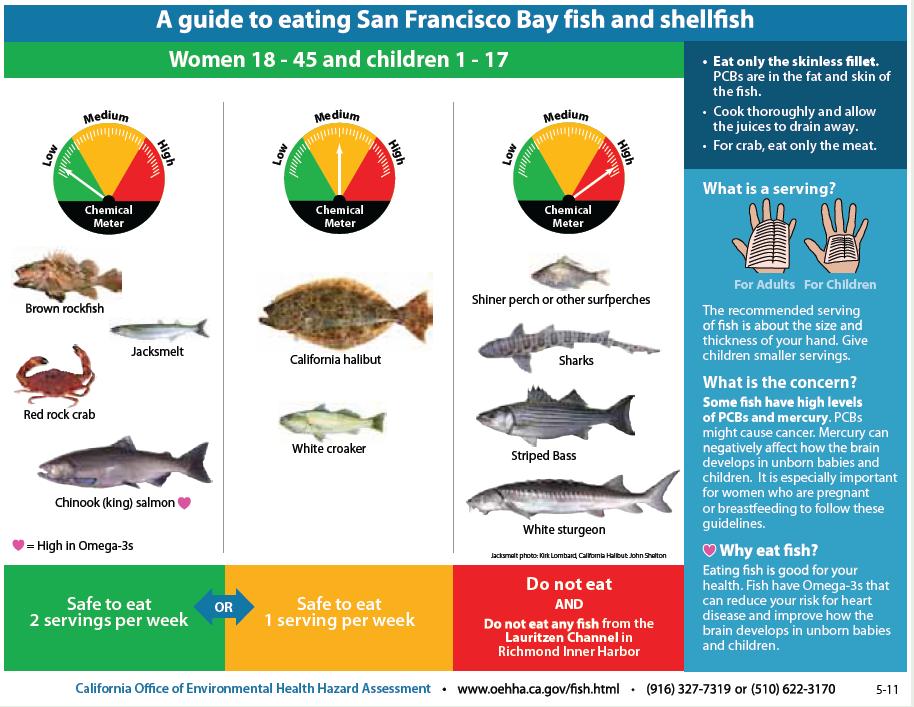
15 Conclusions: Mercury Sharks very high, striped bass high Other species all above lowest threshold Five-species average only includes three species above TMDL target Oakland Harbor elevated (2X higher than San Pablo), South Bay also No trend apparent in striped bass SF Bay stands out
16 PCBs Sum of 53 congeners White croaker: skin on vs skin off 65% reduction(!) greater than seen in 1997 (33%) Slope = 0.35
17 PCBs Shiner: w/skin, note spatial variance Anchovy: w/skin, 9 cm, consistently high Croaker: no skin All averages above 10 ppb All samples above 3.6 ppb Two-species average 8X TMDL target

18 PCBs Shiner Surfperch, wet weight Stunning spatial indicator ABCDE! Two zones above 120 ppb Oakland 5X San Pablo
19 PCBs White Croaker, with skin (except 2009), WET weight Low in 2009 (especially relative to 2006), but

20 PCBs White Croaker, with skin (except for 2009), LIPID weight 2009 in middle of distribution Skin-off trend should be less noisy
21 PCBs Shiner, WET weight Significant spatial component 2009 intermediate-low
22 PCBs Shiner, LIPID weight Significant spatial component 2009 at low end, but not much different from 1997 Shiner higher than Croaker on lipid basis looks like a spatial effect
23 PCBs

24 PCBs Widespread moderate contamination in Central and South A few hotspots Clear pattern consistent with urban areas
25
26
27 Conclusions: PCBs Skin removal reduced concentrations by 65% Similar to mercury one species at no consumption ATL Others all intermediate, none below 3.6 ppb Two-species average 8X above the TMDL target Strong spatial gradients detected Oakland Harbor highest (216 ppb 5X higher than San Pablo), SF Waterfront second (162 ppb) San Pablo lowest (39 ppb), but still high relative to other coastal zones Long-term variation in wet weight concentrations, but no trend on lipid weight basis Differences among species in congener metabolism evident (data not shown) SF Bay stands out
, suggestion of spatial variation Croaker: lower (average=0.")
28 Dioxins Sum of dioxin and furan TEQs Well above 0.14 pptr target Shiner: higher concentrations (average=0.89), suggestion of spatial variation Croaker: lower (average=0.44), low sample size Shiner, wet Croaker, wet, skin off

29 Dioxins White Croaker: Wet weight; skin on , skin off 2009

30 Dioxins White Croaker: Lipid weight; skin on , skin off 2009 Lowest in 2009, but statistically not different
31 Conclusions: Dioxins Dioxins do appear to be a problem Shiner 6X above target, croaker 3X above target Apparent spatial gradient (Oakland ~3X San Pablo) Big drop in wet weight croaker in lowest on lipid weight basis, not significant though
32 DDTs White Croaker: WET weight; skin on , skin off all below 64 ppb target and FCG Lowest in 2009, statistically different from most years
33 DDTs Shiner Surfperch: WET weight Concentrations holding, all below 64 ppb target, some above FCG Spatial pattern

34 Dieldrin White Croaker: WET weight; skin on , skin off 2009 Lowest in all below 1.4 ppb target, most above 0.46 ppb FCG
35 Dieldrin Shiner Surfperch: WET weight All below 1.4 ppb target, all above 0.46 ppb FCG Concentrations holding
36 Conclusions: Legacy Pesticides A minor problem All below TMDL target, some above FCG Croaker (wet weight) low in 2009 Shiner (wet weight) similar in 2009 to previous years Spatial variation in shiner
37 Selenium WET weight White sturgeon highest a function of diet All but one sample below 2500 ppb two serving ATL All below the 4900 ppb one serving ATL
38 Selenium in White Sturgeon Fillet vs Muscle Plug Significant (p<.001), but not when two highest points excluded Fillet = 0.80*plug (plugs 25% higher than fillets) Good enough validation of the plug approach?

39 Selenium in White Sturgeon No trend
40 Conclusions: Selenium Not a human health problem One white sturgeon sample above 2500 ppb (lowest OEHHA threshold) in the Bay Water Board has proposed a sturgeon tissue target of 6.0 to 8.1 μg/g dry weight for the North Bay few samples have exceeded this Pretty good correlation between sturgeon plugs and fillets good enough? No trend in sturgeon since 1997
41 PBDEs Maximum of 14 ppb Well below 100 ppb 2 serving ATL Highest in Shiner and Anchovy Croaker (skin off) lower than leopard shark and striped bass

42 PBDEs Shiner, WET Similar pattern to PCBs, gradient not as strong (Oakland 2X San Pablo)

43 PBDEs Shiner, skin on, WET Low in 2009
44 Conclusions: PBDEs Maximum of 14 ppb way below 2 serving ATL Interspecific variation a little unusual Some spatial gradient (2-fold) Low concentrations in 2009, but not enough data to call it a trend
45 PFOS Many non-detects 40 ppb is the 1 meal/wk threshold in MN (8 ounce, adult) Maximum of 18 ppb in one Leopard Shark sample any concern?
46

47
48 Wish List of Additions Include all five species for the TMDL (add white sturgeon, white croaker) Additional species for advisory
49 Deletions? xx
50 Questions Any urgent sampling needs? Should the consumption survey be repeated at some point? When? Continue skin-on sampling of white croaker? Continued selenium sampling in multiple species? Switch to muscle plugs? Dioxin plan for next round? PFC plan? Any other CECs to look for?
51