Roles and functions of government for promoting MFA application and resource management - (A-2) Case Studies for Japan- Yuichi Moriguchi,, Dr. Eng.
|
|
|
- Melissa Carr
- 5 years ago
- Views:
Transcription
 Case Studies for Japan- Yuichi Moriguchi,, Dr. Eng.")
1 Sustainable Resource Management Workshop hosted by CTCI, 5-6 October 2009 Yen Tjing Ling Industrial Research Institute, National Taiwan University, Taipei Course A (for Governmental Agencies) Roles and functions of government for promoting MFA application and resource management - (A-2) Case Studies for Japan- Yuichi Moriguchi,, Dr. Eng. Director Research Center for Material Cycles and Waste Management National Institute for Environmental Studies, Japan Visiting Professor, Graduate School of Frontier Sciences, The University of Tokyo Vice Chair (Ex-Chair), OECD/EPOC/WGEIO Member, International Panel for Sustainable Resource Management 1
2 Background in Japan Visible problems associated with increasing volume and diversified quality of solid wastes (shortage of disposal site, risk of environmental pollution by waste treatment facilities, illegal dumping, increasing cost, etc,) High dependency on imported natural resources and problems hidden behind (indicated e.g. by Ecological rucksack, ecological footprint and so on) The spirit of Mottainai Mottainai is a long-established Japanese concept meaning that it is a shame for something to go to waste without having made use of its potential in full. This expression incorporate a respect for the environment that das been handed down from ages past. 2

3 Environmental implications of mass-production and mass-consumption Consumption of energy and resources, emissions of environmental burdens throughout the whole life-cycle Produc tion Supply chain Consump tion Disposal Treat ment Landfill Resource extraction Environmental impact by extraction and harvest Extended Producer Responsibility Increasing cost for increasing waste to be managed Illegal dumping Shortage of landfill, Not-in-my-backyard (NIMBY) Remarkable reduction of Dioxins Significant reduction of landfill 3
4 Reform of waste management and recycling policy toward a Sound Material-cycle Society 1. Three main trends of waste and recycling measures Responsibility of waste-generating businesses (mainly for industrial wastes) Recycling measures through Extended Producer Responsibility (EPR) Collaboration between local and central governments, (mainly for municipal wastes) 2. Crosscutting approach Promotion of various technical developments (EcoDesign, 3R technologies, Incineration and final disposal technologies) New approaches toward lifestyle change ( Mottainai spirit, everyday life, education, green purchasing) 4
 Recycling-based Cycle-oriented Sound material-cycle 大量生産 大量消費 大量廃棄型社会 Saving resources 循環型社会 Junkan Reducing")
5 Transition of socio-economic structure Mass-production, mass-consumption, mass-disposal society One-way Sound material-cycle society (SMCS) Recycling-based Cycle-oriented Sound material-cycle 大量生産 大量消費 大量廃棄型社会 Saving resources 循環型社会 Junkan Reducing burdens 5
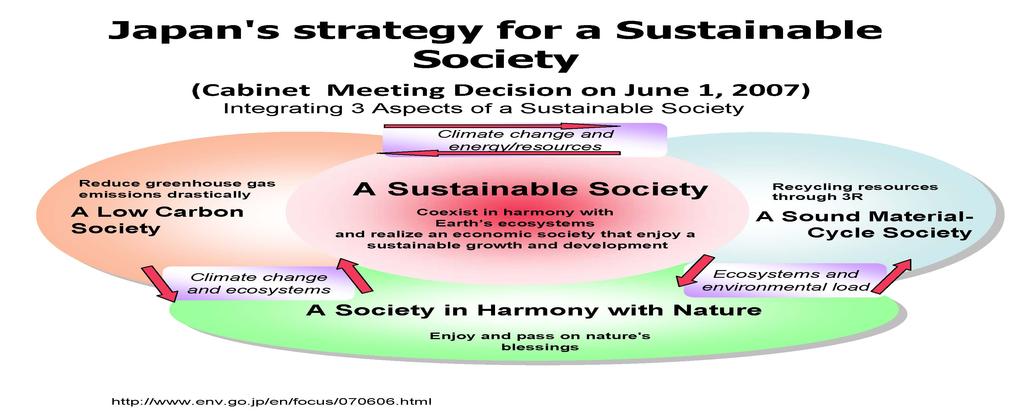
6 Concept of a Sound Material-Cycle Society Japan is undertaking the transition to a Sound Material-Cycle Society. A sound material-cycle society, in which the consumption of natural resources is minimized and the environmental load is reduced as much as possible, is established by promoting reduction, reuse, recycling, energy recovery and appropriate disposal. 6
7 Scheme of a Sound Material-Cycle Society Input of Natural Resources First: Reduce Reduction Reduce generation of Production wastes and byproducts (Manufacturing, distribution, etc.) Material Recycling Recycle those cannot be reused as raw materials Consumption, Use Reuse Use goods repeatedly Treatment (Recycling, incineration, etc.) Discard Energy Recovery Recover energy from those having no alternatives but incineration and unable to be materially recycled Final Disposal Proper Disposal Dispose of those cannot be used by any means 7
8 Law and Regulation Fundamental Environmental Law Fundamental Law for Establishing a Sound Material-Cycle Society Fundamental Plan Fundamental Plan (Establishment of General Systems) Waste Management and Public Cleansing Law Law for Promotion of Effective Utilization of Resources (Regulations according to the characteristics of respective Items) Container and Packaging Home Appliances Construction Materials Food Wastes End-of-life Vehicles Law on Promoting Green Purchasing 8
9 The Fundamental Plan for Establishing a Sound Material-Cycle Society (Outline) The Fundamental Plan for Establishing a Sound Material-Cycle Society (Outline) Present Situation: Unsustainable Activity Patterns of the 20th Century Present Situation: Unsustainable Activity Patterns of the 20th Century Problems: Realization of Social and Economic Problems: Realization of Social and Economic Systems Based on Recycling Systems Based on Recycling Solution of Waste Problems Solution of Waste Problems Present Present Situation Situation and and Problems Problems Lifestyle: Using high quality goods with care, "Slow" Lifestyle Lifestyle: Using high quality goods with care, "Slow" Lifestyle Manufacturing: DfE (Design for Environment), Long-life Manufacturing: DfE (Design for Environment), Long-life products, Lease & Rental products, Lease & Rental Image Image of of a a sound sound material-cycle material-cycle Society Society Quantitative Targets: Targets: FY Targets Targets for for Indicators Indicators Based Based on on Material Material Flow Flow Accounts Accounts (1) (1) "Input : "Input : Resource Resource Productivity Productivity FY2010: FY2010: About About thousand thousand yen/ton yen/ton (About (About 40% 40% improvement improvement from from FY FY 2000) 2000) (2) (2) "Recycling": "Recycling": Rate Rate of of Reuse Reuse and and Recycling Recycling FY2010: FY2010: About About 14% 14% (About (About 40% 40% improvement improvement from from FY FY 2000) 2000) (3)"Output": (3)"Output": Final Final Disposal Disposal Amount Amount FY2010: FY2010: About About million million tons tons (Almost (Almost 50% 50% reduction reduction from from FY2000) FY2000) 2 2 Targets Targets for for Effort Effort Indicators Indicators Reducing Reducing the the quantity quantity of of municipal municipal solid solid waste: waste: reducing reducing the the amount amount of of garbage garbage discharged discharged from from households households per per person person per per day day by by 20% 20% from from FY2000 FY2000 Expanding Expanding the the sound sound material-cycle material-cycle business business market market Efforts Efforts of of Entities Entities The State: Fostering partnerships among social stakeholders, leading activities for establishing a sound material-cycle society, etc. The State: Fostering partnerships among social stakeholders, leading activities for establishing a sound material-cycle society, etc. Citizens: Citizens: Changing Changing their their lifestyle lifestyle to to establish establish a a sound sound material-cycle material-cycle society, society, etc. etc. NPOs/NGOs: NPOs/NGOs: Promoting Promoting activities activities that that contribute contribute to to establishing establishing a a sound sound material-cycle material-cycle society, society, etc. etc. Business Business organizations: organizations: Promoting Promoting appropriate appropriate reuse, reuse, recycling recycling and and disposal disposal of of wastes wastes based based on on EPR, EPR, etc. etc. Local Local governments: governments: Enforcing Enforcing laws laws and and regulations, regulations, acting acting as as a a coordinator coordinator among among various various local local entities, entities, etc. etc. 9
10 Fundamental Plan for Establishing a Sound Material-Cycle Society Quantitative Targets: FY Efforts Efforts Required of of Entities National Government Fostering partnerships among among stakeholders Citizens Changing their their lifestyle lifestyle NPOs and and NGOs Promotion of of their their activities Business Organizations Promoting the the 3Rs 3Rs based based on on EPR EPR (Extended Producer Responsibility) Local Governments Enforcing laws laws and and regulations; acting acting as as coordinators 10
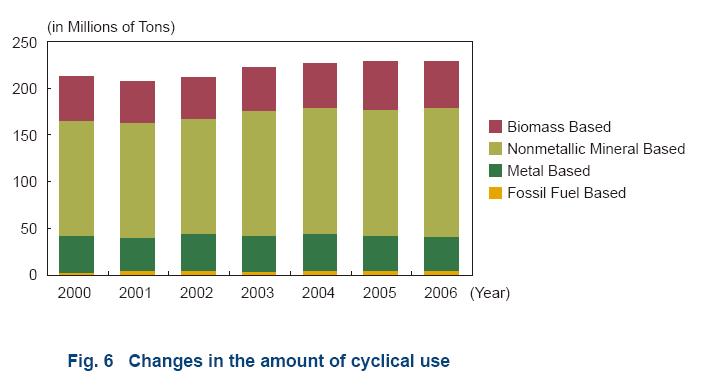
11 Fundamental Plan for Establishing a Sound Material-Cycle Society Image Image of of a Sound Sound Material-Cycle Society Manufacturing: DfE (Design for Environment), long-life products, lease & rental Waste management: cyclical use, appropriate disposal system Quantitative Targets: FY Targets for for Indicators Based Based on on Material Flow Flow Accounts a) a) Resource Productivity b) b) Cyclical Use Use Rate Rate c) c) Final Final Disposal Amount 2 Targets for for Indices Related to to Efforts Efforts Reducing the the quantity of of municipal solid solid waste waste 20% 20% reduction reduction of of garbage garbage discharged discharged from from households households per per person person per per day day compared compared with with FY2000 FY2000 Promoting sound sound material-cycle related related businesses Doubling Doubling the the size size of of the the related related market market and and the the number number of of related related jobs jobs compared compared with with FY FY
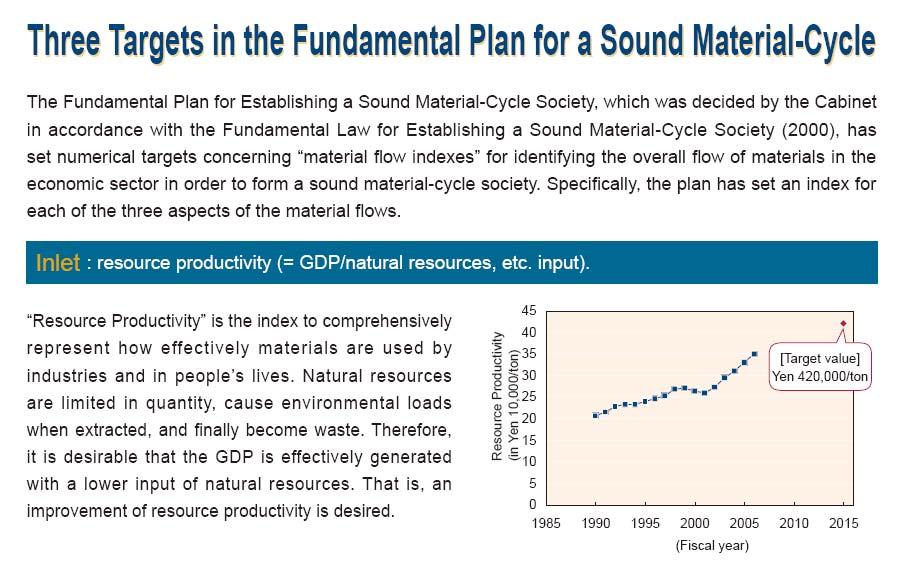
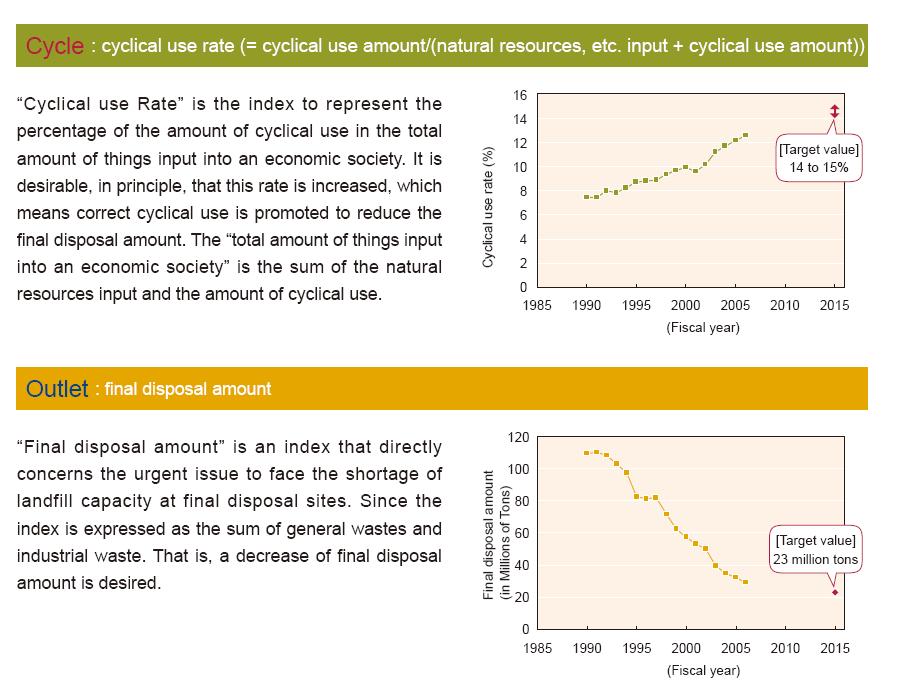
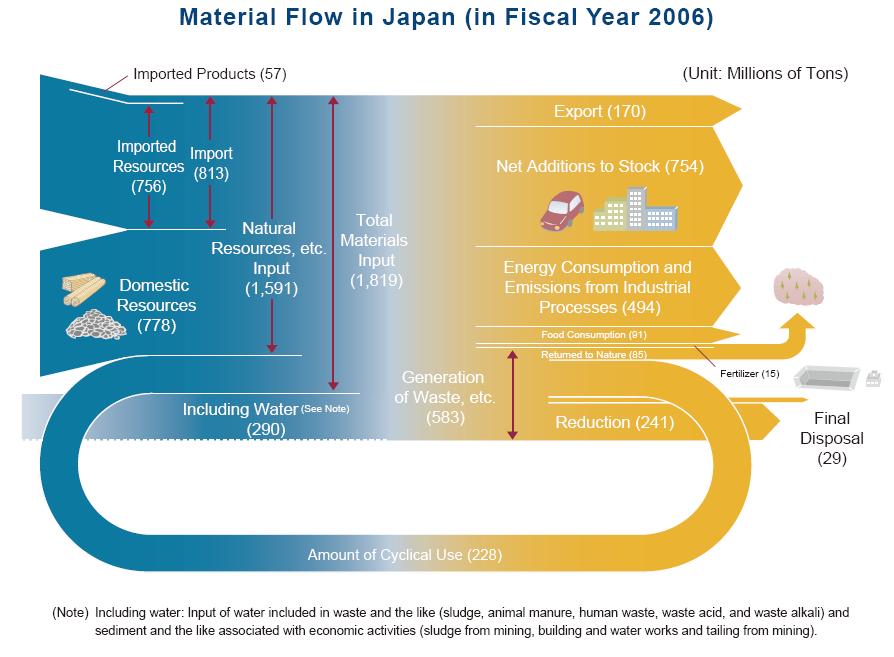
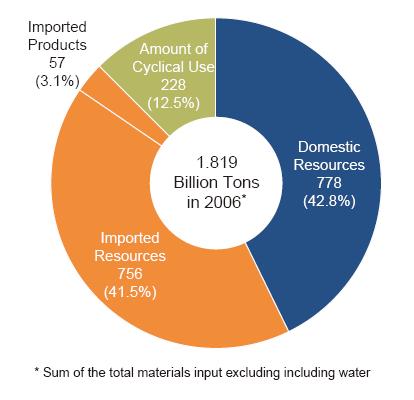
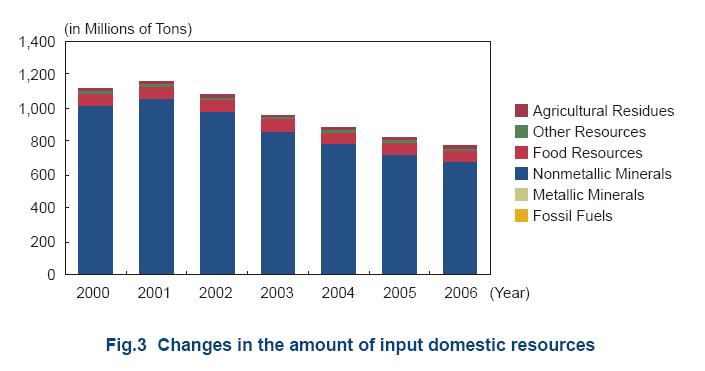
12 Trend of 3 material flow indicators 10000J PY/t) 50 Resource productivity 40%increase Resource productivity = GDP Direct Material Input(DMI) 25 Cyclical use = Cyclically used amount DMI+Cyclically used amount Final disposal = Final disposal of solid wastes (FY) (%) Cyclical use 40% Increase (million ton) Final disposal 50% reduction (FY) (FY) 12
13 Decomposition of resource productivity DMI GDP = DMI DMI + R k i k k DMI To increase the use of recycled materials out of total input of resources To reduce direct & indirect material required by the production of each commodity (by technology improvement) DMI:Direct Material Input R: Amount of recycled materials k k, i F i + R k, i Fi F Changing the pattern of consumption and investment (transition to less materialintensive demands) F GDP Reduction of dependence on imports 13
14 Decomposition analysis of resource productivity (by materials) DMI GDP = DMI ( DMI + ) k k, i Rk, i Fi k i ( DMI + R ) k k F i F F GDP Material Use Intensity (Inverse of RP) = 1 Cyclical Use Rate Induced Material Use Intensity Structure of Final Demand 1 + Average Propensity To Import Minerals Machinery Construction Services Other Hashimoto S. et al., Journal of Industrial Ecology, 12(5-6), ,
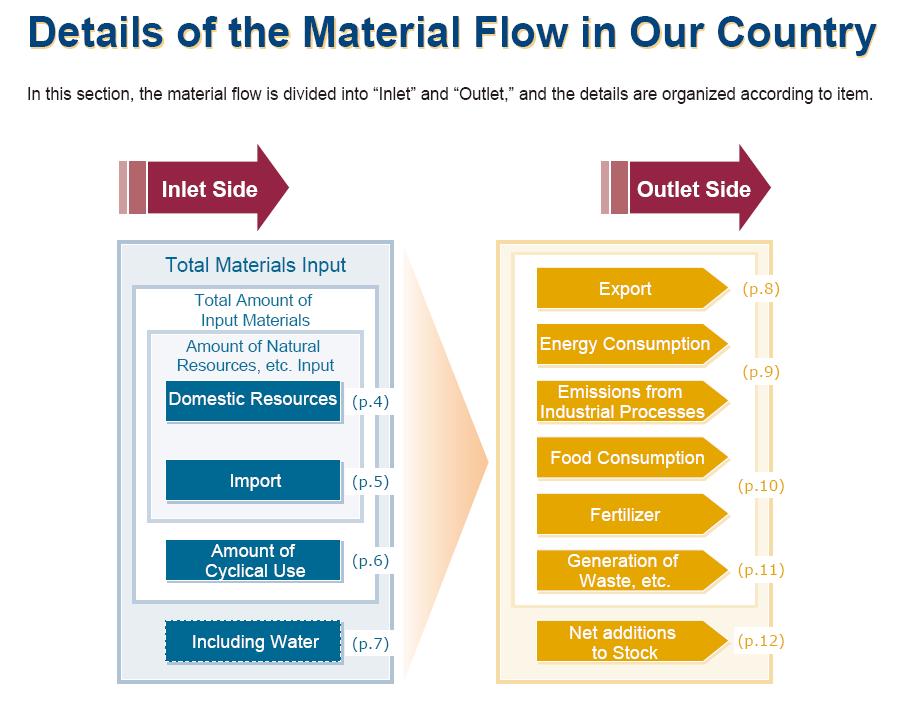
15 The Extension of Indicators under the 2nd Fundamental Plan for Establishing a Sound Material Cycle Society (Mar. 2008) (material flow based indicators) 1 Indicators with target setting (as compared with 2000) 1) Input": Resource Productivity increase % % 2) Recycle : Cyclical use Rate increase % % 3) Output": Final Disposal Amount reduction % % 2 Supplementary indicators with target setting 1) Resource productivity not including resource input of construction minerals 2) Collaboration with the action for low carbon society - the amount of reduction by the measures of waste sector to reduce GHGs emission - GHGs emission associated with waste sector and fossil fuels to be substituted by waste power generation (monitoring) 3 Indicators to monitor progress 1) Resource productivity related to fossil fuels 2) Input rate of biomass resources 3) Hidden Flow and TMR (Total Material Requirement) (the example of estimation:about 21 times larger than the import of metal resources) 4) Indicators considering international resource circulation 5) Resource productivity of each industrial sector 15
16 Examples of progress in recycling Aluminum Cans Recovery rate > 90% Can-to-can recycling is practiced Recycling of Aluminum avoids energy intensive smelting process and accompanied CO 2 Recycling of waste packaging plastics e.g. Chemical feedstock recycling such as substitute to coking coal for steel making 2kg CO 2 avoided per 1kg waste plastics, compared with incinerator with power generator of 10% efficiency 16
17 Opportunities and limitation of recycling Opportunities Reducing primary resource requirement and associated environmental impacts of mining (e.g. of Copper) Reducing energy consumption and carbon emission of material production (e.g. of Iron and Aluminum) Limitations Negative environmental impacts by application of immature recycling process Imbalance between supply and demand of secondary resources (e.g. Steel scrap availability from developed economies are not sufficient for meeting demand from developing economies) 17
18 18
19 Energy vs. Material resources Possibilities for Win-win relations A common framework of material and energy flow analysis can describe both material flows and energy flows. Majority of raw material industries are energy-intensive and carbon intensive, so the reduction of raw material consumption through 3Rs will contribute to mitigate GHG emissions. Needs for integrated understanding and management When is the best timing for consumers to replace less-energy efficient durables (cars, refrigerators, air-conditioners, etc.) with up-to-date efficient models? Isn t it Mottainai to discard equipments still durable? Is it adequate to export 2 nd hand electric equipment to developing countries? Energy pay-back time considers only trade-off between increasing energy requirement in initial stage and reduction in later stages, and additional nonenergy mineral use is usually not taken into account. 19
20 Trade-off and substitution between energy and material resources Both fossil fuels and non-energy minerals (e.g. metals) are non-renewable. More energy is sometimes required to reduce material requirement, and more materials are required to reduce energy requirement. Additional use of non-energy resource may lead to the increase of future energy consumption for lower-grade ore processing. How should we account for increasing use of precious/rare metals for photovoltaic, fuel cell vehicle? Methodology of life-cycle impact assessment for this kind of trade-off should be elaborated. 20
21 General framework of Material Flow Analysis Energy Resources Target unit Material resources Parts, Materials, Products Process Company Sector City Region Nation Products, By-products Pollutants, Wastes 21
22 (1000t) 1,400,000 1,200,000 1,000, ,000 Trends of Crude Steel Production by Region World Asia Japan China USA EU15 600, , ,
23 Metabolism of Cities Indirect GHGs Fossil fuels Electricity Ind. Products Foods Water Raw materials GHGs, air pollutants Cities throughput Infrastructure Traditional materialized urban activity Products and services with value added Waste water Solid waste 23
24 Urbanization is carbon & energy intensive Steel and cement, key materials for building urban infrastructure, are carbon-intensive. ca. 0.8t-CO 2 /t-cement production ca. 1.5t-CO 2 /t-steel production Once urban infrastructure is built, it prompts energy consumption through operation, e.g., heating/cooling space, driving on road, pumping sewage, etc. 24
25 Metabolism of Cities Solar energy (Renewable) Indirect GHGs Fossil fuels Electricity Ind. Products Foods Water Raw materials GHGs, air pollutants Cities Recyclable Infrastructure Urban mine More ecological dematerialized urban activity Products and services with value added Waste water Solid waste 25

26 MFA in a corporate environmental reporting 26
27 27
28 28
29 29
30 30
31 31
32 32
33 33
34 34

35 35
36 36