Roadmap to Resilient, Ultra-Low Energy Buildings in the Pacific Northwest
|
|
|
- Nathaniel Hood
- 5 years ago
- Views:
Transcription

1 Roadmap to Resilient, Ultra-Low Energy Buildings in the Pacific Northwest 2017 PNWER ECONOMIC LEADERSHIP FORUM ANDREW PAPE-SALMON P.ENG., MRM, FCAE Victoria BC Nov. 7, 2017


2 Benefits from Addressing Energy in Buildings Affordability Reduced energy costs to consumers Lower carbon emissions Health and Safety Improved indoor air quality Resilience to extreme weather events Resistance to hazards Functionality Comfort Durability and lower maintenance costs Increased market value


3 PNWER Roadmap to Resilient, Ultra-Low Energy Buildings A document that will seek endorsement by legislators and private sector leaders from 10 PNWER jurisdictions Goal is to inform energy-efficiency legislation to achieve the desired benefits and specific targets for the year 2030 Provides: Market data, analysis and benefits Policy best practices Metrics, targets, timelines Market-driven solutions Includes case studies of new and retrofitted buildings that demonstrate best practices throughout the PNWER region
4 Case Studies Energy Savings New Case Study
5 Energy Savings (%) Energy Savings of Case Studies Homes (SFDs) Educational MURBs Offices 140% 64 % av. savings 76 % av. savings 50 % av. savings 84 % av. savings 120% 100% 80% 60% 40% 20% 0% Homes Educational MURBs Offices - Retrofit - New Construction


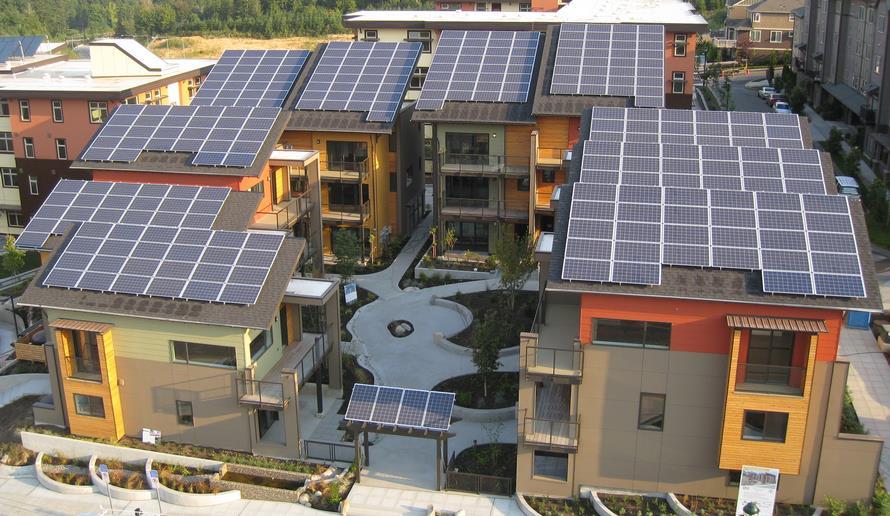
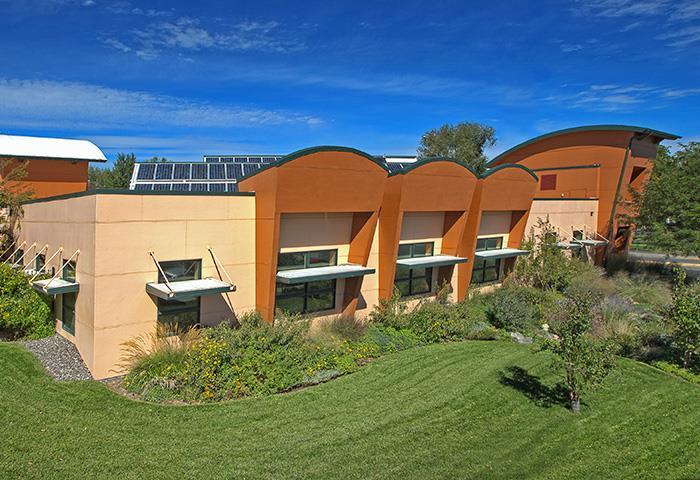
6 Example Buildings
7 Next step: Region - wide extrapolation Method

8 Region-wide Impact Assessment Forecast benefits and costs of implementing archetypes across the entire PNWER region by 2030 Benefits include: Energy savings, GHG emission reductions, associated cost savings, resiliency, investment and job creation. Extrapolation of case study impacts in line with: Current and future building stock and floor space by jurisdiction (10 in total) Consideration of regional climates and energy mix by jurisdiction
9 Extrapolation Methodology Estimate the annual floor area of new construction and alterations of existing buildings Estimate the annual energy savings for new or retrofit construction from case study averages Extrapolate energy savings of achieving performance levels of the PNWER case studies, rather than current practices Estimate associated GHG savings The annual savings will be extrapolated over the 30-yr time horizon with staged implementation to estimate cumulative annual savings in key years
10 Building Area Building Retrofit Area = Total Area x Retrofit Rate Building New Area = Total Area x New Build Rate Existing Building Area (millions ft 2 ) Jurisdiction SFH Low-rise High-rise Educational Office Retail AK ID OR 1, MT WA 3, BC 2, AB 2, SK YK Source: 2011 SHEU, 2009 SCIEU, 20 NWT Source: 2011 SHEU, 2009 SCIEU, 2009 RECS, 2012 CBECS and population weighting for inter-region jurisdiction interpolation
11 Annual Energy Savings Savings = Baseline x % Savings from Case studies Estimated Savings from Case Studies Type Retrofit Savings New Build Savings SFH 50% 60% Low-Rise 50% 35% High-Rise 50% 35% Note: the retrofit and new construction are relative to different baseline energy use Educational 50% 35% Office 50% 35% Retail 50% 35%
12 Region - wide extrapolation Preliminary Results
13 Energy (GWh/yr) DRAFT: Total Energy Use with Business as Usual 450, , , , , , , ,000 50,000 - Retail Office Educational Highrise Lowrise SFH Significant energy increases even with anticipated efficiency gains in new construction and retrofit projects Single family home market is the dominant contributor
14 Energy (GWh/yr) DRAFT: Total Energy Use with Roadmap Intervention 450, , , , , , , ,000 50,000 - Retail Office Educatio nal Highrise Lowrise Significant reductions in consumption with Roadmap intervention Prevents rise in consumption over 30-yr time horizon
15 Highlights from Key Intervals (all building types) Energy Savings Electricity Savings Natural Gas Savings GHG Savings Year yrs GWh/yr 8,500 41,000 87,000 % 2% 11% 20% GWh/yr 4,500 21,000 43,000 % 3% 13% 23% GWh/yr 4,000 20,000 44,000 % 2% 9% 19% T/yr 1,850,000 8,850,000 18,600,000 % 3% 11% 21% Substantial improvements compared to business as usual Approximately 20% reduction after 30-yrs Business as usual Retrofits: 10% improvement when retrofit New: ASHRAE with 1.5% annual improvement
16 Conclusions Ultra-low energy new construction and deep energy retrofits have been demonstrated with case studies in the 10 PNWER states/provinces/territories Energy savings can improve affordability for citizens, businesses and institutions Associated non-energy benefits include improved comfort and healthfulness, lower carbon emissions, increased durability and resilience to extreme events Roadmap could be used to guide PNWER jurisdictions to achieve those objectives through market-based approaches Partnership underway through PNWER Energy and Environment Working Group to complete research and prepare a White Paper
17 Future Work - Extrapolation Projections for: Greenhouse gas emission reduction Economic impacts: benefits and costs Investment, jobs, economic diversification Detailed analysis and extrapolation for specific regions Depends on funding partners, sponsorship
18 Discussion Roadmap to Resilient, Ultra- Low Energy Buildings Case Study Results Case Study Examples Extrapolation Methodology Future Work To become involved: contact PNWER at (206)
19 - Roadmap to Resilient, Ultra-Low Energy Buildings - Case Study Results - Case Study Examples - Extrapolation Methodology - Future Work To become involved: contact PNWER at jennifer@pnwer.org