Sustainable Urban Responses to Climate Change: Vulnerable Populations
|
|
|
- Dwight Jasper Chambers
- 5 years ago
- Views:
Transcription
1 Sustainable Urban Responses to Climate Change: Vulnerable Populations Networking Event World Urban Forum V Rio de Janeiro, Brazil 23 March 2010 Armando Carbonell Chairman, Department of Planning and Urban Form Lincoln Institute of Land Policy
2 Climate change is the greatest externality the world has ever seen. Stern Review
3 Mitigation, Adaptation, Suffering John Holdren White House Science Advisor

4

5

6
7 Highest cost 14 GtC 7 GtC Higher cost Lower cost Now 2050 Phase I Investment dominates Phase II Carbon prices dominate Regulation, taxation, carbon markets, investment
8 Uncertainty Tends to Matter Much More than Risk ML Weitzman, JEL , Review of Stern Review


9
10 How much do cities contribute to GHG emissions?
11 75 80%
12 Cities cover less than one per cent of the earth's surface but are disproportionately responsible for causing climate change. Clinton Climate Initiative

13 Total CO2 Emissions 2002 Source: Vulcan Project
14 40%
15 Cities produce surprisingly low carbon emissions per capita :17. Greenhouse gas emissions of city dwellers are often far smaller than the national averages, says a study in the April issue of Environment and Urbanization by David Dodman of the International Institute for Environment and Development.

16
17
18 Don't Blame Cities For Climate Change, See Them As Solutions, New Study Says ScienceDaily (Sep. 29, 2008)

19

20 Source: Eliot Allen, Cool Spots

21

22

23 Vision : Dense Hubs connected by high-speed transport Population density per square mile Source: U.S. Census 23

24

25

26

27
28

29

30

31 STUDIO 2009: ALMERE_IJSSELMEERGEBIED STUDIO 2010: ROTTERDAM_ DORDRECHT DELTA The Harvard Netherlands Project on Climate Change, Water, Land Use, and

32 50% Land area 60% Population 70% GDP below sea level

33


34 Ijsselmeer north, Afsluitduijk, Friesland Kampen, Ijssel river, Balgstuw IJburg, Almere center, Zeewolde

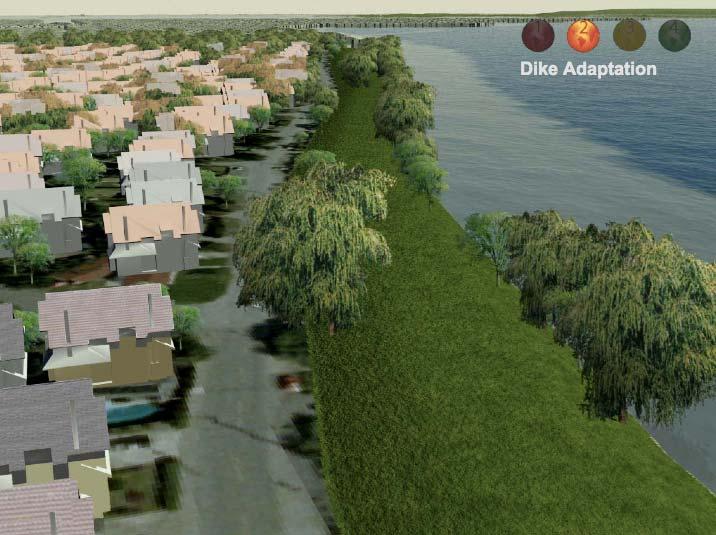
35 Adaptation: Resistance Resilience Retreat

36


37


38

39

40

41

42

43 source Storm Surge Entering New Orleans Photo Source: Associated Press


44 Washington, DC area 22 Miles Flooded Area of New Orleans 15 Miles White House US Capitol

45


46


47 Section of I-10 bridge east of New Orleans


48 Sources: Times-Picayune and Associated Press
49 Consequences of Hurricane Katrina 108,731 households had over 4 feet of flood water (50% of all New Orleans households) Source: GCR 90,000 square miles (233,000 km 2 ) flooded 1,464 Louisiana deaths; 500 missing (finalized estimate as of August 2006) Displacement of more than 400,000 people locally million regionally) Source: FEMA

50 Not just a dot on a map or a line in a database but a home with a family. Photo credit: Associated Press
51 New Orleans Estimated Population 1960: 627,523 (peak) August 2005 (pre-k): 437,186 (1,292,774 metro) October 2005: 70,000 (90k daytime) January 2006: 140,000 June 2006: 171, ,000 August 2006: 235,000 (1,065,000 metro) Spring 2008: 300,000 Spring 2009: 320,000 Sources: RAND Corporation, GCR, U.S. Postal Service, U.S. Census Bureau

52 source: USGS The Context for Land Use Planning: Flood depth from Katrina

53 Urban Land Institute Vision - a smaller footprint? (October 2005)
54 Bring New Orleans Back Commission Parks & Open Space Plan (November 2005)

55 Owner-occupied homes opting for buyout option from Louisiana From Green and Olshansky, 2009

56 Significant Clusters of Census Blocks with many sellers From Green and Olshansky, 2009

57

58 Lower 9 th Ward: River to the Bayou (May 2009)


59 Resilience
60 CO2e t/person Albania 2.21 Australia Canada China 3.05 EU Hong Kong 6.39 India 1.34 Indonesia 4.74 Iran 7.23 Israel Japan 9.65 Malaysia 3.78 Mexico 7.04 Netherlands Philippines 1.37 Russia Singapore 8.38 South Africa 9.36 South Korea 8.69 Sweden 7.86 Thailand 4.62 UK US 24.09
61
62 20 cities at greatest risk from sea level rise and storm surges in the developing world. (GCD) Manila, Philippines Alexandria, Egypt Lagos, Nigeria Monrovia, Liberia Karachi, Pakistan Aden, Yemen Jakarta, Indonesia Port Said, Egypt Khulna, Bangladesh Kolkata, India Bangkok, Thailand Abidjan, Cote d'ivoire Cotonou, Benin Chittagong, Bangladesh Ho Chi Minh, Vietnam Yangon, Myanmar Conakry, Guinea Luanda, Angola Rio de Janeiro, Brazil Dakar, Senegal

63 12 Countries most at risk World Bank

64 Awareness of Climate Change source: Gallup
65
66 In its long term forecast, Exxon says that by 2050, hydrocarbons including oil, gas, and coal will account for 80 percent of the world s energy supplies, about the same as today. N.Y. Times, 8 April

67 From concern
 www.lincolninst.")
68 to skepticism Source: Hyde Park.si (Slovenija)
69 Contact/more information Armando Carbonell Chairman, Department of Planning and Urban Form Lincoln Institute of Land Policy 113 Brattle Street Cambridge, MA Website: