SEASONAL VARIATION IN PHYSICO-CHEMICAL PARAMETERS OF KHADAKWASALA RESERVOIR
|
|
|
- Kory Small
- 5 years ago
- Views:
Transcription
1 SEASONAL VARIATION IN PHYSICO-CHEMICAL PARAMETERS OF KHADAKWASALA RESERVOIR P. N. Kamble, S. J. Kokate, H. R. Aher and S.R. Kuchekar* P. G. Department of Environmental Science, P.V.P. College Pravaranagar, At/P-Loni, Tal- Rahata Dist-Ahmednagar. M. S. E mail : shashi1@gmail.com ABSTRACT The Khadakwasala reservoir is situated near Pune. The study of physico chemical parameters like temperature, ph, electric conductivity, sodium, potassium, calcium, magnesium, bicarbonate, chloride, Sulphate, dissolve oxygen, biochemical oxygen demand, chemical oxygen demand, nitrate, phosphate, silica and iron has been studied in the period of July 2005 to Jan 2006.The study shows that seasonal variation in the physico-chemical parameters. Key words: Physico chemical parameters, Khadakwasala reservoir, Seasonal Variation INTRODUCTION Water is an indispensable natural resource on earth. All life including human being depends on water. We have enormous resource on the earth amounting to about 1, 81, 6000 Km of water. Due to its unique properties water is of multiple uses for living organisms. In India % of water is used in agricultural sector (1). Human being depends on water for almost every developmental activity. Water is used for drinking, irrigation, washing, and Industrial purposes. Although water is very abundant on this earth, yet it is very precious. Out of the total water reserves of the world, about % is salty water and only % is fresh water. Even this small fraction of fresh water is not available to us as most of it is locked up in polar ice caps and just 0.00% is readily available to us in the form of ground water and surface water. (2) The fresh water resources now a day as consequences of population explosion coupled with industrialization, urbanization, and green revolution. In present investigation an attempt has been made to study the impact of human activities on the surface water at Khadakwasala reservoir. Khadakwasala reservoir was designed by M. Visveshwariah in the 18, about hundred years back. The huge demand of drinking water of Pune metropolitan has been fulfilled by this reservoir every day. Due to the availability of onsite water for various purposes like drinking, agriculture and industrial, various villages are developed on the both bank of reservoir (). Due to the various agricultural as well as domestic activities, large numbers of pollutants are discharged every day in the reservoir. The Khadakwasala reservoir is one of the famous tourist s spots in Maharashtra. Tourist s activity is also contaminating the water on large scale. The population depend on this reservoir is about 8 Lakhs.The rain fall observed in the period of monsoon is 2.2 mm while in post monsoon it is observed 6.1 mm. The catchments area of dam is km 2.The domestic use of water from reservoir is large like bathing, washing of cloths, cattle bathing, and leads to water pollution of the reservoir. For high crop yield production farmers use fertilizers, pesticides that along with rain water runoff come into the reservoir. Many hotels located along side of reservoir and from these hotels kitchen waste is also discharge in reservoir. EXPERIMENTAL The water samples were collected from eight different sites of Khadakwasala reservoir from the adjacent localities.. Samples were collected in sterilized screw-capped polyethylene bottles ()
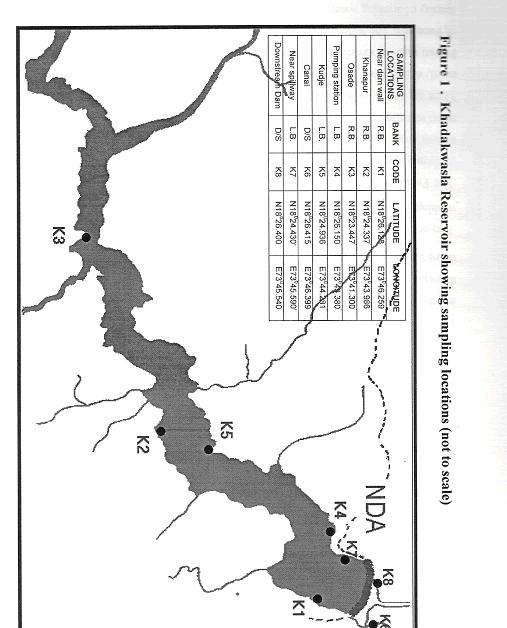
2 having one-liter capacity, labeled properly and analyzed in laboratory for their physico-chemical parameters. Monitoring was done during July 2005 to Jan The sampling sites are (Fig.1) near dam wall (K 1 ), Khanapur (K 2 ), Osade (K ), Pumping station (K ), Kudje (K 5 ), Canal (K 6 ) and near Spillway (K ), Down stream dam (K 8 ).. The unstable parameters such as ph, temperature, electric conductivity, and dissolved oxygen were measured in situ using sensor of water quality monitor (WQM; In-Situ Inc; Multi parameter Toll 000). Parameters like sodium, calcium, magnesium, carbonate and bicarbonate, chloride, Sulphate, biochemical oxygen demand, chemical oxygen demand, nitrate, phosphate, silica and iron were analyzed according to the standard methods prescribed in literature. (5-8). The results obtained are reported in table 1. RESULT AND DISCUSSION The results of analysis summarized in table no. 1. During the study period, the temperature of entire reservoir ranges between C (winter) to C (post- monsoon). The ph of water was varying from 6.5 to 8.60 during the entire study period.. The discharge from resorts and small industries may increase the ph of water, where as, in monsoon, addition of rainwater diluted the effect and resulting on ph value. The electric conductivity of the water sample was observed high in monsoon than in post-monsoon and winter. It is varied between 6.1 μs/cm (post-monsoon) to 1.μS/cm (monsoon). During monsoon the silt carried through runoff, got mixed into the water. This may be the reason for the increase in electric conductivity value in monsoon. In post-monsoon and winter, values of electric conductivity decreases. The sodium concentration in the water varied from.50 mg/l to.80 mg/l through out the study period. The minimum quantity of sodium was observed in winter and maximum was in monsoon. It is due to that, during monsoon, runoff carrying domestic sewage, agricultural wastes, increased amount of sodium. The value of potassium ranges between 0.0 mg/l to 0.80 mg/l. The minimum value was observed in winter and maximum value observed post monsoon and monsoon. The calcium hardness of entire samples ranges between.2 mg/l to mg/l. The minimum values shown in winter and maximum in monsoon. The magnesium concentration varied between 0. mg/l to.1 mg/l. In post monsoon it was observed minimum and in monsoon it was maximum. The bicarbonate concentration varied between 2.82 mg/l to.0 mg/l. In monsoon bicarbonate concentration was observed to maximum value and in post monsoon showed minimum value. In the study, the values of chloride were ranging between.2 mg/l to 12. mg/l. The higher chloride value observed in monsoon season while in winter season it was observed less. In the present study Sulphate concentration varied between 0.15 mg/l to 6.1 mg/l. The minimum as well as maximum value was observed in winter. During the study period dissolved oxygen varied between.26 mg/l to. mg/l. Among the all values it was observed minimum in begging of post monsoon and maximum in off set of post monsoon. The biochemical oxygen demand values ranges between 0.16 mg/l to.2 mg/l. Monsoon season shows higher value and winter shown less value of BOD. Chemical oxygen demand showed much variation. It ranges between 1.56 mg/l to 18.2 mg/l. The winter season showed minimum values of chemical oxygen demand were as post monsoon showed maximum value of chemical oxygen demand. The nitrate values varied between 0.2 mg/l to 1.55 mg/l. Post monsoon showed the maximum value of nitrate where as minimum value observed in winter season. Phosphate value were nil at beginning of monsoon whereas post monsoon showed a maximum value of 0. mg/l. During the monsoon, precipitation eroded the land containing fertilizer got mixed to water, may contribute the increased level of phosphate. The silica value
3 ranges between 0.1 mg/l to 1.8 mg/l. The iron concentration varied between 0.0 mg/l to 1.5 mg/l. The iron concentration at some sites crossing the permissible limit i.e, 1.0 ppm (8). The iron concentration of water during beginning of monsoon was observed minimum, were as winter value are maximum. ACKNOWLEDGEMENT The authors are thankful to management Pravara Rural Education Society and Principal P.V. P. College Pravaranagar for providing necessary facilities in department. REFERENCES 1. P.K.Goyal, 16 Water Pollution Causes Effect and Control, New Age International Publication, New Delhi 2. A. Kaushik and C. P. Kaushik Perspective in Environmental Studies, New Age International Publishers. Second Edition. P. 1, 15 (2006).. S. D.Muduli. (Et.al), Poll. Res. 25(): P. 6,66 (2006).. V. P Kudesia,. Water Pollution Pragati Prakashan. Meerut (185). 5. APHA (American Public Health Association 1 th Edition) (18). 6. D.B. Botkin, and Keller, Water Pollution and Treament, John Wiley and Sons, Inc New York-Chichester, E.A. Brisbane, Tronto Singapore,. In Environmental Science Earth as a living planet p.8, 20(15).. R.K Trivedy,. and P.K Goel, Chemical and Biological Methods for Water Pollution Studies. Environmental publication, Karad, India (18). 8. WHO Guidelines for Drinking Water Quality Vol.2. Health Criteria and other supporting information. Genava. Mecmillan/Eeuteric-8000 (18). (Received: 8 October 200 Accepted: 10 January 2008 RJC-11) Table No. 1: Average values of seasonal variation in water quality parameters (physico-chemical) at different sampling location of Khadakwasala reservoir. Param eter Seaso n K1 K2 K K K5 K6 K K8 Min. MAX. Temp. M C P.M W S.P ph M P.M W S.P EC M μs/cm P.M W S.P Na M mg/l P.M W S.P K M
4 mg/l P.M W S.P Ca M mg/l P.M W S.P Mg M mg/l P.M W S.P HCO M mg/l P.M W S.P Cl M mg/l P.M W S.P SO M mg/l P.M W S.P DO M mg/l P.M W S.P BOD M mg/l P.M W S.P COD M mg/l P.M W S.P NO M mg/l P.M W S.P PO M mg/l P.M W S.P SiO 2 M mg/l P.M W S.P Fe M mg/l P.M W S.P M- Monsoon, PM- Post-monsoon, W- Winter, S.P.-Study period.
5