AGOG 485/585 APLN 533 Spring 2019
|
|
|
- Georgiana Williams
- 5 years ago
- Views:
Transcription


1 AGOG 485/585 APLN 533 Spring 2019
2 Outline Vegetation analysis and related MODIS products Phenology and productivity Fire monitoring using MODIS and VIIRS data Readings: Textbook Chapter 17 FAQ on Vegetation in Remote Sensing by Terrill Ray
3 Photosynthesis Photosynthesis is the energy-storing process that takes place in green components of plants (chloroplast) in the presence of light. The light energy is stored in a simple sugar molecule (glucose) that is produced from carbon dioxide (present in the air) and water (absorbed through the root system). 6CO 2 + 6H 2 O + Light Energy = C 6 H 12 O 6 + 6O 2

4 Leaf structure


5 Absorption spectra of main pigments Chlorophyll a peak absorption is at 0.43 and 0.66 mm. Chlorophyll b peak absorption is at 0.45 and 0.65 mm. Optimum chlorophyll absorption windows are: mm and mm Jensen, 2000
6 Jensen, 2000 Water absorption bands: 0.97 mm 1.19 mm 1.45 mm 1.94 mm 2.70 mm
7 Factors Controlling Interaction Between Electromagnetic Energy and Vegetation Leaf pigments in the palisade parenchyma and spongy mesophyll cells result in absorption of red visible light Internal scattering in the spongy parenchyma mesophyll layer in the Near Infrared (NIR) Leaf water content in the spongy parenchyma mesophyll cells results in Shortwave Infrared (SWIR) energy absorption by leaf water.


8 UAS-acquired natural color photos DiCaprio park, Guilderland October 12, 2015 DiCaprio park, Guilderland November 5, 2015

9 Spectral Reflectance of Sweetgum Leaves (Liquidambar styraciflua L.) Jensen, 2000
10 Reflectance Characteristics of Vegetation Green Vegetation Chlorophyll absorption Cellular scattering Water absorption
11 Reflectance Characteristics of Vegetation Dry Vegetation Cellulose Chlorophyll absorption Cellular scattering Water absorption
12 MODIS vegetation indices (MOD13/MYD13) The goal of the Earth Observing System (EOS) program is to understand how the Earth functions as a system One of the primary interests within the overarching goal is to study the role of terrestrial vegetation in broadscale global processes. Vegetation indices are used to understand the global distribution of vegetation types as well as their biophysical and structural properties and spatial/temporal variations.
13 MODIS vegetation indices (M*D13) Vegetation Indices are most useful as: Radiometric measures of the amount, structure, and condition of vegetation Indicators of seasonal and inter-annual variations in vegetation Proxy for biophysical vegetation parameters: Fraction of vegetation cover (%) Fraction of Photosynthetically Active Radiation (FPAR) Leaf area index (m 2 /m 2 ) Biomass (g C/m 2 ) and Net Primary Productivity, NPP (g C/m 2 year)
 sensors")

14 Leaf-Area-Index (LAI) Measurement using Ceptometer LAI may be computed using a Decagon Accupar Ceptometer that consists of a linear array of 80 adjacent 1 cm 2 photosynthetically active radiation (PAR) sensors along the bar Incident sunlight above the canopy, Q a, and the amount of direct solar energy incident to the ceptometer, Q b, when it was laid at the bottom of the canopy directly on the mud is used to compute LAI.
15 Simple Ratio (infrared/red) vegetation index SR NIR RED NIR nearinfrared band; RED red band First vegetation index Takes advantage of the inverse relationship between chlorophyll absorption of red radiant energy and increased reflectance of nearinfrared energy for healthy plant canopies (Cohen, 1991)


16 NIR GREEN A typical feature space of Landsat TM data Soil line RED BLUE
17 Normalized Difference Vegetation Index -1 NDVI 1 Indicates amount of vegetation; distinguishes vegetation from soil; minimizes topographic effects Good index = easy to implement and understand Major problems: NDVI NIR NIR RED RED Low sensitivity over thick, multi-layered, forest canopies Sensitive to soil background noise. Most severe at intermediate levels of vegetation (40-60% cover)
18 Soil-Adjusted Vegetation Index (SAVI) SAVI NIR NIR RED RED L ( 1 L) where L is the correction factor, slope of the soil line (usually 0.5)
19 Atmospherically Resistant Vegetation Index (ARVI) ARVI NIR NIR (( RED (( RED *( RED *( RED BLUE)) BLUE)) where BLUE is the blue band and = 1
20 Enhanced Vegetation Index (EVI) An optimized version of NDVI with a set of coefficients added to improve the extraction of vegetation signal EVI G NIR RED * RED C * ( NIR C1 2 BLUE L) (1 L) where C1 (=6) and C2 (=7.5) are coefficients of the aerosol resistance term, which uses the blue band to correct for aerosol influences in the red band. G (=2.5) is the gain factor. L = 1
21 Enhanced Vegetation Index (EVI) NDVI SAVI Canopy background (soil) correction Atmospheric resistance ARVI EVI
22 Short Product Name Platform MODIS Data Product Raster type Resolution (m) MOD13Q1 Terra VI Tile 250m 16 day Temporal Granularity MYD13C2 Aqua VI CMG 5600m Monthly MOD13C2 Terra VI CMG 5600m Monthly MYD13C1 Aqua VI CMG 5600m 16 day MOD13C1 Terra VI CMG 5600m 16 day MYD13A3 Aqua VI Tile 1000m Monthly MOD13A3 Terra VI Tile 1000m Monthly MYD13Q1 Aqua VI Tile 250m 16 day MYD13A2 Aqua VI Tile 1000m 16 day MOD13A2 Terra VI Tile 1000m 16 day MYD13A1 Aqua VI Tile 500m 16 day MOD13A1 Terra VI Tile 500m 16 day

23 Phenology Cycles of crops in the Imperial Valley

24 NDVI/EVI seasonality analysis - Phenology A start B end C left 80% level D right 80% level E growth peak F amplitude G length of season H growing period integral Rate of growth = ratio of A and C / T Rate of senescence = ratio of D and B / T

25 Global NDVI from MODIS
26 NDVI temporal dynamics for several representative land cover types in and around Phoenix, AZ


27 NDVI EVI EVI shows better dynamic range, less saturation


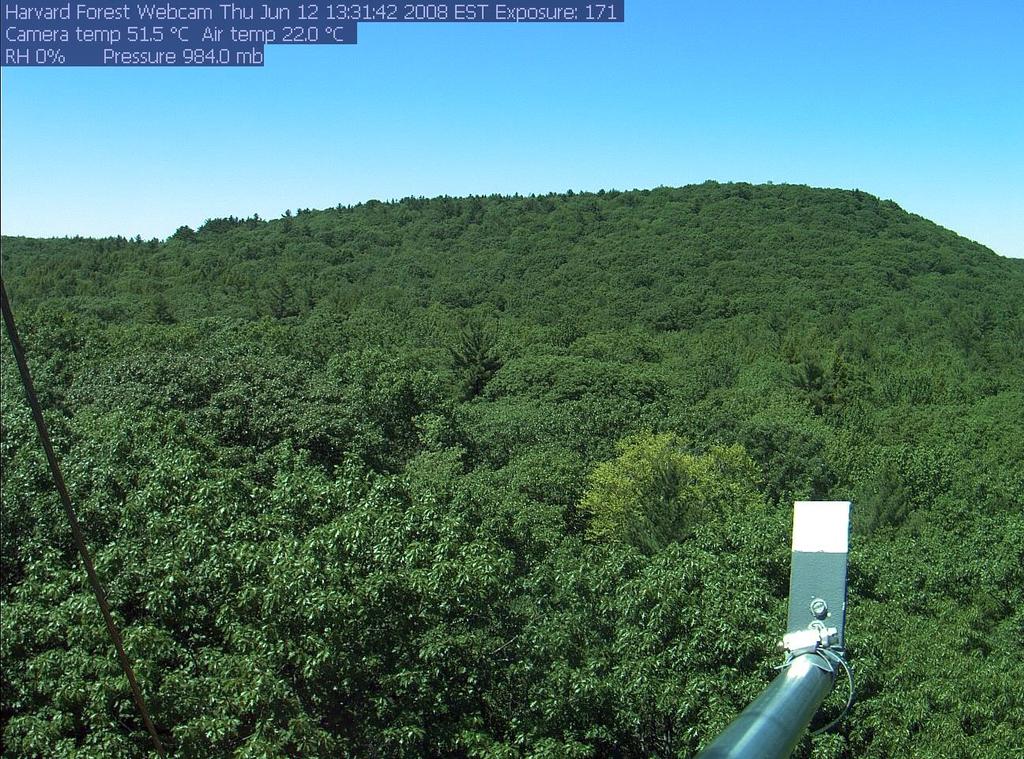
28 Vegetation Dynamics: Refinement & Validation Webcam Monitoring of Phenology Supports model development Error characterization and validation


29
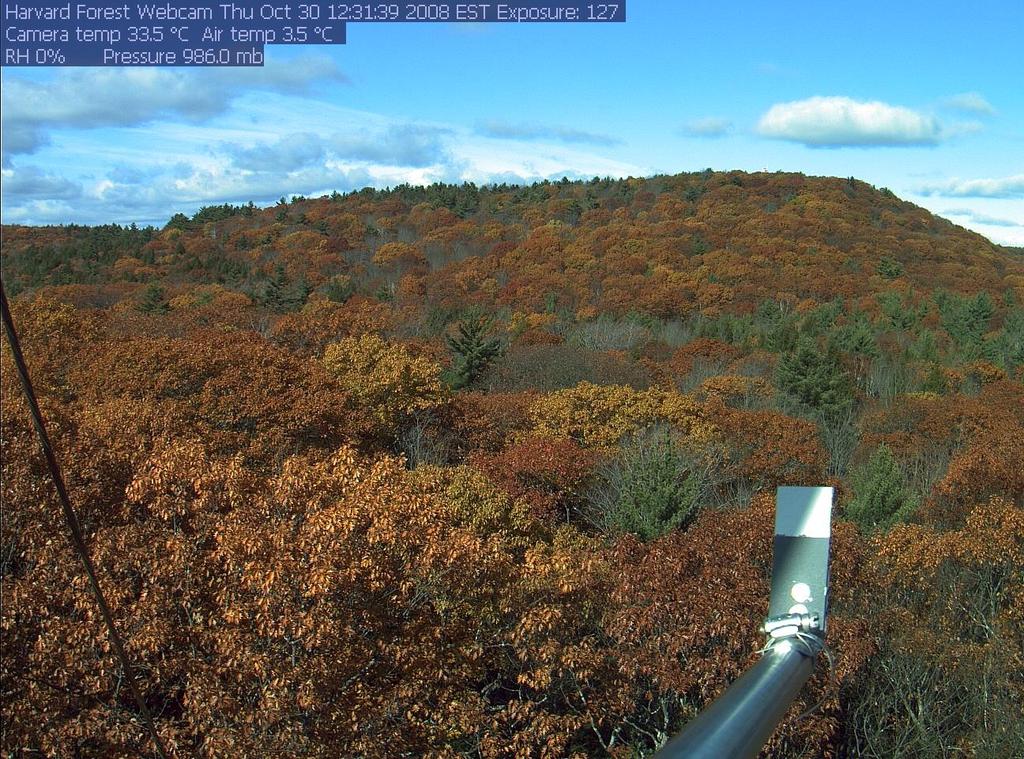
 to quantify phenological dynamics Richardson et al.")
30 PhenoCam Vegetation Indices Image analysis (RGB channel extraction) to quantify phenological dynamics Richardson et al., 2007, 2009
31 Phenocam vs MODIS (Mammoth Cave, KY) Clear phenology, modest noise level, strong covariance with MODIS


32 RedEdge camera by Micasense

33 Vegetation indices

 Active Fire")
34 MODIS Active Fire and Burned Area (MOD14 / MYD14) and the VIIRS (VNP14IMGT) Active Fire Products

35 Fires Biomass burning is estimated to contribute about: 38% of the tropospheric ozone (O3) 32% of the global carbon monoxide (CO) 10% of the global CH4 > 20% of the global H2, non-methane hydrocarbons, CH3Cl, CH3Br, and NOx 39% of the particulate organic carbon
36 Fire monitoring using satellites The increasing concentrations of greenhouse gases, produced by biomass burning, among other sources, provide one of the clearest manifestations of global change in the atmosphere. Fire is a complex biophysical process with multiple direct and indirect effects on the atmosphere, the biosphere, and the hydrosphere It is widely recognized that in some fire prone areas, fire disturbance is essential for maintaining the local ecosystems
37 Fire monitoring using satellites Active fire mapping on a global scale using a single satellite system was first coordinated by the IGBP using AVHRR data for In addition, Brazil, Russia and Senegal have developed their own regional AVHRR satellite fire monitoring systems using direct readout.
38 Purposes for developing MODIS fire and Thermal Anomalies Products MOD14, MYD14, MCD14DL Provide global change researchers with global timeseries of fire data. These products are aimed at supporting the modeling of trace gas and particle emissions. Vegetation burning is recognized as an important contributor to global climate change because of its potential to modify atmospheric composition and chemistry.

39 MODIS Rapid Response Project (Jacques Descloitres/SSAI)
40 MODIS methodology for detecting fires Fire detection is performed using a contextual algorithm that exploits the strong emission of midinfrared radiation from fires. MODIS fire products use the 1-km channels at 3.96 μm (bands 21 and 22) and 11 μm (band 31). Band 32 (at 12 μm) is used for cloud masking Fire observations are made four times a day from the Terra AM (10:30 and 22:30) and Aqua PM (13:30 and 1:30) platforms.
41 MODIS methodology for detecting fires Values in potential fire pixels are compared to neighboring pixels to get a background characterization. Relative thresholds are adjusted based on the natural variability of the background. For each fire pixel detected, the Fire Radiative Power (FPR) within the pixel is estimated using an empirical relationship: FRP=( MWK 8 km 2 )(T 8 4 T 4 )A pix
42 MODIS methodology for detecting fires FRP=( MWK 8 km 2 )(T 8 4 T 4 )A pix T 4 = 4-µm brightness temperature of the fire pixel T 4 = the mean 4-µm brightness temperature of the non-fire background A pix = total area of the pixel The resulting value of FRP is expressed in MW
43 MODIS methodology for detecting fires

44 MODIS fire validation Approximately 2500 ASTER scenes (60 x 60km each) were used to assess the performance of the MOD14 product globally. 50% detection probability is achieved for fires clusters composed of at least 25 30x30m ASTER active fire pixels Probability of detection of MOD14 is up to 10% higher for densely vegetated areas compared to sparsely vegetated areas.
45 What is VIIRS? Visible Infrared Imaging Radiometer Suite (VIIRS) sensor aboard the Suomi-National Polar-orbiting Partnership (S-NPP) satellite launched in 2011 and the NOAA20 satellite launched in 2017 The instrument collects data at 375-m and 750-m spatial resolutions VIIRS crosses the equator at approximately 13:30 PM (ascending node) and 1:30 AM (descending node) It has 5 high resolution Imagery channels (I-bands), 16 moderate resolution channels (M-bands) and a Day/Night Band (DNB)

46 NASA MODIS/VIIRS Fire Rapid Response Data System and FIRMS (Fire Information for Resource Management System)