Sustainable Practices for the Management of Organic Matter
|
|
|
- Meryl Harris
- 5 years ago
- Views:
Transcription
1 8 th Annual Forum of the California Biomass Collaborative Biomass Energy in California: Where Do We Stand? Davis, California, April 5 and 6, 2011 Sustainable Practices for the Management of Organic Matter L.F. Diaz and G.M. Savage CalRecovery, Inc. Concord, California USA ludiaz@calrecovery.com
2 Outline Introduction Waste management EU USA Global trends Summary
3 Introduction Diversion of solid waste from landfill disposal is being emphasized in many areas around the world Motivations are similar in most of the areas: Protection of public health Environmental protection (water, soil, etc.) Resource conservation In this presentation we will discuss approaches in: European Union USA (California)
4 Waste Management
5 Generation and Characteristics of MSW Type of Country Avg. Generation (kg/capday) Paper & Plastics (%) Concentration of Organic Matter (%) Moisture Content (%) Industrialized to to to 30 Developing - Middle Income to to to 60 -Low Income to to to 80
6 Changes in Composition of MSW as a Function of Time in the UK 60 Composition (wt %) Time (years) Dust/Screenings Putrescibles Paper Glass Plastic
7 Historical Changes in Solid Waste Bulk Density in the UK Density (kg/m3) Time (year)
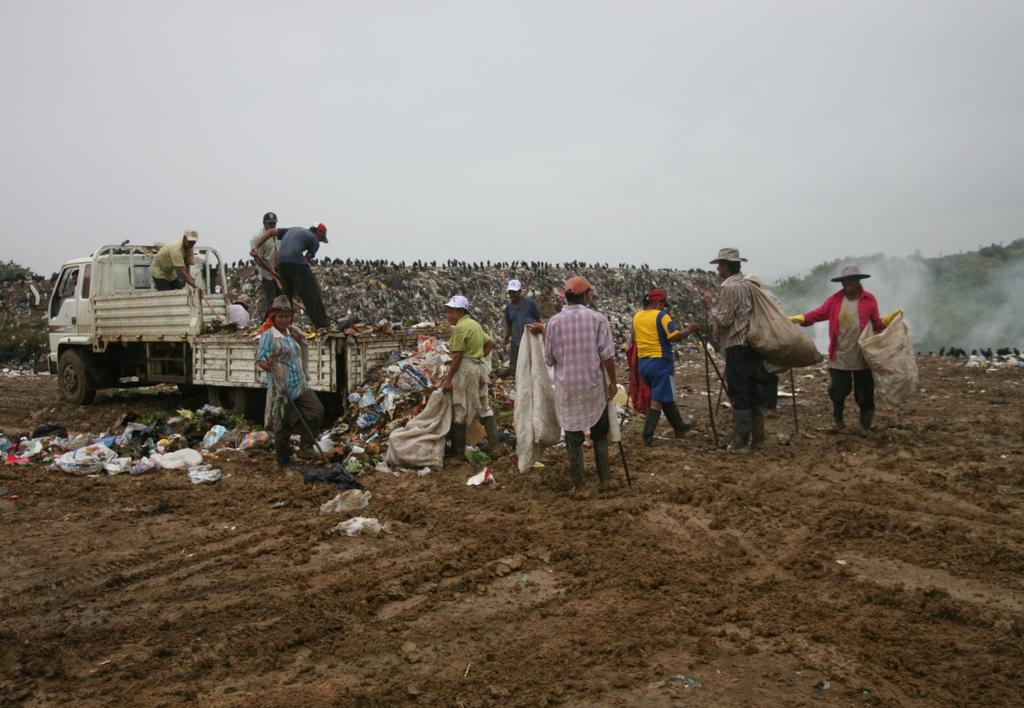
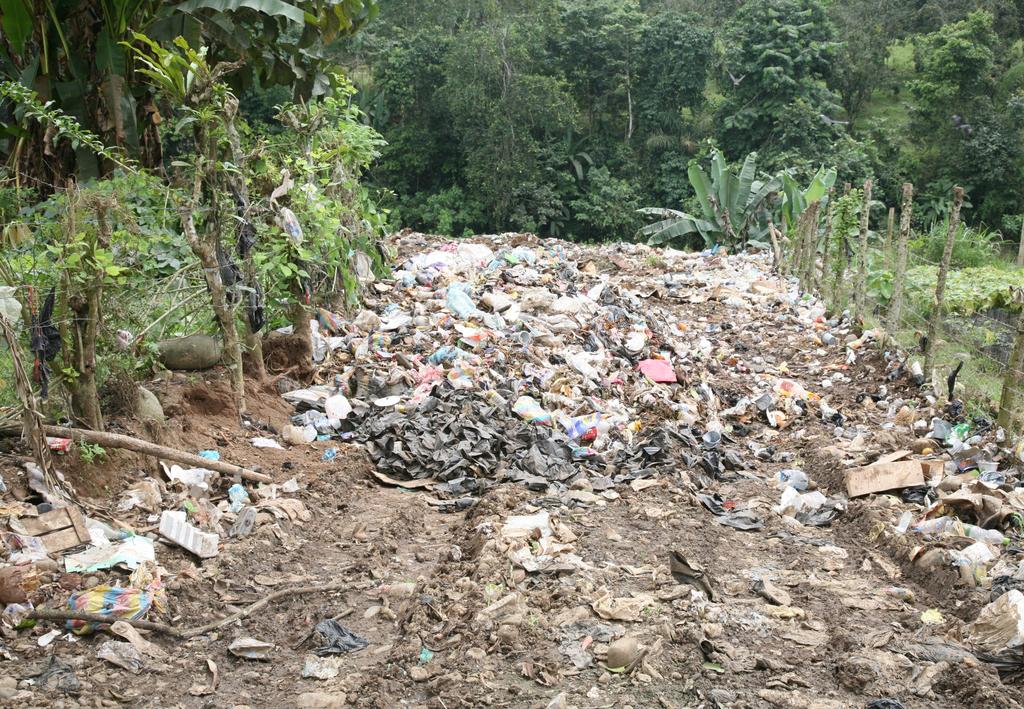
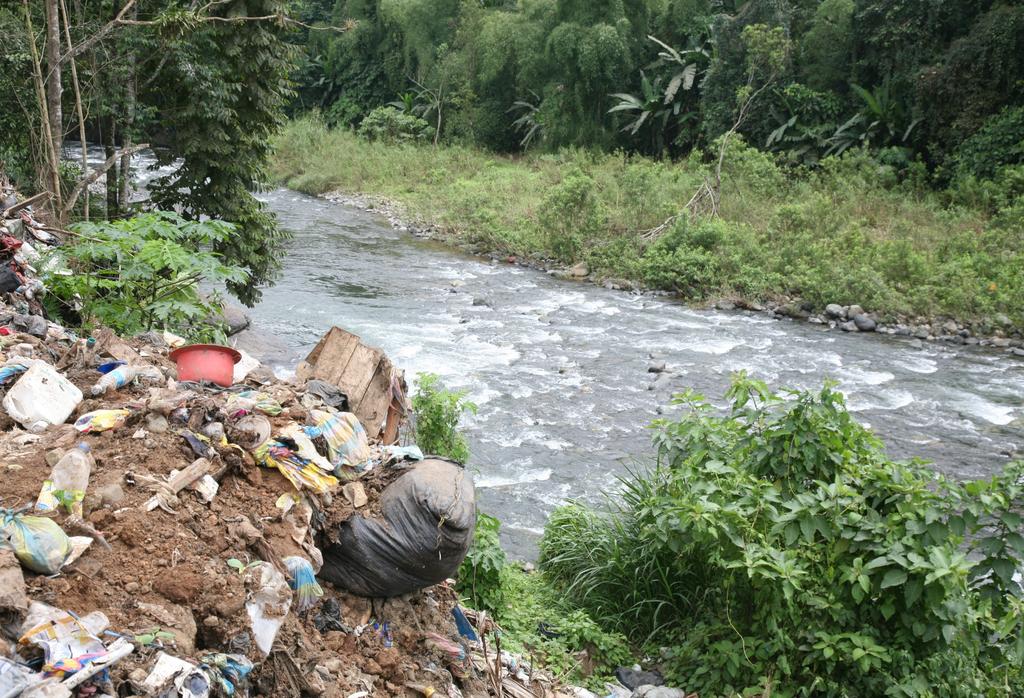
8 Management of MSW Industrialized: source reduction, material recovery, energy recovery and sanitary landfilling Industrializing Middle income: limited formal material and energy recovery and some sanitary landfilling Low income: relatively high informal material recovery and mostly open dumps
9 Schematic Diagram of Conventional Wastewater Treatment Wastewater Water ~ 99.9 % Gases: CO 2, CH 4, N 2 Solids ~ 0.1 % + Microorganisms Contamination Treatment Biosolids
10 Leachate formation in Landfills Water from above Moisture in cover material Moisture in waste Water out Leachate
11 Schematic Diagram of a Sanitary Landfill Gases: CO 2, CH 4, N 2 Solid waste ~ 50 % water Rain water + Run-off Degradation, compression Leachate Water ~ 95 % Gases: CO 2, CH 4, N 2 Solids ~ 5 % + Microorganisms Contamination Treatment Solids
12 EU Increasing Diversion Levels Importance of proper management of biodegradable residues Impact of biowaste in landfills Introduction of several legislative initiatives in European countries Effects of legislation on requirements for pre-treating MSW
13 Development of Legislation in the EU Limited legislation specifically dealing with the management of biowaste Primary legislation: directive dealing with sewage sludge directive covering animal waste processing and disposal landfill directive impacts biological treatment of biowaste proposed animal by-products health rules
14 Landfill Directive Became effective July 1999 First directive to define biodegradable waste Sets targets for diversion from landfills Exceptions for countries that landfilled at least 80% of MSW in 1995
15 Targets of Landfill Directive Targets of Landfill Directive % % of Bio waste Produced in 1995 that can be placed in a landfill 2016 Reference Year % % 35 % Year
16 Landfill Directive (cont.) Requires treatment of any waste with potential negative impacts to health, environment Residual waste (MSW minus recyclables and biowaste) has potential of negative impact Requires full cost accounting for landfilling, including closure and aftercare for at least 30 years
17 Biological Treatment of Biowaste Working document at this time Deals with biological processing Establishes several guidelines
18 Technology Most commonly used processes to treat biowaste and meet EU requirements: combinations of biological processes anaerobic digestion and composting Increases in plant capacity in EU from 1990 to 2000: compost: from 2 million to about 16 million tons A/D: from 0.1 million to about 1.0 million
19 Composting in Germany Potential: million tons Biological waste treatment: 1999: 594 plants; 8.4 million tons throughput 2001: 700 to 900 installations
20 Three-bin system in Germany Organics Recyclables Residual waste % % % kg/cap-week kg/cap-week Impurities: Average 8% kg/cap-week
21 Composting Systems Types of systems used: aerated static pile aerated pile with mechanical turning container systems Approximately 70% of the organic fraction of MSW in Germany is composted in reactor systems
22 Anaerobic Digestion Systems Systems used: high-solids (20% to 40% TS) low-solids (3% to 15% TS) Systems operating at high-solids have reported fewer problems than systems operating at low-solids

23 Rennerod, Germany

24 Rennerod Unloading of Feedstock

25 Rennerod Loading of Treatment Unit

26 Rennerod Biotreatment Process

27 Rennerod Water Purification

28 Rennerod Emission Control

29 Poessneck - Interior of Composting Unit
30 USA Increasing Diversion Levels Approaches vary from state-to-state California legislation: AB 2020 (1986) redemption values on beverage containers AB 939 (1989) mandated diversion goals SB 1322 (1989) programs to improve markets for recyclable materials AB 2076 (1991) - used oil recycling program
31 California Diversion Goals/Levels AB 939 mandated 50% diversion by 2000 for every jurisdiction some cities have established higher diversion goals Diversion in California has increased steadily: % % % % In 2000, almost one-half of the jurisdictions had met the 50% goal
32 California Reaching 50% Diversion Multi-faceted programs: Generator types Materials Approaches Involving private recyclers Public education Economic motivation

33 Example: Residential Curbside Collection

34 Example: Residential Curbside Collection
35 California Going Beyond 50% Diversion Improving/expanding existing programs Residential and commercial Introducing new programs, e.g.: C&D Food waste Providing proper incentives to the collection service provider and processor


36 Example: C&D Debris Processing Operations


37 Example: C&D Debris Processing Operations
38 Food Waste Characteristics of food waste: Can represent 5% to 20% of residential waste Highly putrescible, high moisture content Storage/collection presents challenges: Potential for foul odors Requires watertight containment Difficulty in segregating (esp. commercial)

39 Example: Food Waste Composting Operation
40 Global Trends that Drive Use of Resources Rapid population growth High level of resource and energy use in industrialized countries Very large industrialization in large emerging economies (BRIC) Increasing affluence, high levels of consumption, and Relative ease of global trade
41 Consequences of Global Trends Climate change due to combustion of fossil fuels Loss of biodiversity and ecosystems Loss of fertile land Growing quantities of waste generation
42 Use of material resources In EU-27 average use of material resources is about 16 tons/person-year. Most end up as material accumulated in economy, the rest converted into emissions or waste average total waste generation about 6 tons/person year (16 kg/person-day). MSW is about 1.4 kg/person-day)
43 Trade Balance between EU-27 and Rest of World From EU to Rest of World 1999: 397 million tons 2008: 536 million tons From Rest of World to EU 1999: 1,340 million tons 2008: 1,798 million tons (1,384 million tons fuels and mining products)
44 Decoupling Use of resources decoupled from economic growth May be due to increased imports substituting domestic production Not using less material resources but relying on those extracted and processed in other countries (1 ton of platinum leaves 400,000 tons of residue behind)
45 Motivating Service Providers Requires a shift from collect and dispose ethic to collect and divert ethic Basic approaches: Required performance - defined in scope of work Incentivize performance rewarded based on performance Motivation works well when compensation is very attractive to service providers when high levels of diversion are achieved
46 Motivating Service Providers Incentives (examples): Revenue from sale of recyclables Operating ratio/profit margin based on performance: Diversion rate Recovery rate Contamination levels Important considerations: Balancing risk and reward Provide incentives only in those activities in contractor s control Ability to fund incentives

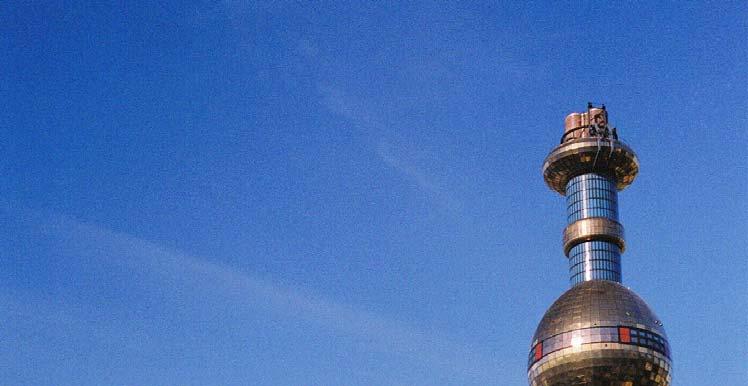
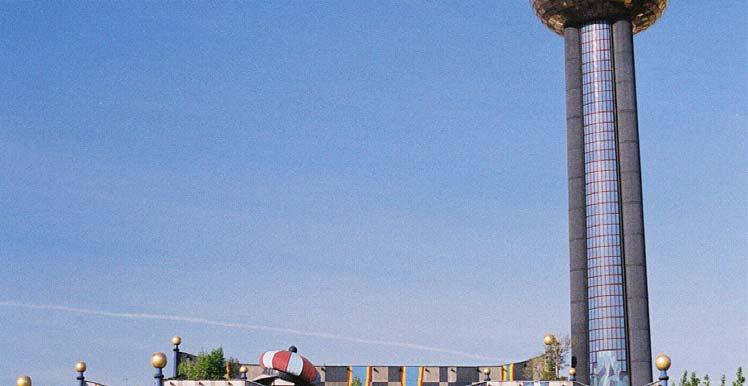
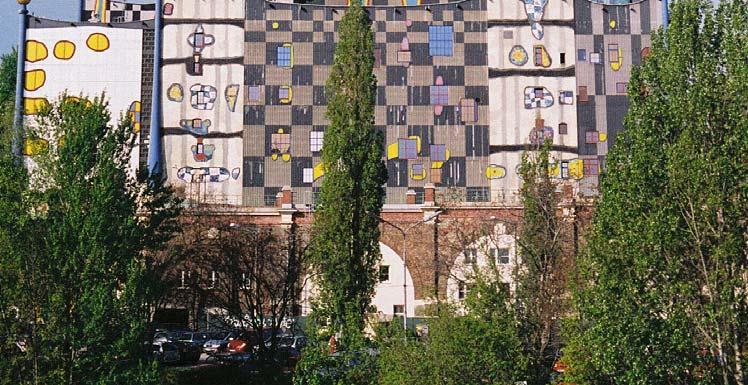
47 Incineration in the EU Spittelau Vienna, Austria Installation sited in the middle of urban area
48

49 Modern Incineration Plant in Sapporo, Japan
50
51
52
53 Summary European Union Landfill directive bans organic materials from being disposed in landfills Imposition of landfill taxes Generally enclosed, relatively high technology processing operations for organic materials and residual Relatively sophisticated policies, resources/waste DG Environment published a document in the Fall of 2010 for consultation on Sludge and Biowaste
54 Summary US / California AB 939 mandates diversion from landfill Several other pertinent bills have been passed (AB 32, SB 375, etc.) Generally open, low-to-medium technology processing operations for treatment of organic materials Industrializing countries Very few have national policies related to MSW, few sanitary landfills, many open dumps