Options to Approach Zero Waste: Management of Organic Residues
|
|
|
- Augustus Domenic Francis
- 5 years ago
- Views:
Transcription
1 Special Event ISWA 2011 World Congress Moving Towards Zero Waste for a Green Economy The Role of Local Authorities Daegu, Korea October 2011 Options to Approach Zero Waste: Management of Organic Residues L.F. Diaz and G. M. Savage CalRecovery, Inc. Concord, California USA ludiaz@calrecovery.com
2 Introduction Brief status General Alternatives Options for Management Organic Matter Conclusions Recommendations

3 Major issues currently facing us Global population rapidly growing and is expected to reach more than 9 billion by 2050; Emerging markets are becoming more affluent and demand a higher, resourceintensive quality of life
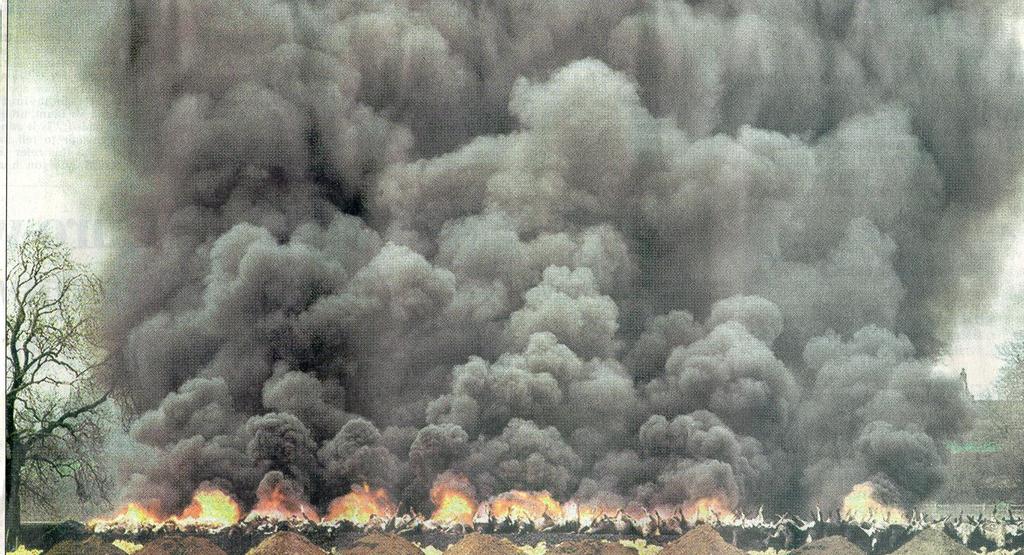
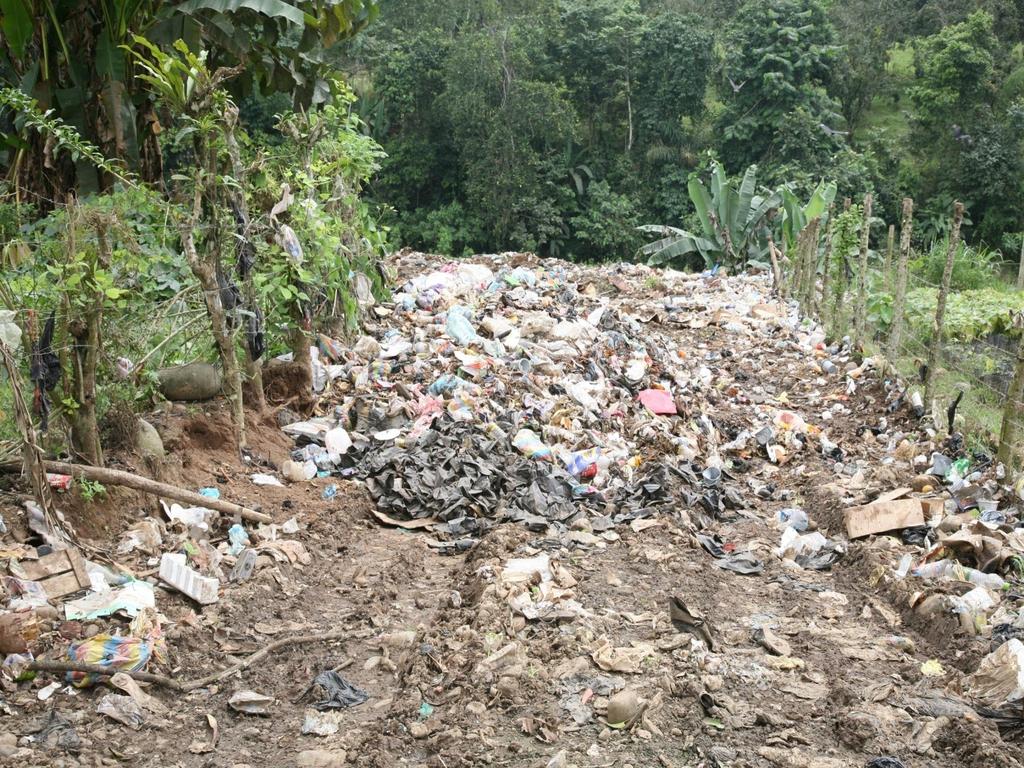
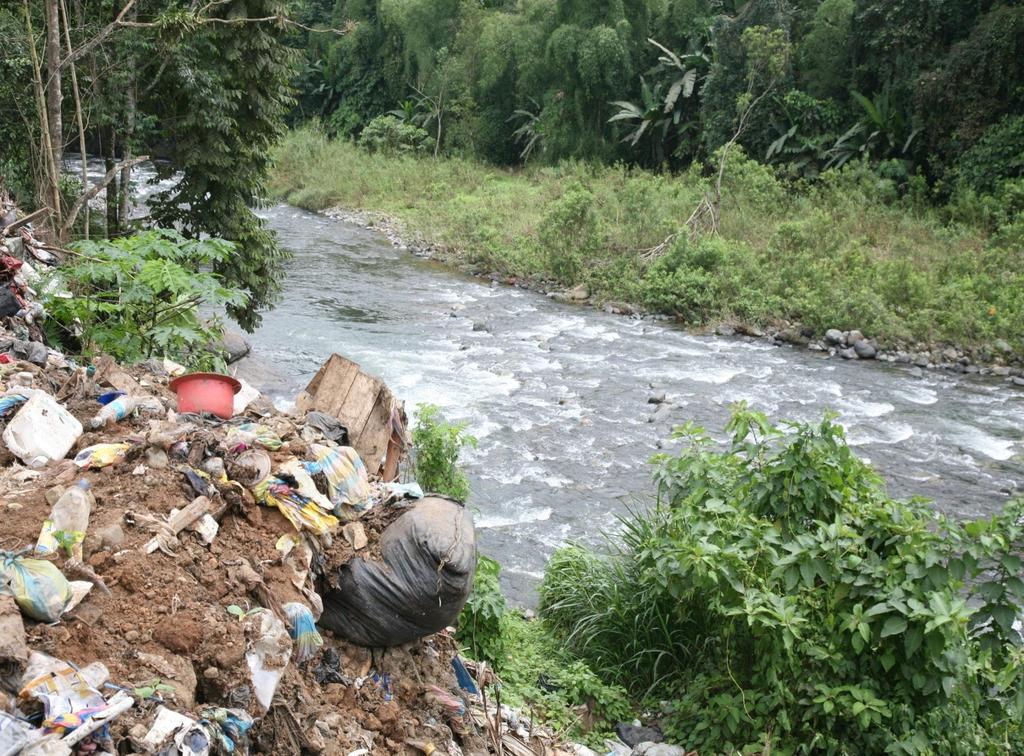
4 Major issues currently facing us Migration of people from rural to urban areas; Lack of sufficient food in some regions; Significant climatic events impacting agricultural productivity and the environment Improper final disposal of solid wastes


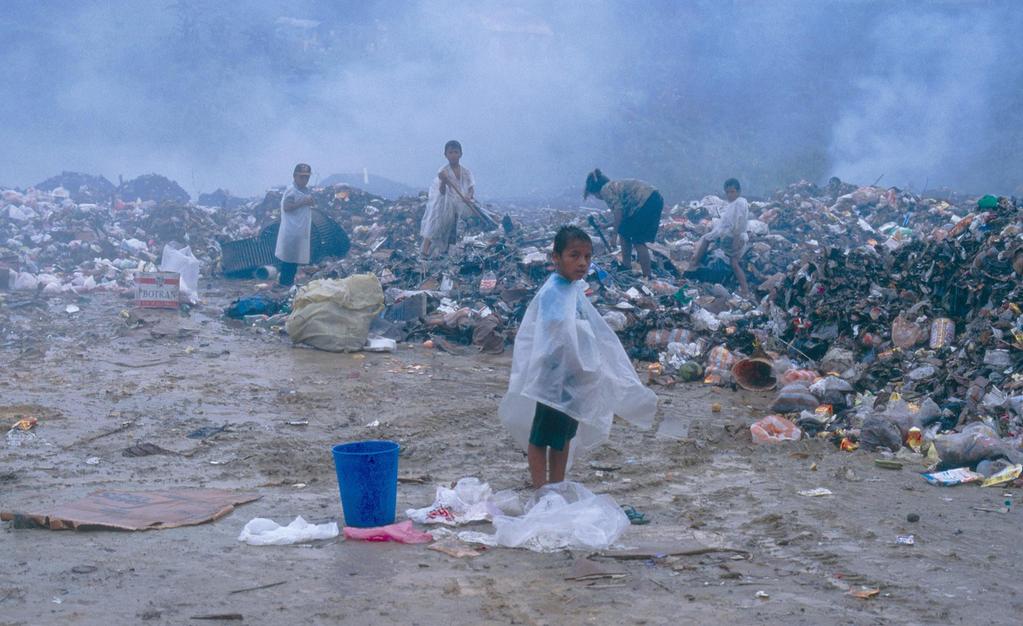
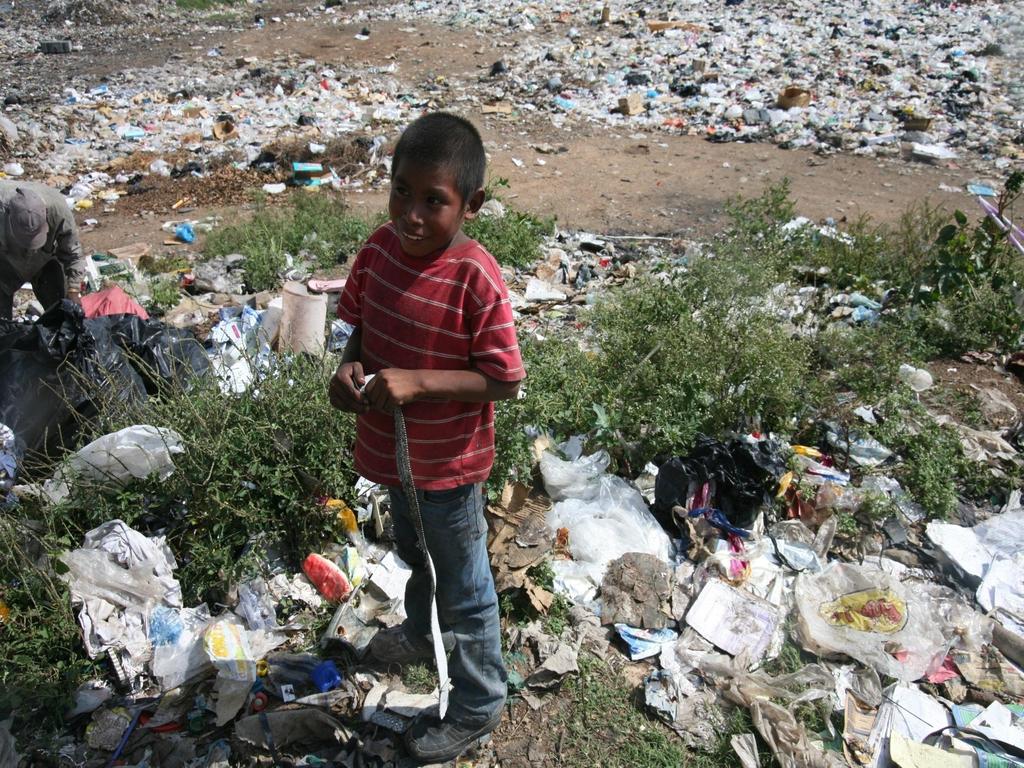
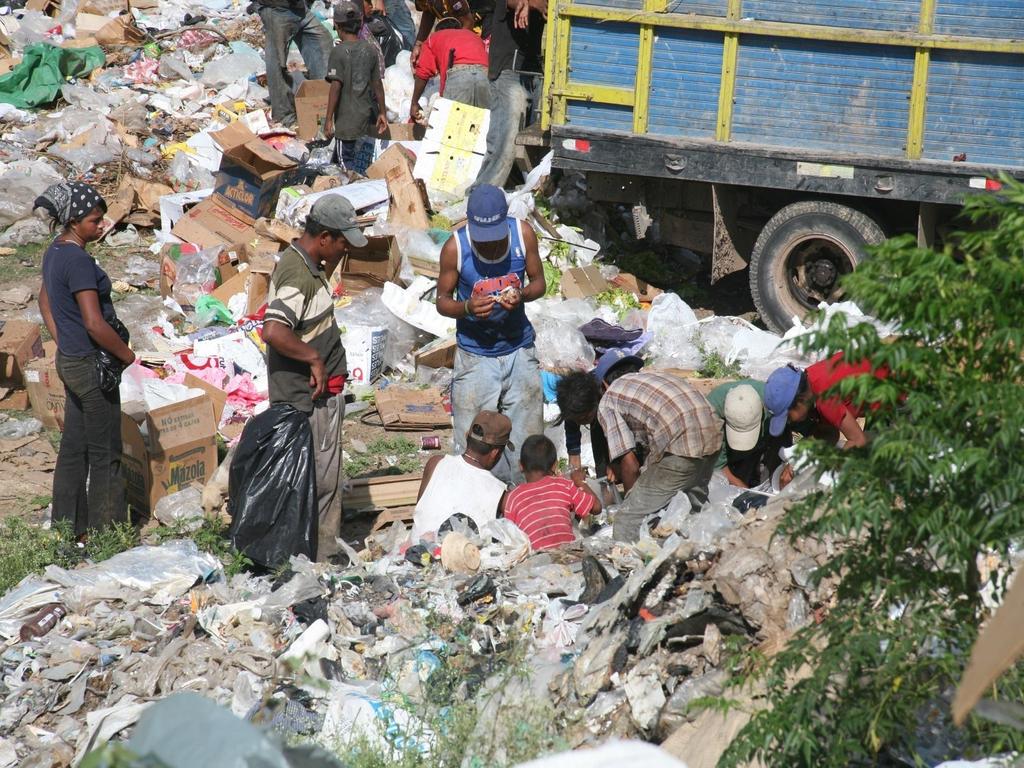
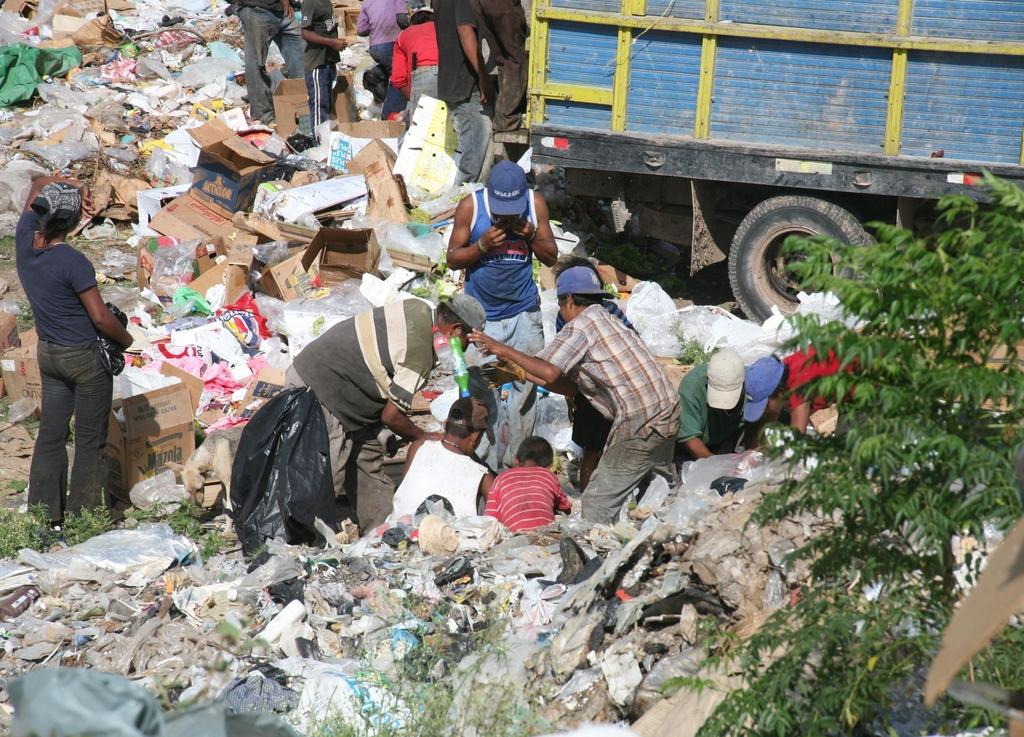
5 Situation in many economically developing countries
6
7
8
9
10 Need to Consider Global Impacts
11
12 Generation and Characteristics of MSW Type of Country Avg. Generation (kg/capday) Paper & Plastics (%) Concentration of Organic Matter (%) Moisture Content (%) Industrialized to to to 30 Developing - Middle Income to to to 60 - Low Income to to to 80
13 Key Characteristics of MSW in Industrialized Countries High concentration of paper and plastics Low volumetric density Low moisture content

14 Key Characteristics of MSW in Economically Developing Countries High concentration of organic matter Relatively high volumetric density High moisture content
15 Primary Management Options for Biomass Thermal treatment Land application Biological treatment Composting Anaerobic digestion
16 Comparison of the Thermal Characteristics of MSW with Those Required for Auto-Combustion Ash (%) Moisture Content (%) Volatile Solids (%) Area for auto-combustion Typical values in industrialized countries Typical values in developing countries

17 Leachate formation in Landfills Moisture in cover material Water from above Moisture in waste Liquid out Leachate

18 Schematic Diagram of a Sanitary Landfill Gases: CO 2, CH 4, N 2 Degradation, compression Solid waste ~ 50 % water Rain water + Run-off Leachate Water ~ 95 % Gases: CO 2, CH 4, N 2 Solids ~ 5 % + Microorganisms Contamination Treatment Solids
19
20
21 Potential Options to Increase Organics Diversion System options relevant to this presentation include: composting anaerobic digestion and composting
22 The Place of Composting in a Community System Community as a whole: community support systems waste management composting of organic materials and compost production
23 Full Scale Composting Objective: Reliable, cost-efficient production of quality compost and replish organic matter in the soil Pre-processing/feedstock preparation Composting Refinement of finished product (postprocessing) Compost application
24 Potential Options to Increase Organics Diversion (cont.) Sources of organics/increased diversion: residential (e.g., food waste and yard waste, 5% to 35% of sector) commercial/institutional (e.g., restaurant and market wastes, landscaping waste, 5% to 20% of sector) industrial/c&d (e.g., wood waste)
25 Main Driver in Europe EC Landfill Directive Stringent requirements for construction and management of landfills (e.g. liners) Requirement for pre-treatment of organic waste before landfilling Obligation: Reduce emissions from landfills by diverting biodegradable components in municipal waste that goes to landfills by - 25% by % by 2016 (based on 1995 disposal figures)


26 Composting in Europe (2005) Degradation of source-separated waste from households, gardens and industries Approximately 2,000 facilities - 40% treat only garden waste Annual capacity -> 18 million tons (11 M biowaste, 7 M greenwaste) About 800 small on-farm co-composting plants Target: production of a MATERIAL for market as organic fertilizers and soil amendments
27 Main Drivers in USA Some states require fixed percentages of waste diversion from landfills Other states have set goals Bans on disposal of green waste in landfills at some locations
28 Number of Yard Waste Composting Facilities in the USA ( ) Year
29 General Trends in Composting Role of organics: importance of organics in reaching diversion goals pretreatment of organic matter to reduce demands on land disposal and emissions from disposal sites number and types of composting facilities quantities of organic materials being processed


30 Evolution of Modern Composting 1950s 1970s
31 Windrow Composting Method of providing oxygen and moisture to biomass: static forced aeration: synthetic covers plastic bags mechanically turned mechanically turned with forced aeration
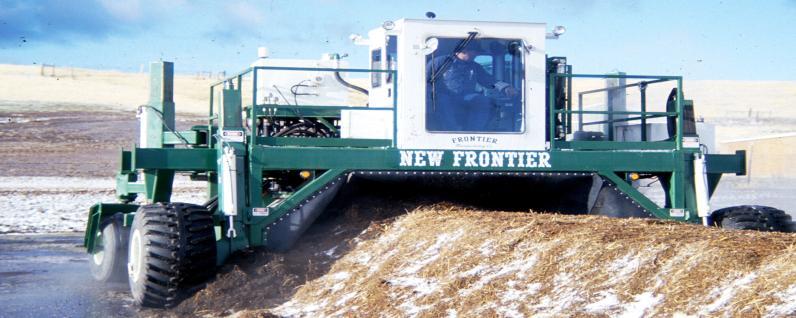
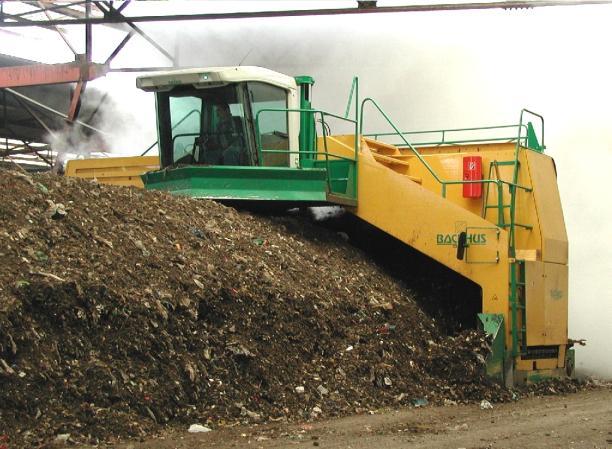
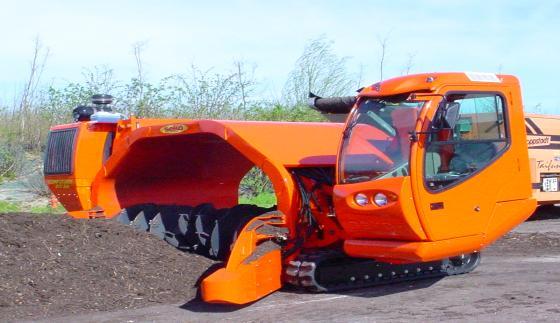
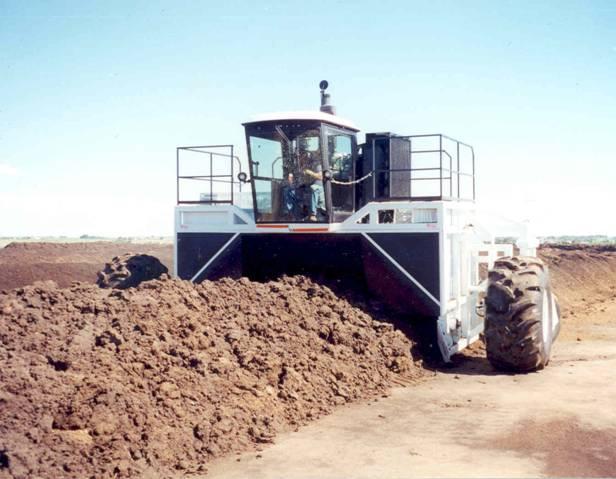
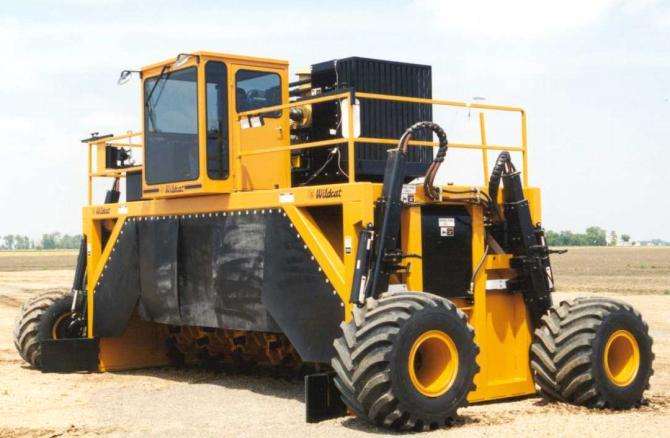
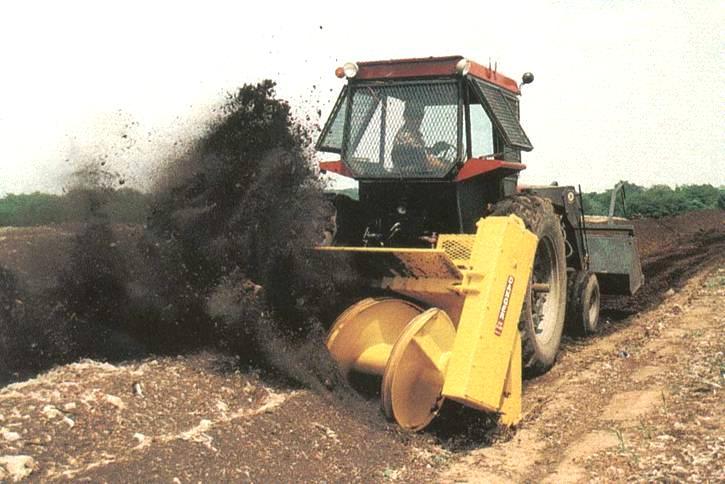
32 Self-Propelled Turning Machines


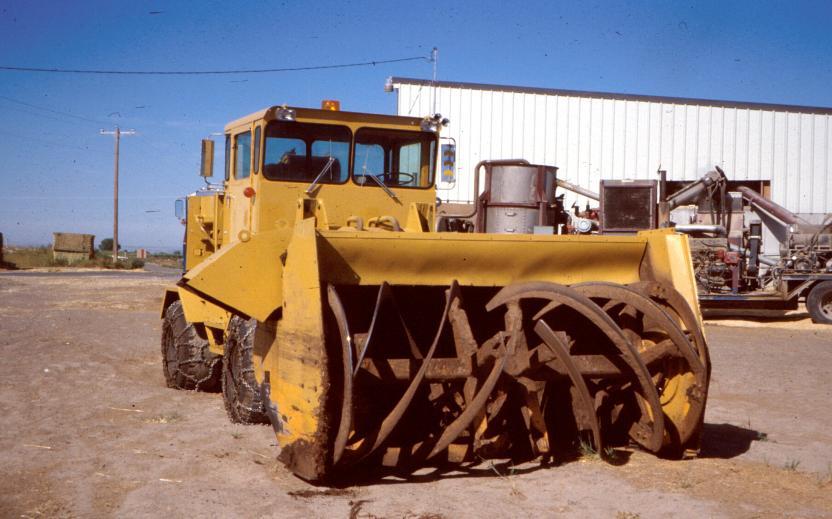
33 Turning Machines for Small Windrows

34 Open Windrows Turned windrow, ASP, and enclosed facilities Air/odor emissions and control Strong mechanical/ civil/geotechnical/ hydrogeological experience


35 Forced Air Windrows with Synthetic Covers

36 Schematic Diagram of Gas Flows in a Windrow Covered with Syntethic Material Atmospheric Agents Resistant CO 2 Oxygen Measuring Probe Temperature Probe Odors Humidity Sheet Anchors Heat Bacteria Gore-Tex Sheet Air Air

37 Close-up of Rotating Cylindrical Reactor

38 Basin Type Plant Under Construction, Depicting Forced Aeration Pipes
39 Anaerobic Digestion Facilities for the Recovery of Energy from Organic Matter

40 Lab-Scale Organic Fraction of MSW/Sludge Digesters in Richmond, California (1970s)


41 Pilot Food Waste Digester in Richmond, California (1980s)
42 Modern Technologies Essentially divided as a function of total solids content in the reactor: Dry digestion: TS > 15% Wet digestion: TS < 12%


43 Example of an installation for the treatment of organic matter

44 Wet Digestion DIGESTOR GASOMETER The electrical energy produced is used within the facility


45 Dry Anaerobic Digestion


46 Dry Anaerobic Digestion


47 Dry Anaerobic Digestion

48 Current performance of facilities Biogas Green Energy Biowaste DIGESTER 1 m3 of Biogas at 60% CH 4 6 kwh 600 kg CO 2 emissions savings Soil Conditioner
49 Installed Capacity of AD in the EU (tons per year) 4,500,000 4,000,000 3,500,000 3,000,000 2,500,000 2,000,000 1,500,000 1,000, ,
50 Relevant Financial Incentives Award Green Certificates (CG): European Directive 2001/77/CE promotes production of energy from renewable sources provides financial incentive to producer (time period and amount vary from country to country) one GC = 50 MWh of energy in Italy, financial incentive is /kwhe per year (~.138 US$/kWhe year) in Italy, incentive is valid for 8 years from startup of plant can be extended 4 more years (financial incentive reduced to 60%) in Germany, incentives last over 20 years
51 Financial Incentives in Germany Output (kw) Incentive ( /kwhe) < to to 5, ,000 to 20, Additional revenue may be obtained through co-digestion (from 0.04 to 0.06 /kwhe) Revenue from sale of electricity ~ /kwhe Additional bonuses for co-generation and for use of innovative technologies


52 Potential Solutions: Energy-Agro-Waste Systems for Maximum Efficiency
53 Introduction Communities are not planned from the outset for optimal utilization of materials and energy Community systems are composed of a number of individual subsystems, e.g.: food production wastewater treatment electricity supply Solid waste processing


54 Community Support Subsystems Waste Recycling & Composting Facility Wastewater Treatment Plant Waste Manufacturing Sector Methane Compost Consumer Products Food Production Food Waste Heat Electric Power Plant
55 Community Support Subsystems Design of any one subsystem does not take into account impact on all of the other subsystems Planned development of community systems needs to account for mass and energy balances among subsystems -- result: high overall system efficiency reduced net waste production conservation of energy overall optimum use of resources
56 Models of Unit Processes Requirements for modeling unit processes: identification of fundamental variables governing relations among variables (inputs and outputs) reliable scientific data foresight to identify common inputs and outputs among different types of unit processes INTEGRATION


57 Models of Unit Processes (cont.) Input Subsystem 1 Subsystem 2 Usable Output Residue 1 Residue 2
58 Mass and Energy Balance Diagram for Beef Production Feed 6.2 Metabolic Water 3.3 Water Intake 31.0 Oxygen 3.7 Feed Energy 721 watts Steer kg/day kg/day Sensible Heat Loss 425 Latent Heat Loss 200 watts Fecal Heat Loss 26 Tissue Energy 70 Stored Solids 0.22 Stored Water 0.46 Carbon Dioxide 4.1 Respired Water 7.1 Urine 8.8 Fecal Water 17.9 Fecal Solids 3.9
59 Concluding Remarks

60 Status of our Industry Many improvements have taken place in waste management practices during the last 70 years
61 Status of our Industry (cont.) However, society still consumes large quantities of items each day As an example, in the EU each person produced: 460 kg of solid waste per year in kg of solid waste per year in kg of solid waste per year (projected in 2020)
62 Conclusions/Recommendations Limited or conflicting information to make important management decisions Need reliable, scientifically based information Veracity in reporting results of programs Strategies used by most industrialized countries: Waste minimization Recycling (including bio treatment) Waste diversion from landfill
63 Conclusions/Recommendations Strategies used by most economically developing countries: Informal recycling Final disposal in the land Following are some specific suggestions for economically developing countries
64 Keys to Success Political will to solve the problem of waste management Development of 3R and zero waste strategies: appropriate technology (site selection, facility design) available resources (financial and human) for sustainable operations availability of uses/markets (product quality) Establishment of sound final disposal sites
65 Keys to Success Review and modernize pertinent laws Develop policies related to resource management and resource recovery Ensure continuity of staff in Environmental Management Following are three additional requirements for success:
66 Keys to Success Education Education Education AND
 Food for one")
67 Life Style California, USA example food (source: Menzel, So isst der Mensch, 2005) Food for one week


 Food for")
68 Lifestyle Germany example food (source: Menzel, So isst der Mensch, 2005) Food for one week


")
69 Lifestyle Rural Area - Ecuador example food (source: Menzel, So isst der Mensch, 2005) Food for one week