PREDEVELOPMENT VERSUS POSTDEVELOPMENT VOLUME ANALYSIS: An Application of Continuous Simulation Modeling using PONDS Version 3 Software
|
|
|
- Amos Wheeler
- 5 years ago
- Views:
Transcription
1 PREDEVELOPMENT VERSUS POSTDEVELOPMENT VOLUME ANALYSIS: An Application of Continuous Simulation Modeling using PONDS Version 3 Software PRESENTATION TO: SOUTH FLORIDA WATER MANAGEMENT DISTRICT RFP No. C-8501 SEPTEMBER 22, 1997 presented by: Devo Seereeram, Ph.D., P.E. a member of the DRMP Team
2 CONTINUOUS SIMULATION MODELING: WHAT IS IT? # A model which analyzes the day to day hydrology of the system over a long period of time (say 3 to 100 years), taking into account all components of the system s water budget. # Such a model can predict, on a daily basis, stages, inflows, and discharge rates and volumes (both ground water & surface water).
3 CONTINUOUS SIMULATION MODELING: WHY IS IT NEEDED? # For reasons of water quantity & water quality, there is a growing concern for regulating cumulative discharge volume from stormwater management systems in volume-sensitive basins. # Such a model is also useful for predicting wetland hydroperiods and impacts due to alteration of drainage patterns, etc. # In land-locked basins, excess cumulative rainfall over a 2 to 3 year period can result in stages which approach or exceed the 100 year flood elevations. After all, is 210 inches of rain in 3 years more critical than 10.6 inches of rain in 24 hours? Conventional modeling and current regulatory requirements do not address this type of occurrence which many of us saw first hand in
4 CONTINUOUS SIMULATION MODELING: THE METHODOLOGY # The long-term, continuous simulation model is performed using the PONDS Version 3 computer program (Win95/NT version). This is a MODFLOW-based ground water/surface water interaction model which computes ground water and surface water discharges during and following transient hydraulic loading of a water management pond or lake. # The first step is to create a long-term, continuous simulation hydrograph and the second step is to route it through the stormwater management pond. # Important to point out that this methodology has been used successfully on numerous projects in the Central Florida area.
5 CONTINUOUS SIMULATION MODELING: INPUTS TO GENERATE HYDROGRAPH # Surface water inflow: Directly Connected Impervious Area (DCIA) (acres), non-dcia area (acres), CN for non-dcia area. Note CN is automatically adjusted daily based on antecedent rainfall. # Evaporation loss & rainfall (daily) # E.T. within non-dcia area of watershed (daily) # Artificial recharge within non-dcia area of watershed
6 CONTINUOUS SIMULATION MODELING: POND DEFINITION # Stage-area relationship & perimeter of water body # Typical parameters for surficial aquifer system: permeability, porosity, and depth of aquifer (from geotech report) # Overflow discharge structures (up to 3) # Vertical exchange of water between water body & Floridan aquifer.
7 PREDEVELOPMENT Runoff Unsaturated soil Saturated soil Hydraulically Restrictive Layer FDOT R.O.W. Ditch
8 POSTDEVELOPMENT - DRY BOTTOM POND Convenience Store Stormwater Runoff PL FDOT R.O.W. Onsite Pond Unsaturated soil Saturated soil Hydraulically Restrictive Layer Outfall Pipe Ditch
9 POSTDEVELOPMENT - WET BOTTOM POND Stormwater Runoff PL Convenience Store FDOT R.O.W. Unsaturated soil Saturated soil Hydraulically Restrictive Layer Wet Detention Pond Outfall Pipe Ditch
10 EXAMPLE PROBLEM MODEL INPUT: DRAINAGE BASIN PARAMETERS MAGNITUDE PARAMETER UNIT PRE POST Area of contributing drainage basin ft² 35,031 35,031 Area of contributing drainage basin acre Non-impervious (non-dcia) area ft² 35,031 12,296 Curve Number (CN) for non-dcia area (AMC I) Curve Number (CN) for non-dcia area (AMC II) Curve Number (CN) for non-dcia area (AMC III) Impervious area (DCIA) ft² 0 22,735 Directly connected impervious area % 0.00% 64.90%
11 Month EXAMPLE PROBLEM MODEL INPUT: RAINFALL DATA Average for Orlando Intl Airport [ ] (inch) Normal Year [1982] (inch) January February March April May June July August September October November December TOTALS Each simulation was run for a 365-day (1 year) period starting January 1, 1982 and ending December 31, The simulation time step was 24 hours (i.e., 1 day). The total rainfall over each 24-hr period was treated as a single rainfall event for computing stormwater runoff.
12 EXAMPLE PROBLEM MODEL INPUT: STAGE-AREA DATA OF POND Geometric Parameters for Pond Parameter Unit Magnitude Equivalent pond length ft 120 Equivalent pond width ft 25 Stage (ft NGVD) Area Excluding Soil Voids in Side Slope (ft²) Area Including Soil Voids in Side Slope (ft²) , ,484 1, ,738 2, ,876 3,876
13 EXAMPLE PROBLEM MODEL INPUT: POND DISCHARGE STURCTURES Description Parameter Unit Magnitude SIDE CONTROL WEIR TOP CONTROL WEIR DROP CURB TO ENTRY POINT BLVD Discharge elevation ft NGVD Weir length ft 1.83 Weir coefficient Weir exponent Discharge elevation ft NGVD Weir length ft 7.83 Weir coefficient Weir exponent Discharge elevation ft NGVD Weir length ft 30 Weir coefficient Weir exponent - 1.5
14 EXAMPLE PROBLEM MODEL INPUT: AQUIFER PARAMETERS Parameter Unit Magnitude Base of mobilized aquifer ft NGVD +99 Seasonal high water table ft NGVD +101 Horizontal hydraulic conductivity ft/day 5 Fillable porosity % 20 Vertical recharge to Floridan aquifer within pond in/yr 6 Vertical recharge to Floridan aquifer outside pond in/yr 6
15 EXAMPLE PROBLEM MODEL INPUT: EVAPORATION & EVAPOTRANSPIRATION No. of Month days in month Normal Rainfall Monthly rates (inch) Daily rates (inch) Lake Evapo- Lake Evapo- Evaporation transpiration Evaporation transpiration January February March April May June July August September October November December TOTALS
16
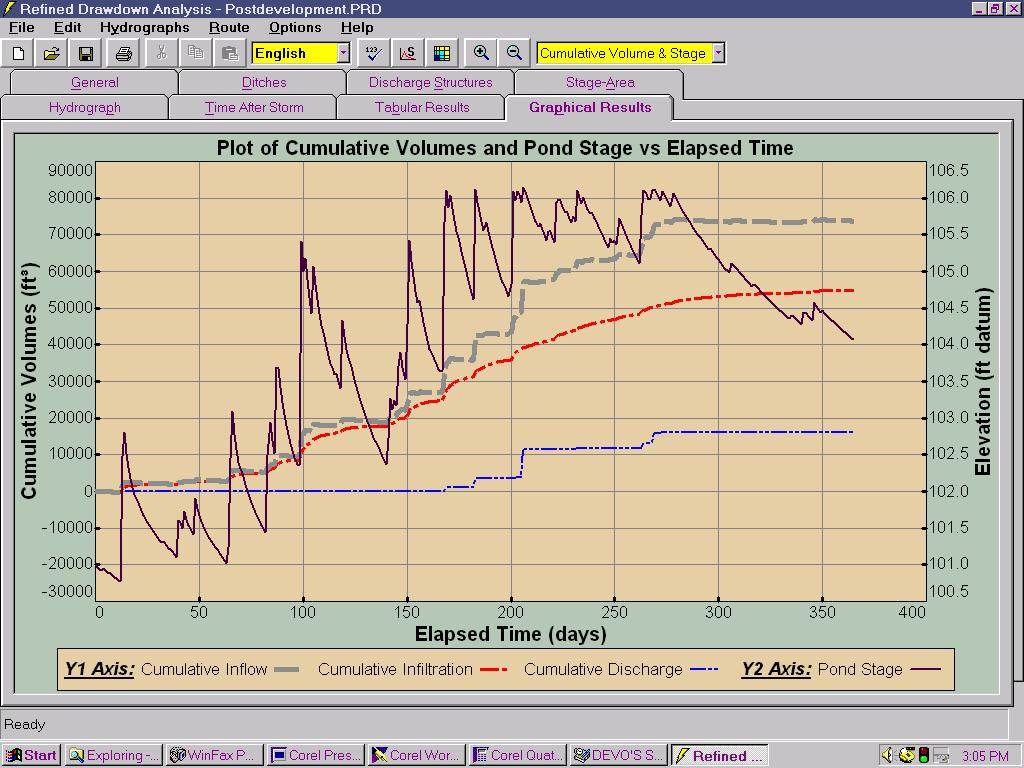
17 RESULTS FOR THIS EXAMPLE AVERAGE RAINFALL YEAR IS 1982! Predevelopment runoff volume for calendar year 1982 is 4,012 cubic feet! Postdevelopment runoff volume for calendar year 1982 is 16,171 cubic feet! If soil permeability is doubled from 5 ft/day to 10 ft/day, the postdevelopment runoff volume for calendar year 1982 is 5,676 cubic feet! If soil permeability is quadrupled from 5 ft/day to 20 ft/day, the postdevelopment runoff volume for calendar year 1982 is 1,563 cubic feet (16,171 þ 5,676 þ 1,563)
18 WHAT ARE THE OPTIONS FOR REGULATING VOLUMETRIC DISCHARGE # For the areas within SFWMD where pre-post volume regulations are needed & physically feasible, there are two (2) approaches the district may consider in quantitative criteria for regional or local facilities: < Option #1: The most assured method will be to require continuous simulation modeling for an average rainfall year, as demonstrated in this presentation. However, such comprehensive calculations may prove too onerous (& expensive) for the majority of consultants. < Option #2: Define an approriate retention volume & a corresponding recovery time which will ensure sufficient onsite recharge. Examples of similar existing criteria include:! Wekiva River Basin in SJRWMD: retention of 3 inches of runoff from DCIA with a maximum 14 day recovery period.! Cypress Creek and Reedy Creek Basins in Orange County (see chart in next slide).
19