Chinese climate and energy policy: Instruments and implications. Fei TENG, Xi YANG Institute of Energy, Environment and Economy, Tsinghua University
|
|
|
- Bruce Smith
- 5 years ago
- Views:
Transcription
1 + Chinese climate and energy policy: Instruments and implications Fei TENG, Xi YANG Institute of Energy, Environment and Economy, Tsinghua University
2 + Outlines Understanding China s 40%-45% targets; How to achieve this? From 11 th FYP to 12 th FYP: policy shift from command and control to market based mechanism; Air quality: a new driver for mitigation; Insights from LinkS
3 + Understanding china s 40-45% target
4 +Booming Economy in China 4 Fast growing in last 30 years: AAGR of 9.89% since 1978 Accelerate since access into the WTO in 2001 Driven by investment and export, rapid Industrialization and Urbanization RMB GDP(2005price) Annual Growth Rate 26% 24% 22% 20% 18% 16% 14% 12% 10% 8% 6% 4% 2% 0%


5 + Primary Energy Demand in China 5 Energy demand Increased in last 30 years: AAGR of 5.6% since 1978 Energy intensity decreased in the 10 th FYP from 2000 to 2005, rebound from 2008 Energy intensity reduction target was issued in the 11 th FYP, first time as a mandatory 4,0 target 18% 3,5 3,0 2,5 2,0 1,5 1,0 0,5 0,0 16% 14% 12% 10% 8% 6% 4% 2% 0% -2% Primary Energy Consumption (Billion TCE) Annual Growth Rate
6 Integrate Energy Conservation in China s Economic and Social development plan To reduce energy intensity of GDP by 20% from 2005 to % from 2010 to 2015 To prioritize in overall energy strategy To embodied in local development plans To facilitate change in development mode Mandatory targets to evaluate local performance
7 + China s Mitigation Actions China will endeavor to lower its carbon dioxidide emissions per unit of GDP by 40-45% by 2020 compared to the 2005 level; China will increase the share of non-fossil fuels in primary energy consumption to around 15% by 2020; China will increase forest coverage by 40 million hectares and forest stock volume by 1.3 billion cubic meters by 2020 from the 2005 levels; These autonomouse mitigation actions are voluntary in nature and will be implemented in accordance with the principles and provisions of the UNFCCC, in particular Article 4, para 7;
8 + Why 40-45%? Perspective from past trend From 1990 to 2005,GDP energy intensity reduce by 47%, with an annual rate of 4.1%. From 2005 to 2008,GDP energy intensity reduce by 10.1%,with an annual rate of 3.5%. Based on annual reduction rate of 3.5%,GDP carbon intensity will reduce by 40-45%. 单位产品能耗 1,2 1 0,8 0,6 0,4 0, 单位产品能耗单位 GDP 能源强度重工业产品比重 ,5 2 1,5 1 0,5 0 GDP 能源强度 ( 吨标煤 / 万元 GDP) % ,8% 120% 100% ,5% 64,6% 58,3% 73,60% 80% 60% ,5% 35,4% 41,7% 26,4% 40% 20% 上半年累计 -17,8% 结构节能量技术节能结构节能比重技术节能比重 0% -20%
9 + Why 40-45%? From perspective of energy elasticity From 2005 to 2008,average GDP growth rate is 11.2%,energy intensity decrease by 10.1%,energy elasticity is 0.65 Energy elasticity and GDP growth: 2005~2020 GDP growth rate(%) Energy elasticity Energy intensity reduction by 2020(%) Carbon intensity reduction by 2020 (%)
10 + How to achieve: allocation and mrv
11 Provincial targets under 11 th FYP --- an uniform allocation

12 Provincial energy intensities
13 TCE/ 万元 4 Energy intensity in local levels 3,5 3 2,5 2 1,5 1 0,5 0 全国北京天津河北山西内蒙古辽宁吉林黑龙江上海江苏浙江安徽福建江西山东河南湖北湖南广东广西海南重庆四川贵州云南陕西甘肃青海宁夏新疆 Provincial energy intensities and per capita GDP ,5 1 1,5 2 2,5 3 3,5 4
14 亿元 Local GDP and growth rate 北京天津河北山西内蒙古辽宁吉林黑龙江上海江苏浙江安徽福建江西山东河南湖北湖南广东广西海南重庆四川贵州云南陕西甘肃青海宁夏新疆 20% 15% 10% 5% No clear relationship between GDP/energy consumption/energy intensity Robust and volatile economic growth 70% of economic output and energy consumption concentrate in around 11 provinces 万 TCE Local primary energy consumption
15 4 3,5 3 2,5 2 1,5 1 0,5 0 全国北京天津河北山西内蒙古辽宁吉林黑龙江上海江苏浙江安徽福建江西山东河南湖北湖南广东广西海南重庆四川贵州云南陕西甘肃 青海 宁夏 新疆 Challenges in sector benchmarking Energy intensity of industrial value-added in iron & steel sector
16 Comprehensive evaluation analysis index Responsibility Potential Ability Obstacle index Share of energy consumption Share of GDP Per capita of energy consumption GDP growth rate Share of industrial value added Energy intensity of GDP Energy intensity of Industrial valueadded Share of tertiary sector Share of High tech industry Share of local fiscal revenue Fixed investment amount Per capita of GDP Rate of energy self sufficiency Share of coal in local energy mix Share of energy intensive sector Rate of urbanization notes To balance the burdens of energy conservation and economic development To reflect local potentials in energy conservation, technically and structurally To reflect differences in economic development stages and levels To consider local challenges
17 +Outcomes Scenarios for different national targets Groups Provinces 12 FYP National targets 17% 16% 15% I II Shanghai, Jiangsu, Shandong, Guangdong Beijing, Tianjin, Zhejiang, Liaoning, Hebei, Henan, Inner Mongolia, Shanxi 19% 18% 17% 18% 17% 16% III Jilin, Heilongjiang, Hubei, Hunan, Sichuan, Fujian, Chongqing, Anhui, Guangxi, Shaanxi, Ningxia 17% 16% 15% IV Jiangxi, Guizhou, Qinghai, Yunan, Gansu, Xinjiang, Hainan 13% 12% 11%
18 + Policy Implications Local proposals and pledges Several rounds of discussions Issued by the central government in National Energy Conservation Plan for 12 th FYP Groups Provinces 12 FYP National targets 16% I Shanghai, Jiangsu, Zhejiang, Guangdong,Tianjin 18% II Shandong, Beijing, Liaoning, Hebei 17% III IV Shanxi, Jilin, Heilongjiang, Henan, Hubei, Hunan, Sichuan, Fujian, Chongqing, Anhui, Shaanxi, Ningxia, Jiangxi Inner Mongolia, Yunnan, Guangxi, Guizhou, Gansu, Ningxia 16% 15% V Qinghai, Xinjiang, Hainan 10%
19 + Big provinces, in terms of economic size or energy consumption amount have higher energy conservation targets Developed provinces in coastal area Structural change should be underscored in local plans Provinces highly dependent on energy intensive industries Priorities could be varied according to local context Less developed provinces have lower targets Western provinces, border regions and ethnic provinces should be given special focus Provinces adopt similar methodology to further allocate target into municipal and factory levels
20 + From command and control to market based mechanism
21 + Work Plan during the 12th FYP ( ): Implementing Actions The Twelfth Five-Year Plan for National Economic and Social Development of the People's Republic of China passed by Peoples' Congress at March ; Work Plan for Greenhouse Gas Emission Control during the 12th Five-Year Plan Period issued by State Council at Dec Major Targets: Reducing carbon dioxide emissions per unit of GDP by 17% by 2015 from 2010 level. Controling the emissions of greenhouse gases including methane, nitrous oxide, HFCs, perfluocarbon and sulfur hexafluoride from non-energy activities. Improving climate change policy system and mechanisms, establishing systems for the statistical accounting of greenhouse gas emissions. Establishing carbon emission trading market gradutely. Conducting low carbon pilot projects. Enhancing the ability to control greenhouse gas emissions.
22 + Implementing Mitigation Actions Accelerating the adjustment of industrial structure: Increase the proportion of value added from services and strategic emerging industries to GDP to approximately 47% and 8% respectively; Promoting energy conservation: achieve energy conservation capacity of 300 million tce, reduce GDP energy intensity by 16%; Developing low carbon energy: the proportion of non-fossil energy consumption to primary energy consumption shall reach 11.4%; Increasing carbon sinks: increae 12.5 million hectares of forests, the forest coverage to 21.66%,forest stock volume by 600 million cubic meters. Piloting CCS demostration projects; Conctrolling GHGs from non-energy activities: Control GHGs from industrial producton process, agriculture and waste treatment; Strenghening replacement of emission intensive products: programs to replace cement, steel, lime, calcium carbide and other emission intensive products
23 + Scaling Up Policies and Measures Low carbon development pilot programmes: Low carbon provicnes and cities pilots (5 provicnes+8 cities); low carbon parks pilot (low carbon emerging industries); low carbon communities pilots (low carbon building and lifestyle); low carbon products (standards, labeling, verification, low carbon consumption); GHGs statistical and accounting system: Establishing comprehensive GHGs statistics system; invlolved in evaluation system of local government performance; GHG inventory at local level, key sectors and enterprises; Emission trading schemes: Establishing voluntary emission trading scheme; Conducting emission trading pilot programmes (two provinces+five cities); Enhancing supporting system for emission trading (MRV, registry, third party, regulation etc)
24 + Pilot project at local level 2005~ CDM project 2011~ VER trading 2011~2013 Learning phase of pilot regions 2013~2015 Formal regional ETS After 2016 National ETS Overall roadmap of China s ETS


25 +Pilot project at local level Why these regions? Level of economic development 天津市 Tianjin Relatively development 北京市 Beijing Strong economic power 湖北省 Hubei Large carbon emission 上海市 Shanghai 重庆市 Chongqing volume Potential market volume 广东省 Guangdong Large cap 深圳市 Shenzhen Many market players Trading volume
26 + Pilot project at local level Key index of pilot project provinces GDP per capita (RMB) rank Energy intensity (tce/10,000 RMB) rank Beijing Tianjian Shanghai Chongqing Guangdon g Hubei
27 + Pilot project at local level Regions Targets in 12 th FYP Beijing 18% Beijing Tianjin 1,88% 1,81% Shanghai 3,04% Hubei Guangdon 3,45% g 6,70% Chongqin g 1,76% CO2 emission share: 18.64% Tianjin 19% Shanghai 19% Hubei 17% Guangdong 17% Chongqing 19.50% Shenzhen (19.50%) Others 81,36% Beijing 3,33% Tianjin 2,06% Shanghai 4,12% Hubei 3,55% Guangdon g 10,81% Chongqin g 1,79% Others 74,34% GDP share: 25.66%
28 Pilot project at local level Beijing published Proposal on the regulatory framework for the pilot emission trading scheme Trade subject: enterprises with stationary source emission GHGs included: CO2 Trade system: under construction, prior to local exchange Stationary source emission mandatory voluntary Enterprises with annual CO2 emission 10,000 ton Enterprises with annual CO2 emission < 10,000 ton
29 Pilot project at local level 2020 GHG emission Industries covered Allocation Register system MRV Regulatio n Beijing GHG inventory, model forecast 10,000 ton CO2e Average emission of Draft Energy consumption report Published Tianjin Forecast Industries with high energy consumption Draft Database of emission factors Draft under discussion Shanghai GHG inventory, model forecast 20,000 ton in industry sector; 10,000 in service sectors 2009~2011 history emission Framework established Report system according to sectors Published Hubei 2020 GHG emission report 60,000 ton Under discuss Research report Draft MRV regulation Draft incentive regulation Guangdon g 2015 GHG emission forecast (tech + economic structure) Industries with high energy consumption New entrance and existing National key energy consumption enterprises investigation Draft Chongqing Accounting report Enterprises with annual emission beyond 20,000 ton CO2 Under design Draft technical report Draft under discussion


30 + Emissions of power industry Source:Second national communication Energy related emissions account for about 77% of China s total emissions, energy production and conversion account for 45% of the energy related emission. Electricity emissions accounted for about 30% of China s total emissions, or about 2.4 billion tons of CO 2
31 + Emissions of power industry Install ed capacit y (GW) Generati ng capacity (TWh) Operati ng hours <100MW MW 300MW MW MW g CO2/kWh CO 2 emissions of unit generating capacity Weighted average= %, 778 瓦时 Cumulative generating capacity Total Source:IEA ERI (2012) Source:author calculated
32 + Emission reduction pathways of power industry Long term: Low-carbon investment Short term: Low-carbon dispatch Consumer response Source:Australia Government (2011)
33 + Emission reduction pathways of power industry Long term: Low-carbon investment Power plants Pool Purchase Price Short term: Low-carbon dispatch Dispatch agency Transmissiondistribution price Consumer response Electricity consumers Electricity sales price
34 + Cost pass-through Generation Hours Energy Saving Dispatch A Traditional Dispatch B Energy consumption Low High Regulated wholesale and retail price; Dispatch based on equal generation hour principle; Frozen regulatory reform in electricity sector for decades; Partly resolved using idea of indirect emission ;
35 Challenges and Problems Lack of legislation (except for Shenzhen) Impact to industries, especially to power industries Allocation Rule of fair and transparent to be achieved Allocation to new entrance Unified emission trading system to be established Interaction with other policies (e.g. regulatory reform in power sector)
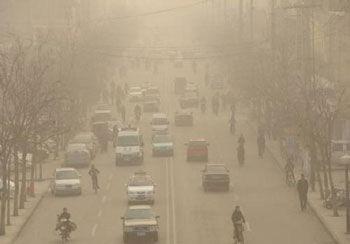
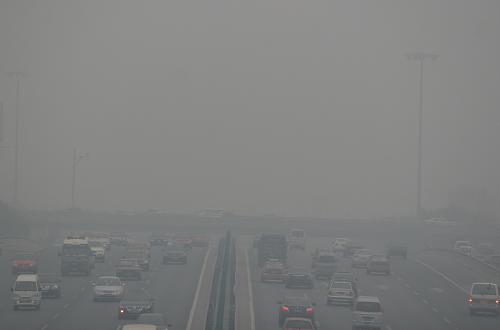
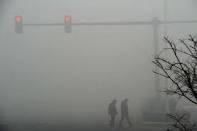
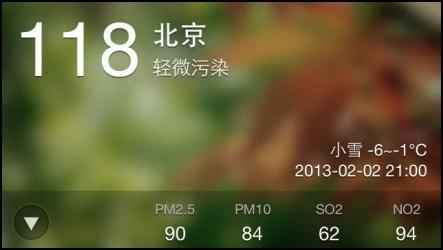
36 + Air quality: a new driver for more mitigation


37 37

38
39
40 PMs in AQI (Air quality Index) 400 API 北京天津石家庄 日期 400 API 武汉南京合肥上海 150 PM10 Concentration (mg/m 3 ) Zhuhai Guangzhou Shenzhen 日期 日期 (2002 年 1 月 )
41 + Air quality become binding Air quality (especially PMs) is not only an environmental issue but a political issue in China; A major part of PMs come from combustion of fossil fuels (e.g. 65% in Beijing, 43% from coal and 22% from transportation); Air quality become more binding than energy saving and energy security; Cap coal consumption become hot debated in China; Emission cap ( an aspirational moving national or regional cap) is proposed by NDRC to State Council in draft national climate change plan ( ).
42 + Insights from LinkS

43 + Insights from Global The mitigation effect depends on the stringency of policy goals; For developed countries, RE and EE is more stringent than GHG only, while in China GHG only is more stringent. China should pursue a multiobjective policy to move towards higher mitigation ambitions; An ETS policy cancels the effect of other mitigation relevant policies, but it may lower carbon price and gain more political support;
44 + Insights from bottom-up analysis Energy-saving technologies will create significant co-benefits, ranging from 3 $/t CO 2 to 39 $/t CO 2 at the national level; Comparable with carbon price under Global , but careful policy design needed to explore and internalize those benefits; Large spatial variations of co-benefits can be gained at the sub-national level and justify the enactment of more stringent climate policies in the wealthier regions in China. Yang and Teng (2013a, 2013b)

45 + Insights from Linking Use GCAM electricity demand (recalibrate to 2010) as input to China- TIMES; (Alternative scenarios) A push and pull policy for electricity sector, both from demand and generation sides; Coal-fired electricity generation will account for 59.2%, while lowcarbon power generation technologies contribute 40.8% by 2020.
46 + Insights from Linking: Towards a Coal Cap?
47 + Looking forward China s mitigation targets are driven by a combination of various factors: international pressure, domestic pressure in energy and environment; The binding factor is shifting from energy to environment, and need to pursue more mitigation; The policy paradigm is also shifting from command and control to market based mechanism like ETS, but needs more coordination on interactions with other policies; China should further pursue mitigation ambitions through a multi-objective policy approach; Co-benefit can further align national and local interest with international climate agenda; ETS in power sector is lack of cost pass through due to regulated electricity tariff, coal cap needs more analysis in the future;
48 + Thank you