Current Status and Future of Asphalt Recycling in the USA. Randy C. West, Ph.D., P.E. Director & Research Professor
|
|
|
- Dwain Briggs
- 5 years ago
- Views:
Transcription


1 Current Status and Future of Asphalt Recycling in the USA Randy C. West, Ph.D., P.E. Director & Research Professor

2 Presentation Outline NCAT introduction U.S. trends on RAP usage Recycling practices and technology hurdles Field performance studies of high RAP content mixtures Future challenges and opportunities 2
3 Mission To provide innovative, relevant, and implementable research, technology deployment, and education that advances safe and sustainable asphalt pavements. Quick Facts Established in 1986 Funded through contracts The largest research center at Auburn University 50 full-time and part-time employees


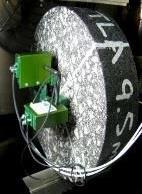
4 Pavement Test Track Asphalt Pavement Proving Ground 46 Test Sections, 61 m each 5 trucks each pulling 3 heavily loaded trailers make 400 laps/day Test sections are evaluated continuously over 3 year cycles.


5 5
6 Estimates of RAP Usage NAPA estimates that the national average RAP content increased from 16.2% in 2009 to 21.4% in RAP contents are typically higher in commercial projects compared to government projects. RAP usage varies considerably from state to state. 6

7 Average RAP contents by state NAPA IS 138,

8 Motivations for Higher RAP Contents Environmental & Sustainability benefits Economic savings 8


9 Conservation of Materials At an average RAP content of 21%, we conserve over 77 million tons of aggregate and 25 million barrels of asphalt each year. 9

10 Recycling Economics Example Aggregate: $15.00/ton Asphalt: $400.00/ton Mix Design AC Content: 5.0% Materials Costs Only $15 x.95 = $14.25 $400 x.05 = $20.00 Total Mix $
11 RAP Economics: 20% RAP Aggregate: $15.00/ton Asphalt: $400.00/ton RAP: $6.00/ton (5% AC in RAP) Mix Design AC Content: 5.0% RAP content 20% (19% rock, 1% AC) 16.5% savings $15.00 x.76 = $11.40 $ x.04 = $16.00 $6.00 x.20 = $ 1.20 Total Mix $

12 U.S. Annual Savings from Asphalt Recycling 12
13 JAN 02 MAY 02 SEP 02 JAN 03 MAY 03 SEP 03 JAN 04 MAY 04 SEP 04 JAN 05 MAY 05 SEP 05 JAN 06 MAY 06 SEP 06 JAN 07 MAY 07 SEP 07 JAN 08 MAY 08 SEPT 08 JAN 09 MAY 09 SEPT 09 JAN 10 MAY10 SEPT 10 JAN 11 MAY 11 SEPT 11 JAN 12 MAY 12 SEP 12 JAN 13 MAY 13 SEP 13 JAN 14 MAY 14 SEP 14 JAN 15 MAY 15 SEP 15 JAN 16 MAY 16 SEP 16 JAN 17 Asphalt Price Per Ton WTI Crude Oil ($/barrel) $900 $800 $700 $600 $500 $400 $300 $200 $100 Unmodified Paving Grade Asphalt and Crude Oil Prices PG unmodified Crude Oil (WTI) $0 0 13
14 Materials Savings $/ton Recycling Economics Example $25.00 $20.00 $15.00 $10.00 $5.00 save $1/ton more asphalt binder cost/ton $700 $600 $500 $400 $300 $- 0% 10% 20% 30% 40% 50% 60% %RAP 14 14
15 Materials Savings $/ton Recycling Economics Example $25.00 $20.00 $15.00 $10.00 $5.00 save $1.33/ton more asphalt binder cost/ton $700 $600 $500 $400 $300 $- 0% 10% 20% 30% 40% 50% 60% %RAP 15 15

16 The average RAP content in Japan is 47% 16
, including processing RAP (i.e., fractionating) and covering stockpiles. 2. Heating the RAP to drive out moisture and soften the RAP binder. 3.")
17 Free download from NAPA Japan attributes their successful use of high RAP contents to three key points: 1. A focus on quality (reducing variability), including processing RAP (i.e., fractionating) and covering stockpiles. 2. Heating the RAP to drive out moisture and soften the RAP binder. 3. Using a softening agent (and other mixing best practices) to achieve desired mix characteristics. 17


18 Japan High RAP Plants Separate RAP dryer Low moisture RAP Batch plants Hot RAP mixed with rejuvenator and stored 2 hrs Rejuvenated RAP mixed with virgin materials High RAP mixes look and perform like virgin mixes 18

19 Current RAP Practices in the US In most (not all) places across the USA Project millings become property of contractor Urban contractors have excess supplies of RAP RAP Management Best Practices Inventory Analysis Processing Quality Control 19


20 Benefits of Milling Removes cracked and aged pavement layers Helps improve pavement smoothness and cross-slopes Maintains curb heights, drainage inlets, and bridge clearances Creates a rough texture that bonds better with the overlay
21 U.S. Barriers to Higher RAP Contents Historical Perceptions Performance of high RAP content pavements Concerns about quality and consistency of RAP Technology Limitations Current mix design system Relies on volumetric properties & therefore aggregate bulk specific gravities Does not adequately consider composite binder properties Need reliable performance tests / balanced mix design 21
22 NCAT Research on Using RAP LTPP study of overlays containing 25% RAP NCHRP Report 752: High RAP Content Mix Design Numerous lab studies on how to improve cracking resistance for mixes containing RAP Test Track experiments in 3 rd, 4 th, 5 th, and 6 th cycles


23 18 U.S. states and Canadian provinces Eight 152 m test sections Project built between 1995 and mm vs 125 mm overlay thickness 25-30% RAP vs virgin mixes Projects ranged in age from 6 to 17 yrs 23
24 Conclusions on LTPP SPS-5 Based on a long-term performance analysis of 18 projects across North America Pavements using 25-30% RAP performed well, and in most cases, perform equal or better than virgin pavements Transverse and fatigue cracking were observed at higher percentages in pavements with RAP compared to pavements with all virgin materials. Higher cracking percentages did not impact the overlay lives Mix designs on several projects indicate high dust contents and low asphalt contents for RAP mixes. 24

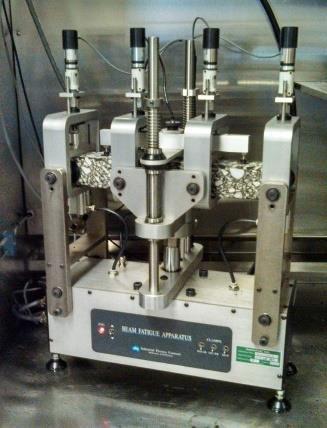
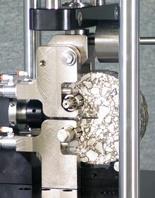
25 NCAT Test Track 2006: Moderate and High RAP Content Surface Mixes Mixes with 20% and 45% RAP performed very well 30 million ESALS over 8 years Minor differences in cracking support the use of softer virgin binder in high RAP content mixes Lab Tests: Bending Beam Fatigue, IDT Energy Ratio, and Texas Overlay Test. The best correlation with cracking in sections was IDT Creep Rate. 25

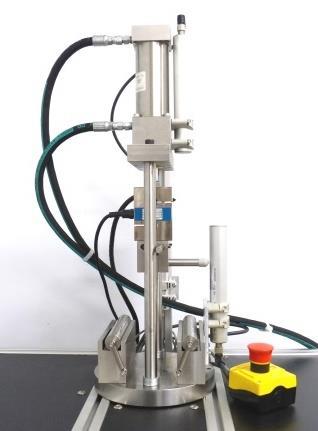
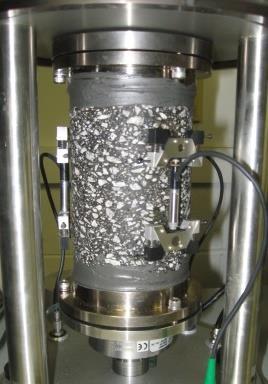
26 NCAT Test Track 2009: Virgin versus 50% High RAP Content All Layers Mixes with and without WMA All sections performed very well 50% HMA section no distress through 20 million ESALS Lab Tests: BBF, Overlay Tester, Cyclic Fatigue Best correlation with observed fatigue cracking was OT results extrapolated to the measured strain level 26


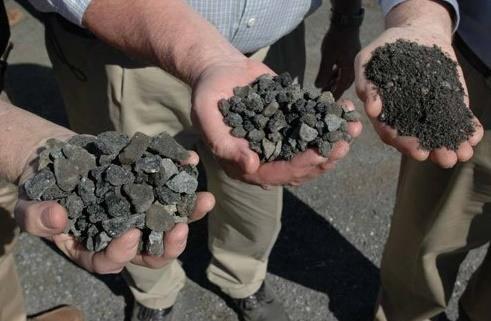
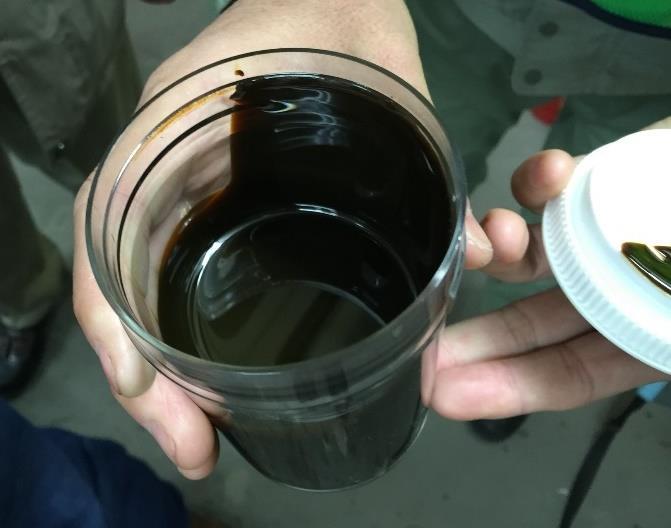
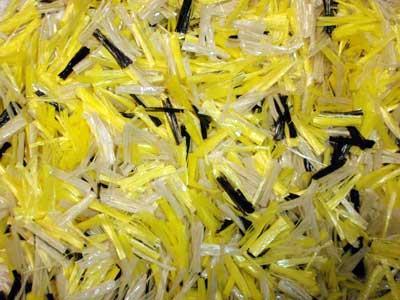
27 Recycled Shingles With the current volumetric mix design system Sulfur pellets Fractionated RAP Recycling agents Recycled Tire Rubber 27 Aramid & Polyolefin fibers


28 Balanced Mix Design Cracking Resistance Rutting Resistance 28


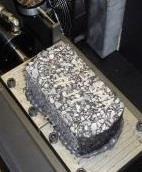
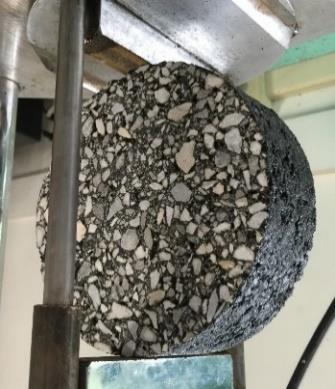
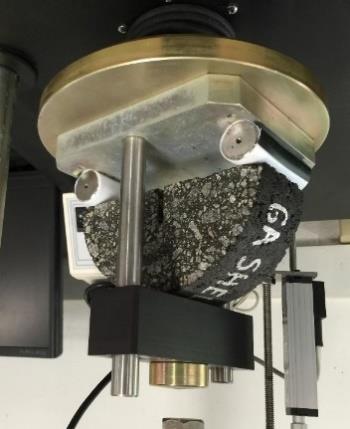
29 Some Tests for Assessing Cracking Resistance BBF SCB-LA I-FIT OT-TX OT-NCAT SVECD DCT Energy Ratio Nflex Factor Cantabro 29


30 MnROAD - NCAT Partnership Scope of Cracking Test Experiments MnROAD Low-temperature cracking NCAT Test Track Top-down cracking
31 Summary Asphalt is the most recycled material in the U.S. Recycling is the standard practice for asphalt practice among contractors. Typical RAP contents is about 20%. Most agency specifications are permissive toward RAP. Maximum RAP contents set for different mix types. Most DOTs are unlikely to increase RAP limits in the near term. Balanced mix designs will replace volumetric-based mix designs 31

32 Thank You! 32