Nutrient Response to Sewage Abatement in Hong Kong
|
|
|
- Cody Bridges
- 5 years ago
- Views:
Transcription

1 Nutrient Response to Sewage Abatement in Hong Kong Prof. Paul J. Harrison Atmospheric, Marine & Coastal Environment Program Institute for the Environment HK University of Science & Technology
2 Outline Background of natural factors influencing water quality Anthropogenic inputs Pearl River discharge - Sewage discharge Meeting the challenges - sewage treatment for Victoria harbor
3 Why Is Hong Kong Not As Bad As Expected? Physical Factors monsoon winds - river discharge and rainfall - wind and tidal mixing Chemical and Biological factors These factors govern the ecosystem sensitivity to various anthropogenic inputs. Need to understand how the ecosystem functions.
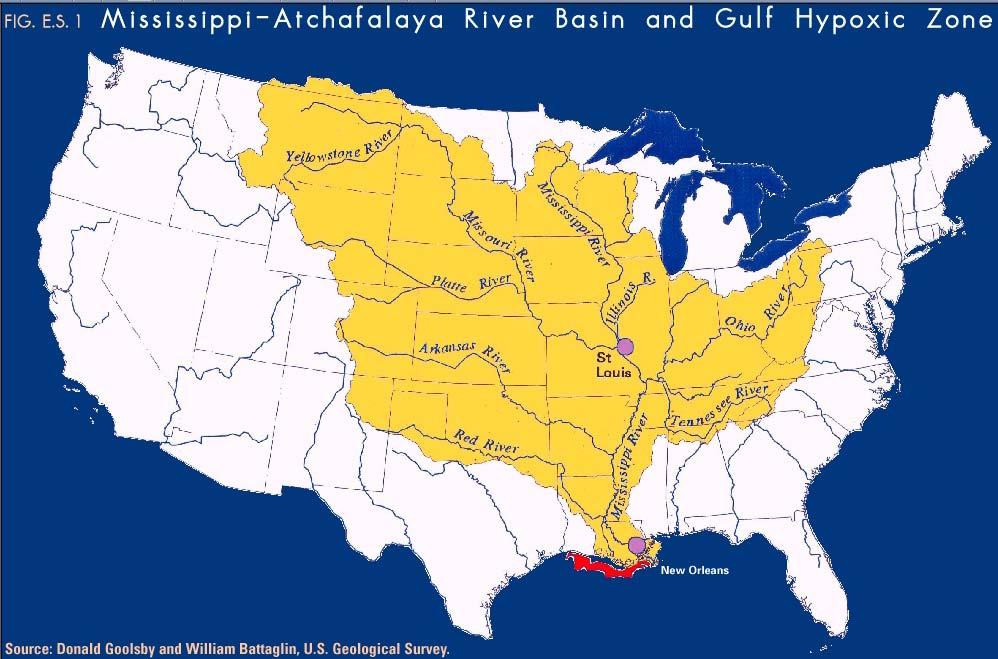
4 Dead Zone
 (<2 O 2 mg/l) Science 281, (1998)")
5 Northern Gulf of Mexico: a large area of hypoxia dead zone (20,000 km 2 ) (<2 O 2 mg/l) Science 281, (1998)

6 South China Sea Nutrient-poor sea Pearl River Estuary Hong Kong western and southern waters excessive nutrients South China Sea


7 Fine resolution land-use 1994 vs USGS Landuse

8 2003 PRD Land-use map Red = Urban area From HKSAR Planning Department
9 Pearl River Estuary & Hong Kong Wide and Shallow Estuary Diverse estuarine to oceanic Complex topographically enclosed bays and islands Water area = 10 times land area 50 km


10 10 Water Quality Zones in Hong Kong
 with")

11 Shallow (10 m) with some deeper 25 m channels
12 Tidal Mixing Important in mixing O 2 into bottom waters and nutrients in the water column.
13 Neap tide Spring Tide Tidal Height During Neap and Spring Tides
14 Wind Mixing Wind mixing can help reduce the occurrence of hypoxia (mixes O 2 from the air into deep waters Reduces the formation algal blooms by dilution.
15 AFCD Phytoplankton Monitoring Stations

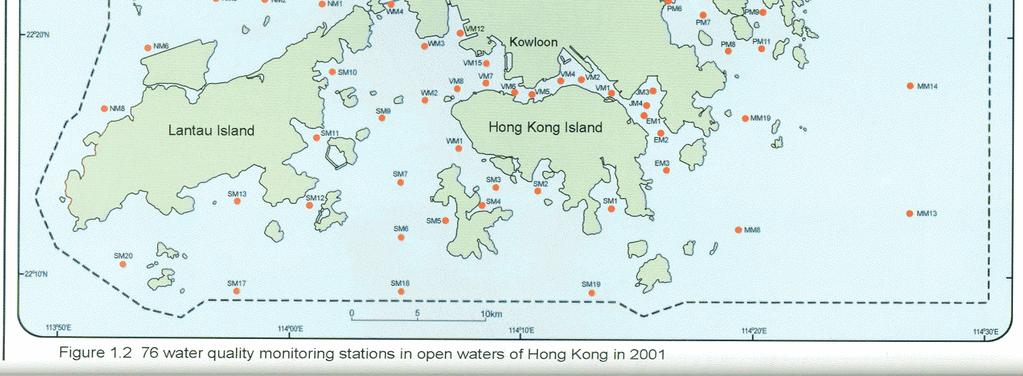
16 EPD s Water Quality Monitoring Stations
17 Increase in TIN and NO 3 from
18 Excessive Nutrients Can Cause Low O 2 in Bottom water Nutrients algae plankton fish Sink Bacterial decomposition low O 2 in bottom water

19 Surface Algal Bloom
20 Kilometers N Zone M (126) Zone T (288) Zone P (122) Zone H (108) Zone V (21) Zone W (29) Zone L (36) New Territories Lantau Isl. HK Isl Red Tides in Hong Kong during (Yin et al. 2002)
21 High Number of Red Tides in Eastern Waters Most red tides occur in spring when river discharge is low Occur in Mirs Bay far from the Pearl River estuary.
22 High Biomass Vs Toxic Red Tides High biomass algal blooms which cause low O 2 bottom waters seems to be a more serious concern than toxic red tide blooms.

23 High Biomass Blooms e.g. Chain-forming Diatoms Thalassiosira sp.
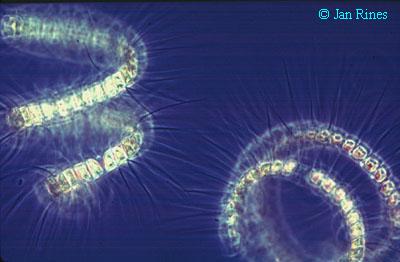
24 Chaetoceros debilis
25 Nutrient Sources Sewage continuous all year excess phosphorus sewage treatment ecosystem response (improving) BUT chl biomass increase in southern waters? Pearl River discharge summer (rain), excess nitrogen and transported offshore - phosphorus potentially controls algal biomass in summer in waters near Pearl River. HK waters are very productive
26 Sewage Outfalls in 2001
27 Transect from Western Waters Through Victoria Harbor Legend Water sampling stations selected Boundary of Special Administrative Region N Shenzhen MM1 MM2 MM3 MM4 MM7 MM17 MM5 DM2 DM1 DM4 DM3 TM3 TM5 TM4 TM6 TM7 TM8 MM6 MM16 DM5 New Territories TM2 Estuary NM6 NM8 NM5 NM3 Lantau Island NM2 NM1 SM11 SM10 SM9 WM4 WM3 WM2 VM12 VM8 VM14 VM15 VM7 VM6 Kowloon VM5 VM4 Hong Kong Island VM2 VM1 PM5 JM3 JM4 PM6 EM1 EM2 PM1 PM4 PM2 PM3 PM7 PM8 PM9 PM10N MM15 MM14 WM1 SM13 SM12 SM7 SM6 SM5 SM3 SM4 SM2 SM1 EM3 MM8 MM13 Oceanic SM20 SM17 SM18 SM km Figure showing EPD routine water sampling stations Vertical Mixing in Victoria Harbor
28 NH 4 (μm) N6 2 W4 3 V8 6 Jan Feb Mar Apr May Jun 2 E1 3MM8 Surfac ebottom N6 2 W4 3 V8 6 Jul Aug Sep Oct Nov Dec 2 E1 3MM8 NH 4 is a good marker for sewage input in Victoria Harbor. From: Yin & Harrison 2005 Mar Poll Bull Stations Average NH 4 during for each station across the transect.
29 Surface Jan Jul Bottom 3 2 Feb Aug Phosphate PO 4 (µm) Mar Apr Sep Oct Low in dry season Little change in the estuarine-influenced waters during wet season 3 2 May Nov Higher in Vic. Harbor Jun Dec 1 0 N6 2 W4 2 V8 6 2 E1 3 MM8 N6 2 W4 2 V8 6 2 E1 3 MM8 Stations From: Yin & Harrison 2005 Mar Poll Bull
30 Surface Bottom High N from Pearl River TIN (µm) Jan Jul Feb Aug Mar Sep Apr Oct May Nov Jun Dec N6 2 W4 2 V8 6 2 E1 3 MM8 N6 2 W4 2 V8 6 2 E1 3 MM8 Stations Total Inorganic Nitrogen Low in dry season High in western waters during wet season. From: Yin & Harrison 2005 Mar Poll Bull

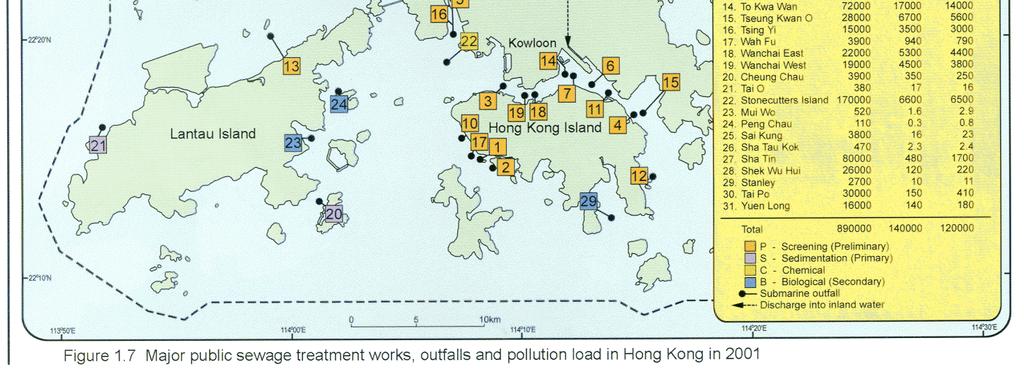
31 Sewage Outfalls in 2001

32 70% of the sewage receives primary treatment at SCI Now 70% of sewage is treated at Stonecutters Island due to HATS Unique opportunity
33 Transect 1: West East NH NH 4 (um) S4 Victoria Harbor S5 Victoria Harbor S6 Victoria Harbor Year NH 4 (um) Western waters S NH 4 (um) Eastern waters S Year Year
34 Transect 1: West East PO PO 4 (um) S4 Victoria Harbor S5 Victoria Harbor S6 Victoria Harbor Year PO 4 (um) Western waters S1 PO 4 (um) Eastern waters S Year Year
 10 8 6 4 2 Western waters S1 Chla (ug L -1 ) 10 8 6 4 2 Eastern waters S8 0 1986 89 92 1995 Year 98 01 04-05 0 1986 89 92 1995 Year 98 01")
35 Transect 1: West East Chl a Chla (ug L -1 ) S4 Victoria Harbor S5 Victoria Harbor S6 Victoria Harbor Year Chla (ug L -1 ) Western waters S1 Chla (ug L -1 ) Eastern waters S Year Year

36 Chl in Southern Waters Chl a Chla (ug L -1 ) Chla (ug L -1 ) Southern waters S Year Southern waters Year S
37 Bottom DO DO (mg / L) S Year S2 S3 S S Legend 12 Water sampling stations selected 7 S6 Shenzhen 5 Lantau Island S1 S9 S2 S10 New Territories S3 Kowloon S4 S6 S5 Hong Kong S11 S7 N DO (mg /L) S S8 S km Figure showing EPD routine water sampling stations S Year
38 Bottom DO Legend 12 Water sampling stations selected DO (mg / L) S Year S1 Shenzhen S2 New Territories Kowloon N DO (mg / L) S Year DO (mg / L) Lantau Island km Figure showing EPD routine water sampling stations S Year S9 S10 S3 S12 S4 S6 S5 Hong Kong S11 DO (mg / L) S7 S12 S Year
39 Cross-border Influence (Watershed contribution) Pearl River discharge Rainfall

40 Guangdong Province & Pearl River Region (satellite image courtesy of Pearl River Water Resources Commission, 1998)
 - Kedong Yin, 2003 Hong Kong SW winds Summer Scale is a Critical Period 50")
41 HK Nutrient Source 1: Pearl River Estuary Summer Pearl River Estuary Rainfall in HK & Pearl River Discharge during Monthly Average Rainfall (mm) Month Pearl River Discharge (m 3 s- 1 ) - Kedong Yin, 2003 Hong Kong SW winds Summer Scale is a Critical Period 50 km
42 Nutrient Sources 1) Anthropogenic Sources Sewage N:P = 8:1 Rain N:P = 50:1 River N:P > 100:1 2) Natural Sources (N:P <16:1) from coast - South China Sea Algae need N:P = 16:1 Excess nitrogen in Summer
43 NO 3 at Humen (a river mouth of the Pearl River) NO 3 (μm) At River Mouth 100 µm
44 Monthly Average of total inorganic nitrogen during (Yin 2002) N Kilom Pearl River Shenzhen, Guangdong Lingdingyang New Territories # Macau Lantau Isl. HK Isl. Western waters Southern Water Mirs Bay TIN 50 0 Surface Bottom Month 50
45 Monthly Average of phosphate during (Yin 2002) N Kilom Pearl River Shenzhen, Guangdong Lingdingyang New Territories # Macau Lantau Isl. HK Isl. Phosphorus Western waters Southern Water Mirs Bay Month
46 Monthly Average of Molar N:P ratio during (Yin 2002) N Kilom Pearl River Shenzhen, Guangdong Lingdingyang New Territories # Macau Lantau Isl. HK Isl. Molar N/P Ratio Western waters Surface Bottom Southern Water Mirs Bay Month
47 Unused Nitrogen in Summer in Western and Southern waters Potential P limitation in summer near estuary Concentrations Nitrogen Phosphorus Time Unused N (exported offshore)? Add more P N used up and more algal biomass is produced
48 Ecosystem Responses to Input of Nutrients Riverine, Atmospheric Input Phosphorus control Algal Biomass Increase Excess Nitrogen Resuspension Sinking Benthic-Pelagic exchange O 2 Decrease
49 Only Episodic Low O 2 Events Late Summer Good Physics wind and tidal mixing and tidal currents dilute the algal biomass. - Shallow water depth Good Chemistry - low phosphorus compared to some rivers
50 Summary Excess nitrogen in summer in western and southern waters. P is potentially the most limiting nutrient since N/P ratios are high in the estuarine influenced western waters in summer. At the present, removal of P would more likely control algal biomass production. Improving conditions in Victoria Harbor due to sewage abatement.