Draft Isle of Wight Bay Watershed Characterization (Watershed )
|
|
|
- Drusilla Lyons
- 5 years ago
- Views:
Transcription
1
2 February 19, 2001 Draft Isle of Wight Bay Watershed Characterization (Watershed ) In support of the Watershed Restoration Action Strategy Subject to Input from Public Stakeholders Review Notes: 1- Local Input. Worcester County input received through January 2001 is included in the February 2001 Draft. Additional input from the County and other stakeholders is necessary to add local perspective and to meet local needs. 2- Changes incorporated to create the February 2001 Draft - Comments from Worcester County, DNR technical staff and MDE added throughout. - Md Dept. of Agriculture comments added: Land Use section and map; Stormwater section; Other Projects section, Benchmarks section - New: Designated Uses map - New: Natural Resource Areas at the local watershed scale text and map - New: Soils section and map 3- Potential Revisions 4- Electronic Version. The February Draft is Internet compatible. 5- Contact. Ken Shanks at or kshanks@dnr.state.md.us or DNR E-2, 580 Taylor Avenue, Annapolis MD
3 Important Contributors to the Isle of Wight Bay Watershed Characterization Worcester County Maryland Dept. of Natural Resources (DNR) Others Department of Comprehensive Planning Sandy Coyman, Katherine Munson, David Honick NRCS, US Dept. of Agriculture Bruce Nichols Coastal Zone Management Program, CCWS * Katharine Dowell, Cornelia Pasche Wikar, Mary Conley Fisheries Service Al Wesche, Larry Leasner Public Lands John Wilson Resource Assessment Service Ron Klauda, Peter Tango, Catherine Wazniak, Tom Parham, Sherm Garrison, Chris Millard Sarbanes Cooperative Oxford Lab Kelly Greenhawk Watershed Management and Analysis Division, CCWS * John Wolf, Christine Conn, Fred Irani, David Bleil, Michael Hermann, Ted Weber Watershed Restoration Division, CCWS * Niles Primrose, Kevin Smith Wildlife & Heritage Division Lynn Davidson Maryland Dept. of Agriculture (MDA) John Rhoderick, Louise Lawrence Maryland Dept. of the Environment (MDE) Denice Clearwater, Julie Labranche, Steven Bieber, Robert Daniel Editor and Primary Author Ken Shanks, Watershed Management and Analysis Division (DNR CCWS) * See Abbreviation Key
4 TABLE OF CONTENTS Isle of Wight Bay Watershed Characterization EXECUTIVE SUMMARY... iv INTRODUCTION... Page 1 Watershed Selection... Page 1 Location... Page 1 Purpose of the Characterization... Page 1 Additional Characterization Recommended... Page 2 Identifying Gaps In Information... Page 2 Adaptive Management... Page 2 WATER QUALITY... Page 5 Introduction... Page 5 Designated Uses... Page 5 Not Supporting Designated Use 303(d) Listings... Page 6 What Are the Effects of Nutrient Over-Enrichment? Water Quality Indicators... Page 9 Interpreting Water Quality Indicators Water Quality Assessment... Page St. Martin River Tributaries 2. Data Sources 3. Total Maximum Daily Loads Point Sources... Page 13 Nonpoint Sources... Page St. Martin River Watershed Assessment 2. Stream Bank Erosion 3. Shoreline Erosion 4. Nutrient Loads from Shoreline Erosion to be Estimated 5. Stormwater LAND USE... Page 19 Landscape Indicators... Page 20 Interpreting Landscape Indicators 1997 Land Use... Page 22 Growth Management in Worcester County... Page 24 Ocean City... Page 24 Green Infrastructure... Page 25 i
5 Natural Resource Areas At the Watershed Scale... Page 27 Protected Lands... Page 29 Smart Growth... Page 30 Soils of the Isle of Wight Bay Watershed... Page Interpreting Local Conditions with Natural Soil Groups 2. Soils and Watershed Planning Wetlands... Page Introduction to Wetland Categories 2. Tracking Wetlands 3. Interpreting Wetland Distribution LIVING RESOURCES AND HABITAT... Page 37 Overview... Page 37 Living Resource Indicators... Page 38 Plankton... Page Algae 2. Pfiesteria. 3. Brown Tide Benthos in Nontidal Streams... Page 41 Why Look At Benthos In Streams? Fish... Page 42 Oysters, Clams and Crabs... Page 43 Sensitive Species... Page Habitat Protection Categories 2. Rare Fish and Mussels Submerged Aquatic Vegetation... Page 47 RESTORATION TARGETING TOOLS... Page Stream Corridor Assessment... Page /2001 Stream Corridor Assessment... Page 49 Clean Marinas Program... Page 49 Fish Blockages... Page 50 Stream Buffer Restoration... Page Benefits and General Recommendations 2. Using GIS 3. Headwater Stream Buffers 4. Land Use and Stream Buffers 5. Nutrient Uptake from Hydric Soils in Stream Buffers 6. Wetland Associations 7. Optimizing Water Quality Benefits by Combining Priorities Wetland Restoration... Page 62 ii
6 PROJECTS RELATED TO THE WRAS PROCESS... Page 64 Overview... Page (h)-Funded Projects... Page 64 Other Projects... Page 65 POTENTIAL BENCHMARKS FOR WRAS GOAL SETTING... Page 66 ADDITIONAL INFORMATION... Page 67 Sources Used for the Characterization... Page 67 Other Information Sources by Topic... Page 71 Abbreviation Key... Page 72 Contacts for More Information... Page 73 Technical Reports Referenced... Page 74 LIST OF MAPS WRAS Project Area... Page 3 Streams and Sub-Watersheds... Page 4 Designated Uses... Page 8 Monitoring Stations... Page 12 MDE Permits... Page Generalized Land Use... Page 23 Green Infrastructure Overview... Page 26 Natural Resources of Potential Local Significance... Page 28 Protected Land and Smart Growth... Page 31 Soils... Page 33 Wetlands of the Isle Of Wight Bay Watershed... Page 36 Sensitive Species... Page 46 Fish Blockages and Marinas... Page 52 Land Use Scenario for Stream Buffer Restoration... Page 57 Nutrient Retention Using Hydric Soils Scenario... Page 58 Nutrient Retention Using Hydric Soils Associated With Crop Land Scenario... Page 59 Wetland Proximity Scenario for Stream Buffer Restoration... Page 60 Prioritizing Streams Scenario... Page 61 Wetland Restoration Opportunities... Page 63 iii
7 EXECUTIVE SUMMARY For The Isle of Wight Bay Characterization Worcester County, Maryland is receiving Federal grant funding and State technical assistance to prepare a Watershed Restoration Action Strategy (WRAS) for the Isle of Wight Bay watershed. the 1998 Maryland Clean Water Action Plan identified the Isle of Wight Bay watershed as a Priority Watershed in need of restoration. Worcester County applied for grant funding and volunteered to develop a strategy in the watershed to improve water quality using protection and restoration projects. The WRAS project complements the Maryland Coastal Bays Program (MCBP) which is a much more broad and detailed effort to manage Maryland s Coastal Bays. The Isle of Wight Bay watershed encompasses about 47,400 acres in the Mid-Atlantic coastal plain of Maryland and Delaware. Maryland s area covers about 33,600 acres of land and tidal marsh with 7,500 acres of tidal water. Watershed waterways vary from coastal embayment to sluggish coastal streams fed by extensive ditching through hydric soils that dominate the watershed. Land use varies from rural headwaters dominated by forest, fields of corn and soy beans and chicken farms to suburban areas to the intensive development in Ocean City. Water Quality Isle of Wight Bay waterways are not meeting their designated uses primarily due to nutrient, dissolved oxygen, fecal coliform problems. Available information indicates that nonpoint sources of pollution are generally the origin of these problems. Tidal waters in the vicinity of current shellfish harvesting closures have experienced water quality problems over about twenty years: St. Martin River and its tributaries, and the area of Herring and Turville Creeks. High nutrient levels are contributing to algae blooms and general growth levels that inhibit growth of submerged aquatic vegetation (SAV). Nontidal tributaries to the St. Martin River exhibited high levels of nutrients arising from nonpoint sources in several subwatersheds in Maryland and Delaware. Low dissolved oxygen levels were found at about half of the sites sampled in June Buntings Branch exhibited high nutrient concentrations and loads. In Church Creek, high conductance (a measure electrical resistance) appears to be a point source related problem. Anticipated efforts during 2001 to estimate nutrient loads associated with shoreline erosion and to determine Total Maximum Daily Loads (TMDL) will likely improve understanding of water quality problems and nonpoint nutrient loads significantly. Land Use Land use is an important factor affecting nonpoint source pollution in the Isle of Wight Bay watershed. Within Maryland, agriculture and forest land use categories each covered about 37% of the watershed in Of the approximately 12,500 acres of agricultural land in the watershed, 94% is used for row crops and 1% is occupied by numerous feeding operations (primarily chicken houses). iv
8 Urban land uses covered about 23% of the watershed in Expansion of urban lands can be anticipated even though only about 20% of the watershed falls within Smart Growth Priority Funding Areas. Worcester County s recent Worcester 2000 planning effort will be used to assist local growth management through the comprehensive planning process. About 1% of land in the watershed has some form of protection from conversion urban land uses via conservation ownership, easement, etc. Natural habitat in the watershed includes several small areas of state-significance as part of Maryland s Green Infrastructure including the Isle of Wight, the Longridge Swamp vicinity and a portion of Herring Creek s headwaters. Natural areas of local significance may include a Wetland of Special State Concern near West Ocean City and a portion of the riparian corridor on Church Creek. The only protected land in the natural habitat areas noted here is the Isle of Wight (State Wildlife Management Area). Living Resources and Habitat Tidal waters were found to have healthy fish populations compared to other Lower Eastern Shore waterways assessed. The Isle of Wight Bay monitoring for toxic Pfiesteria and the organism that causes Brown Tide did not find harmful conditions between 1998 and Assessment of algae populations in the upper tidal reaches of the St. Martin River identified summer dominance by bluegreen algae, which demonstrates the local eutrophication problem. This finding is consistent with eutrophic conditions including high nutrient concentrations. Open waters of the Isle of Wight Bay exhibited the least algae growth as measured by chlorophyll a. In streams, nontidal fish populations are limited to species that are tolerant or moderately tolerant to pollution. Assessment of bottom-dwelling bugs living in streams (macroinvertebrate benthic organisms) indicates that overall water quality conditions are poor compared to other watersheds in the State. Macroinvertebrate populations and habitat assessment in St. Martin River tributaries found that healthier communities tended to be in larger streams and that stressed communities tended to be in upper watershed streams having little flow and impaired habitat. Submerged Aquatic Vegetation (SAV) covers less than 10% of its potential habitat in the Isle of Wight Bay watershed. Algae growth appears to be inhibiting SAV in restricted tidal water areas including the St. Martin River based on interpretation of chlorophyll a concentrations. The exception to this finding is the Isle of Wight Bay which exhibited algae growth that should not inhibit SAV. Restoration Targeting Tools A stream corridor assessment completed in 1999 identified numerous restoration opportunities including riparian areas with unforested stream buffers, stream bank erosion, etc. Additional stream corridor assessment is scheduled for winter 2000/2001. Computerized mapping was used to demonstrate techniques and to help target site investigations for potential stream buffer and wetland restoration. Opportunities were also identified to address 12 known fish blockages and to reduce overboard sewage discharge from boats using marina pumpout facilities. v
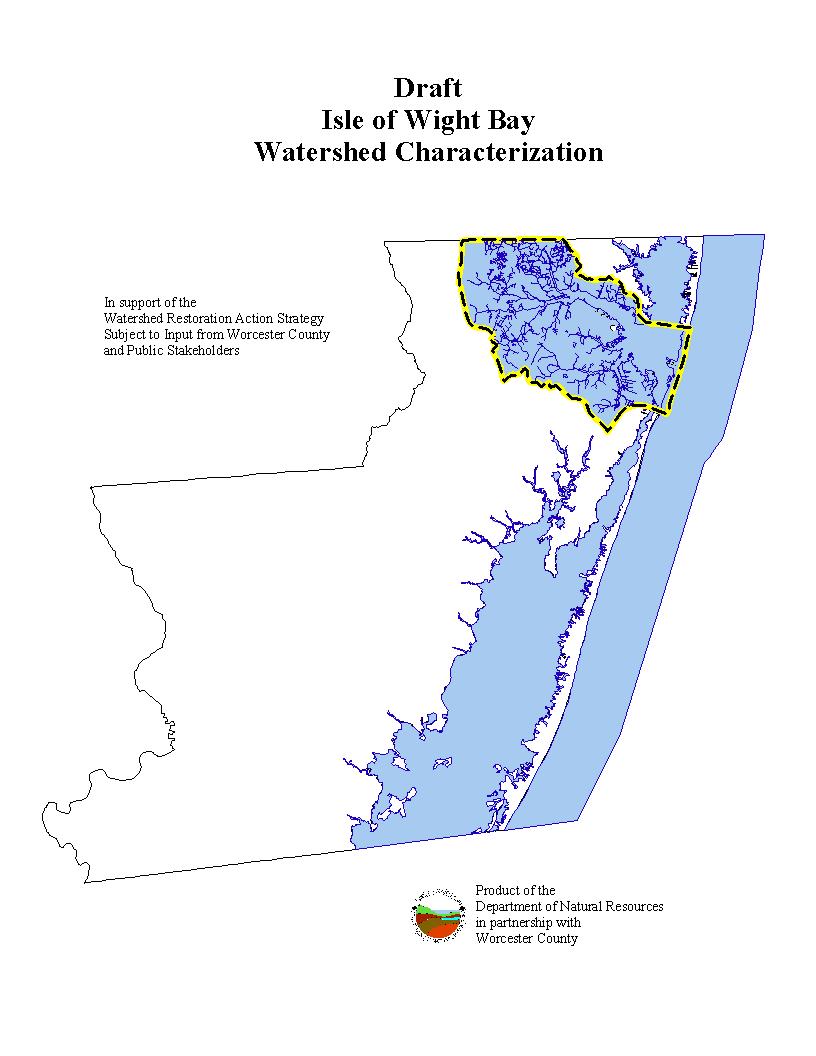
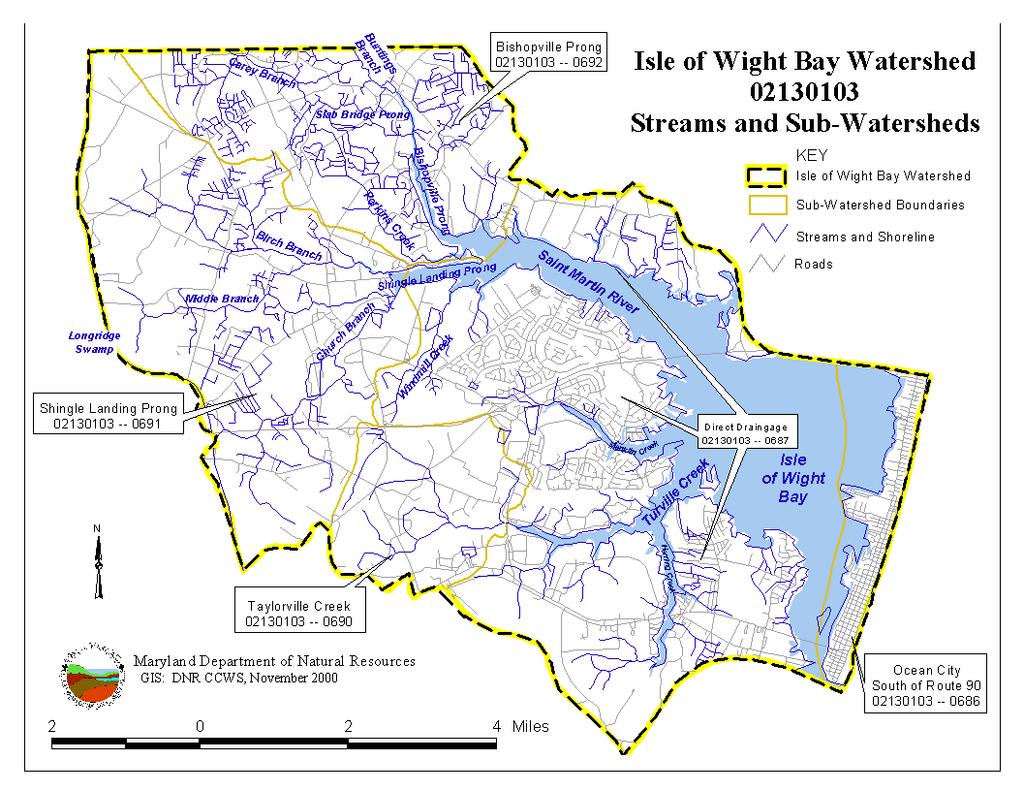
9 INTRODUCTION Watershed Selection Maryland s Clean Water Action Plan, completed in 1998, identified water bodies that failed to meet water quality requirements. As part of the State s response, the Maryland Department of Natural Resources (DNR) is offering funding and technical assistance to Counties willing to work cooperatively to devise and implement a Watershed Restoration Action Strategy (WRAS) for the impaired water bodies. Worcester County, which is one of five counties participating in the first round of the WRAS program. has selected the Isle of Wight Bay Watershed for restoration. Location The majority of the Isle of Wight Bay watershed is in Worcester County, Maryland. This area is the focus of the Watershed Restoration Action Strategy and this Watershed Characterization. The WRAS Project Area Map and the Streams and Sub-Watersheds Map show the geographic location of the watershed in Maryland and selected features within it. In addition, about 16% of the watershed is in the State of Delaware. Also see the technical supplement Delaware s Bunting Branch Watershed. 32 Purpose of the Characterization Isle of Wight Bay Watershed Acreage Summary Area Land Water Total Maryland 33,611 7,509 41,120 Delaware 6, ,300 Watershed Total 39,911 7,509 47,420 One of the earliest steps toward devising a Watershed Restoration Action Strategy is to characterize the watershed using immediately available information. This Watershed Characterization is intended to meet several objectives for this purpose: briefly summarize the most important or relevant information and issues provide preliminary findings based on this information identify sources for more information or analysis suggest opportunities for additional characterization and restoration work. Page 1
10 Additional Characterization Recommended The Watershed Characterization is intended to be a starting point. It is part of a framework for a more thorough assessment involving an array of additional inputs: self-investigation by the local entity targeted technical assistance by partner agencies or contractors input from local stakeholders Stream Corridor Assessment, i.e. physically walking the stream and cataloguing issues, which is part of the technical assistance offered by DNR Synoptic water quality survey, i.e. a program of water sample analysis, can be used to focus on local issues like nutrient hot spots or point source discharges or other selected issues. This is also part of the technical assistance offered by DNR. Identifying Gaps In Information It is important to identify gaps in available watershed knowledge and gauge the importance of these gaps. One method is to review available information in the context of four physical / biological assessment categories that have been successfully applied in other watershed restoration efforts. The main categories that impact aquatic biota are listed here: Habitat: physical structure for stream stability and biotic community (including riparian zone) Water Quantity: high water - storm flow & flooding; low water - baseflow problems from dams, water withdrawals, reduced infiltration Water Quality: water chemistry; toxics, nutrients, sediment, nuisance odors/scums, etc. Cumulative effects associated with habitat, water quantity and water quality. Adaptive Management The Watershed Characterization and the Watershed Restoration Action Strategy should be maintained as living documents within an active evolving restoration process. These documents will have to be updated periodically as new, more relevant information becomes available and as the watershed response is monitored and reassessed. This approach to watershed restoration and protection is often referred to as adaptive management. Page 2
11
12
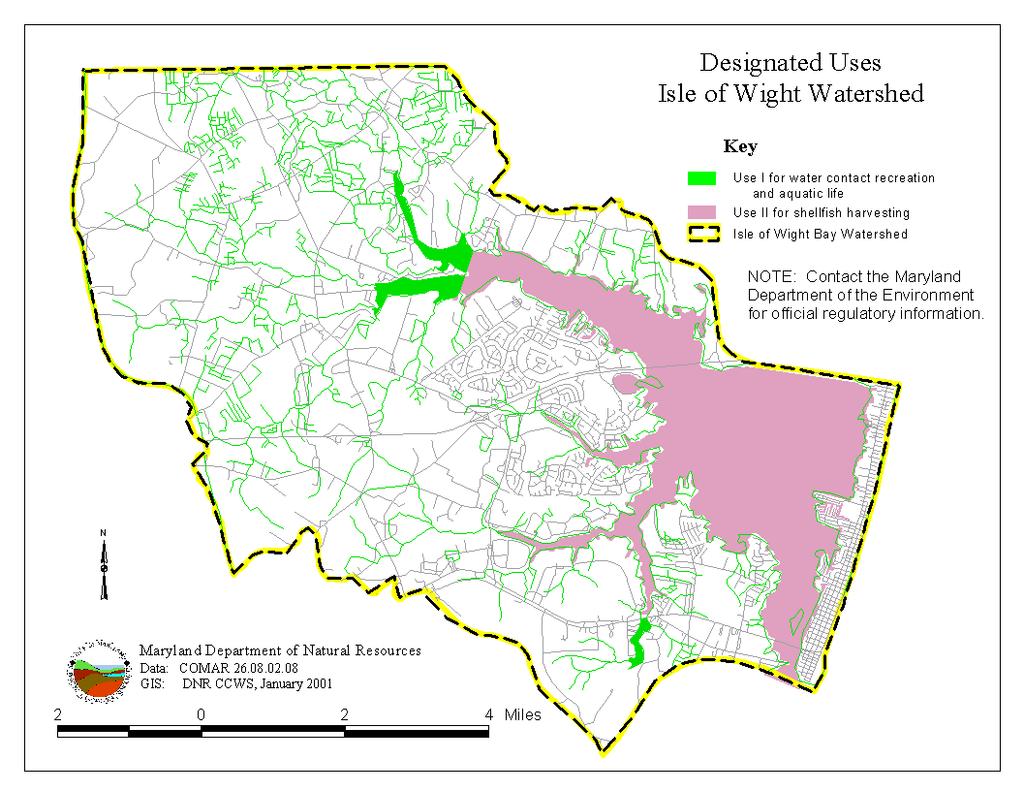
13 WATER QUALITY Introduction Reducing or eliminating areas of poor water quality in the Isle of Wight Bay watershed is the motivation behind generating a Watershed Restoration Action Strategy. A regulatory definition for poor water quality are waters that fail to meet the Water Quality Criteria Specific to Designated Uses listed in COMAR More generally, poor water quality may be considered waters that are unhealthful or objectionable for human use or for supporting desirable aquatic species. Nearly all aquatic life requires certain levels of water quality to survive. Tracking the current status or changes in water quality can be measured in many ways including changes in water use capabilities, dissolved oxygen concentration, nutrient loads, the presence of selected aquatic species (indicator organisms) and other measurements. In addition, water quality is intimately related to use of land and water, and the health of living resources and their habitat. Therefore, it is valuable to consider water quality improvement in the context of these relationships and its effects on other factors that determine the quality of life available within the watershed. Designated Uses All waters of the State are assigned a Designated Use in State regulation, COMAR , which is associated with a set of water quality criteria necessary to support that use. A simplified summary of the Designated Uses in the Isle of Wight Bay watershed is listed below. The Designated Uses Map shows these areas Use I: for water contact recreation and aquatic life: All waters not designated as Use II - Use II: for shellfish harvesting all tidal waters except: Bishopville Prong and tributaries above confluence with St. Martin River. Shingle Landing Prong and its tributaries above confluence with St. Martin River at Piney Island. Herring Creek and its tributaries upstream of Rt. 50. Notes: The Department of the Environment should be contacted for official regulatory information. Use I criteria apply as minimum standards to all Waters of the State. Criteria for other Designated Use categories add additional restrictions beyond the Use I minimum. Exclusion of tidal waters from shellfish harvesting (Use II) is typically related to monitored levels of fecal coliform bacteria counts in these waters that exceed the State criteria. Page 5
14 Not Supporting Designated Use 303(d) Listings Significant portions of the Isle of Wight Bay waters either do not support their designated use or partially do not support their designated use. 2 As required under Section 303(d) of the Federal Clean Water Act, Maryland tracks waterways that did not support their designated use in a prioritized list of Water Quality Limited Basin Segments sometimes simply called the 303(d) list. The Isle of Wight Bay watershed is referenced in the list for nutrients, dissolved oxygen, fecal coliform. In the (d) list, the Isle of Wight Bay is listed along with the other Maryland Coastal Bays as Priority #13. The problems that led to the 1996 listing were believed to be arising from nonpoint and natural sources. (Also see the section on point sources regarding in-stream conductivity issues.) Page 6
15 What Are the Effects of Nutrient Over-Enrichment? National Academy Press, Clean Coastal Waters (2000) 25 The productivity of many coastal marine systems is limited by nutrient availability, and the input of additional nutrients to these systems increases primary productivity [microscopic organisms including algae]. In moderation in some systems, nutrient enrichment can have beneficial impacts such as increasing fish production. However, more generally the consequences of nutrient enrichment for coastal marine ecosystems are detrimental and related to eutrophication. The increased productivity from eutrophication increases oxygen consumption in the system and can lead to low-oxygen (hypoxia) or oxygen-free (anoxic) water bodies. This can lead to fish kills as well as more subtle changes in ecological structure and functioning, such as lowered biotic diversity and lowered recruitment of fish populations. Eutrophication can also have deleterious consequences on estuaries even when low-oxygen events do not occur. These changes include loss of biotic diversity, and changes in the ecological structure of both planktonic and benthic communities, some of which may be deleterious to fisheries. Seagrass beds and coral reefs are particularly vulnerable to damage from eutrophication and nutrient over-enrichment. Harmful algal blooms (HABs) harm fish, shellfish, and marine mammals and pose a direct public health threat to humans. The factors that cause HABs remain poorly known, and some events are entirely natural. However, nutrient over-enrichment of coastal waters leads to blooms of some organisms that are both longer in duration and of more frequent occurrence. Although difficult to quantify, the social and economic consequences of nutrient over-enrichment include aesthetic, health, and livelihood impacts. Page 7
16
17 Water Quality Indicators The Maryland Clean Water Action Plan published in 1998 listed the water quality indicators for the Isle of Wight Bay summarized in the table below. 3 The Isle of Wight Bay is also identified in the Plan as a Category 1 Priority Watershed in need of restoration during the next two years. Compared to other watersheds in Maryland, this watershed exhibits relatively poor tidal habitat and exhibits tidal eutrophication common among comparable watersheds. Water Quality Indicator Finding Rank Bench Mark State 303(d) Impairment Number 1 Fail 1" means that restoration is needed. This watershed is included in the 303d list Tidal Habitat Index category 1 Fail 138 watersheds in Maryland were ranked on a scale of 1 (worst) to 10 (best). 25% of the watersheds, (34) failed to meet standards for this index. Tidal Eutrophication Index category 2 Pass 138 watersheds in Maryland were ranked on a scale of 1 (worst) to 10 (best). 75% of the watersheds, (104) passed the standards for this index. See Interpreting Water Quality Indicators for more information. Page 9
18 Interpreting Water Quality Indicators State 303(d) Impairment Number. This number is used to characterize watersheds relative to regulatory requirements of the Federal Clean Water Act. It is based on numerous water quality-related factors that are tracked by the State of Maryland under these federal requirements. Tidal Habitat Index. This index uses selected water quality parameters to gauge habitat quality for aquatic life like fish. Category 1 means that the Isle of Wight watershed needs restoration because its tidal habitat ranked in the lowest 25% of the 138 Maryland watersheds that were compared. This finding was developed using data from , measurements of surface chlorophyll a, secchi depth and summer (July-September) bottom dissolved oxygen were each ranked on a scale of 1 (most degraded) to 10 (best condition). These individual ranks were combined to create the single index. Reporting for Coastal watersheds differs from reporting for Chesapeake Bay watersheds in that the index was then translated into a category. Tidal Eutrophication Index. Eutrophication, as used here, refers to relative levels of nutrients and suspended solids in an aquatic system. The Finding of Category 2 means that the Isle of Wight watershed needs action to prevent degradation of current conditions. Using data from , measurements of surface mixed layer total nitrogen, total phosphorus and total suspended solids were each ranked on a scale of 1 (most degraded) to 10 (best condition). These individual ranks were combined to create the single index. Reporting for Coastal watersheds differs from reporting for Chesapeake Bay watersheds in that the index was then translated into a category. Page 10
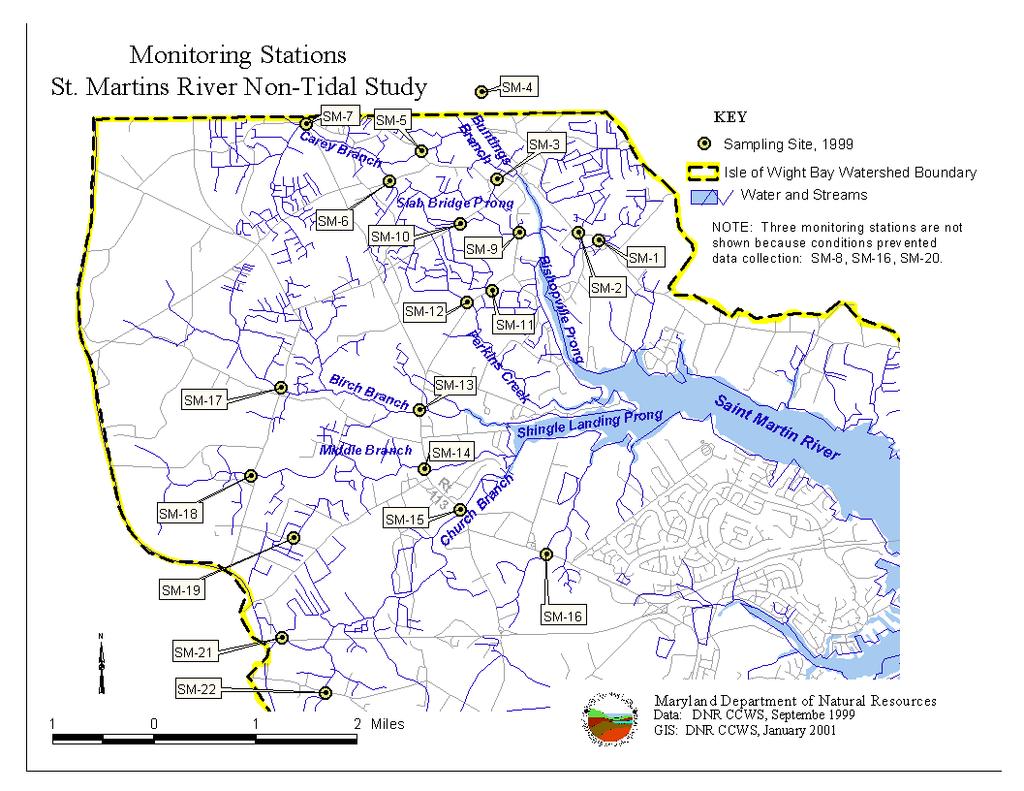
19 Water Quality Assessment A systematic and thorough assessment of water quality in the Isle of Wight watershed has not been conducted. However, several recent water quality assessment efforts summarized here are valuable in attempting to gauge conditions in the watershed. DNR recently reviewed the State s water quality monitoring reports from 1976 through 1999 for the Coastal Bay watersheds. Of the four areas that consistently had water quality problems, two were within the Isle of Wight Bay watershed: 28 St. Martin River and its tributaries Herring / Turville Creeks area 1. St. Martin River Tributaries Currently, the entire St. Martin River is closed to shellfish harvesting. 39 This closure is based on periodic monitoring that is consistently finding high fecal coliform bacteria levels. In 1999, water quality monitoring at 19 sites in the nontidal streams of the St. Martin River watershed identified several issue areas that are also addressed in other sections of the Characterization. The problems identified are related primarily to nonpoint sources. These sites are shown on the Monitoring Stations Map: 24 SM-1: Unnamed tributary at St. Martin Neck Road (phosphorus and nitrogen concentrations) SM-4: Buntings Branch at Delaware Route 54 in Selbyville (nitrogen load) SM-13: Birch Branch (nutrient concentrations and loads) SM-15: Church Branch at Route 113 (phosphorus and nitrogen loads, conductance) 2. Data Sources Maryland s Coastal Bays are the focus of numerous programs to monitor water quality. DNR has collected an extensive listing that can serve as a directory of potential information sources. 18 For example in the St. Martin River, in recent years the DNR (RAS MANTA program) has conducted water quality and habitat sampling at 16 sites to identify long term trends and/or to track conditions related to Pfiesteria. Much of this and other water quality-related data is available via the Internet. Two recommended Web sites are and Historical water quality data exist for some tidal areas in the Isle of Wight Bay watershed as listed below: St. Martin River Water Quality Survey 1983 St. Martin River Survey 1992 St. Martin River Survey Historical water quality data for some free flowing streams in the Isle of Wight Bay watershed is available beginning in the late 1970s. Data are primarily in-stream physical measurements for dissolved oxygen, ph, conductivity and temperature. 36 Page 11
20
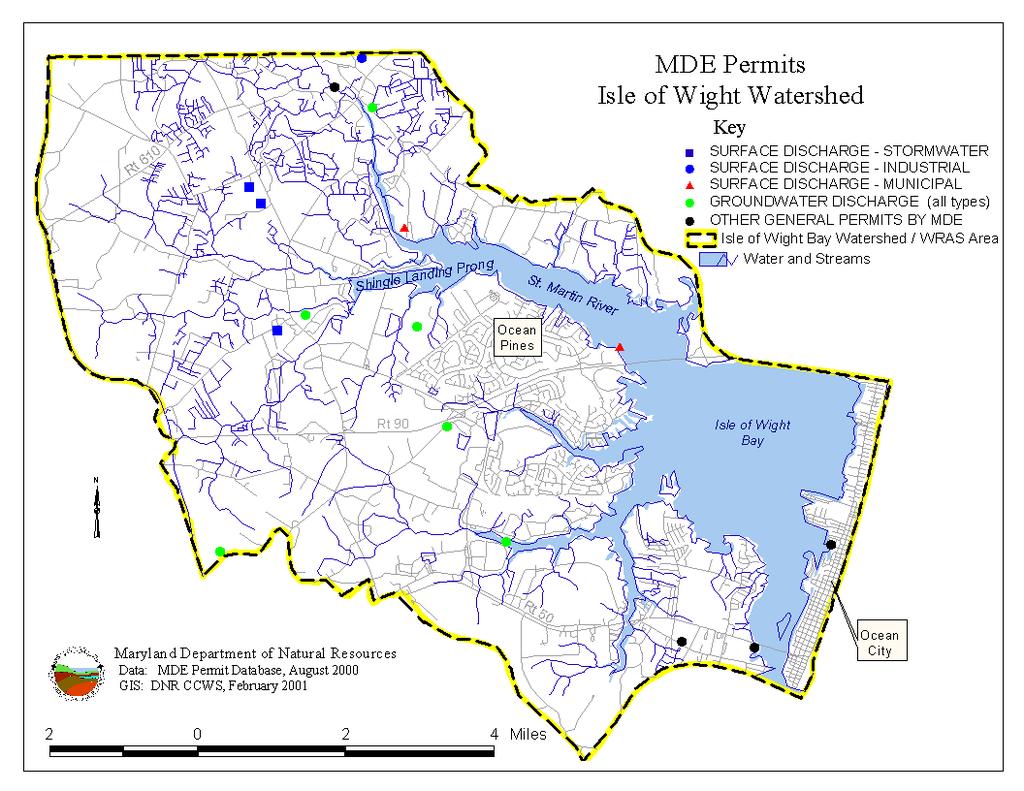
21 3. Total Maximum Daily Loads 17 Maryland s northern coastal bays, including the Isle of Wight Bay, have significant nutrient loads that contribute to these areas not meeting water quality standards. As a step toward controlling nutrients loads to these waters, the Maryland Department of the Environment (MDE) is developing Total Maximum Daily Loads (TMDL). A draft TMDL for the Northern Coastal Bays including the Isle of Wight Bay and the Assawoman Bay, is anticipated to available in late Information on the TMDL program and schedule is available at Point Sources Discharges from discrete conveyances like pipes are called point sources. Point sources may contribute pollution to surface water or to groundwater. For example, waste water treatment discharges may contribute nutrients or Biological Oxygen Demand (BOD) that reduce oxygen available for aquatic life. Stormwater discharges may contribute excessive flow of water and/or seasonally high temperatures. Industrial point sources may contribute other forms of pollution. Some understanding of point source discharges in a watershed targeted for restoration is useful in helping to prioritize potential restoration projects. According to the Maryland Department of the Environment (MDE) permit data base summarized in following table and MDE Permits Map, there are four permitted surface water discharges and seven permitted groundwater discharges in the Isle of Wight Bay watershed. Characteristics of these discharges (volume, temperature, pollutants, etc.) are tracked by MDE through the permit system. Most of this information is public and can be obtained from MDE. Compliance information for point sources in the Isle of Wight Bay watershed has not been assembled for the Watershed Characterization. However, DNR information suggests that two point source discharges are causing water quality impacts: The 1999 synoptic water quality survey of St. Martin River tributaries by DNR identified extremely high conductance in Church Branch at Route 113. (Conductance is a measure of resistance to electrical flow.) Previous monitoring in this stream indicates that this is an on-going issue. Because nonpoint sources generally do not create high conductance in streams, this finding suggests that a point source discharge problem is affecting the stream. 24 Anecdotal information indicates that, although the Selbyville Waste Water Treatment Plant now discharges to the Atlantic Ocean, overflows and other types of discharges have reached Maryland waters generating local complaints. 36 Water quality problems associated with point sources will be addressed in detail in the soon to be released Total Maximum Daily Load (TMDL). Currently, no information is available suggesting that point sources are associated with nutrients, dissolved oxygen or fecal coliforms problems in the Isle of Wight Bay watershed. Page 13
22
23 Point Source Summary Isle of Wight Bay Watershed (8/2000 data) Discharge Type / MDE Permit Category Facility Name NPDES Permit / MD Code Receiving Stream / Location Surface Water / Waste Water Treatment Plant (WWTP) Ocean Pines (County Operated) Riverview Mobile Homes (private) MD DP0708 MD DP2982 St. Martin River (ADC 4H11) Bishopville Prong (ADC 3K5) Surface Water / Industrial Perdue Farms, Inc. Showell Processing Plant MD DP0051A Unnamed tributary of Church Branch / Shingle Landing Prong (ADC 3E12) Perdue Farms, Inc. Bishopville Hatchery MD DP0814 Unnamed tributary of Buntings Branch (ADC 3H1) Groundwater / Waste Water Treatment Plant (WWTP) Beach Club Golf Links 95DP3167 ADC 7D5 Lighthouse Sound 95DP3155C N/A (ADC ) Riddle Farm 96DP2710A ADC 8C9 River Run 99DP2394 ADC 4A10 Groundwater / Industrial Perdue Farms, Inc. Showell Hatchery 93DP2555 N/A (ADC 3D9) Kary Asphalt, Inc. 97DP2881 N/A (ADC 3J4) Shuler s Car Wash 99DP3290 ADC 7K3 General Industrial Stormwater Permit Gumm Pit 97SW0929 inactive borrow pit Kary Asphalt, Inc. 97SW0836 (see above) Perdue Farms, Inc. 97SW0732 Showell Processing Plant (see above) Perdue Farms, Inc. 97SW0733 Bishopville Hatchery (see above) Several categories of MDE permits and/or point source discharges located in the Isle of Wight Bay watershed are not listed in the point source table. Four General Permits (marinas, etc.) Point sources in the watershed that have outfalls located in the Atlantic Ocean are not listed. This includes the Ocean City Wastewater Treatment Plant and three point sources located in Delaware (Mt. Aire WWTP, Selbyville WWTP, and South Coastal WWTP.) Delaware point sources in general are not in the table. Of these, only one has its outfall located in the Isle of Wight Bay watershed Mt. Aire Stormwater discharge. This discharge will be addressed in the TMDL. Page 15
24 Nonpoint Sources Nonpoint sources of nutrients are generally believed to be significant contributors to ambient water quality problems in the Isle of Wight Bay based on various assessments. Some sources have reported that Nonpoint Sources (NPS) account for over 90% of the nutrients entering Maryland s Coastal Bays. 1. St. Martin River Watershed Assessment In 1999, water quality samples where collected in tributaries to the St. Martin River during the period March 3 through September For the 19 subwatersheds sampled, water quality problems associated primarily with nonpoint sources were identified for nutrients and dissolved oxygen: In June, dissolved oxygen concentrations failed to meet the Class I water quality standard of 5.0 mg/l in eight sampling sites, seven sites met the standard and four sites had no water. Samples taken in April were significantly better with 18 sites above the standard and one site below the standard. On a per acre basis, total nitrogen loads were highest in the upper Buntings Branch watershed including Delaware drainage. In this area, the highest total nitrogen and total phosphorus concentrations tended to be in Spring. This finding is consistent with nonpoint nutrient sources during the typical high flows of the season. Four sampling sites list below were identified as having the high nutrient concentrations (ranked highest to lowest concentration.) The report noted that the concentrations measured where high enough to have water quality impacts but were also similar to those found in other agricultural watersheds on the Eastern Shore: - SM-1: Unnamed tributary at St. Martin Neck Road was the highest - SM-4: Buntings Branch at Delaware Route 54 at Selbyville - SM-15: Church Branch at Route SM-13: Birch Branch at Route 113 and at Campbelltown Road. 2. Stream Bank Erosion Anecdotal information on loss of navigability in the protected waters of the Isle of Wight Bay watershed suggests that sedimentation from upland sources has been significant. 11 Extensive areas of the watershed are drained by ditches which may tend to enhance transport of sediment. However, estimates of pollutant loads contributed by stream bank erosion have not been generated. In the 1999 assessment of streams in the St. Martin River watershed, five areas of stream bank erosion were identified totaling about 550 feet in length. 23 One mechanism that may assist in addressing this issue is already in place in the Coastal Bays Navigation and Dredging Advisory Group (NADAG). 16 Page 16
25 3. Shoreline Erosion Erosion of shorelines can contribute significantly to nonpoint source pollution in tidal waters in the form of nutrients (mostly phosphorus) and sediment (particles that cause water column turbidity and habitat loss.) Wherever land and open water meet, change in the form of erosion or accretion of land is typically the inevitable result of natural processes. Human activity in these areas either tends to inadvertently accentuate these natural processes or purposefully attempts to control movement of water and/or loss of land. Estimates of shoreline erosion for Maryland s Lower Eastern Shore indicate that more than 25% of Worcester County s shorelines are eroding. 8 For the Isle of Wight Bay watershed, the Maryland Geological Survey (MGS) calculated the average rate of shoreline change: acres of land lost for the period 1850 to 1989, or; On average, one (1) acre of land lost per year for that 139 year period. Considering the average rate of shoreline change in the watershed (8-digit), erosion in the Isle of Wight Bay basin is relatively slow compared to the Assawoman Bay basin. This difference appears to be associated with two factors: 9 Percent of shoreline that is protected: Isle of Wight 44%, Assawoman Bay 21% Percent of vegetated / marsh shoreline: Isle of Wight 35%, Assawoman Bay 72% Maps of historic shoreline change were produced in 1999 by the MGS in a cooperative effort between DNR and the National Oceanic and Atmospheric Administration (NOAA). In the Isle of Wight Bay, the maps include digitized shorelines for the years 1850, 1942, 1961, and The maps show that extensive changes have occurred adjacent to all large bodies of open water including the Isle of Wight Bay and the St. Martin River. They also indicate that erosion rates are much less adjacent to smaller water bodies. Copies of these 1:24000 scale maps are available from the MGS. Future shoreline change may accelerate due to change in sea level. Sea level in the Maryland Coastal Bay area is projected to rise about 0.5 feet by the year Projections suggest that land adjacent to large bodies of water will erode significantly in coming decades. 4. Nutrient Loads from Shoreline Erosion to be Estimated An assessment of nutrient loading from shoreline erosion in Maryland s Coastal Bays is projected for completion by October This project is a cooperative study by the MGS and the University of Maryland, Horn Point Laboratory under a Coastal Zone Management grant. Products from the study will include several categories of data: 35 Volumes of eroding sediments by sediment type Loadings from various types of shorelines (based on erosion rates, geology, geomorphology, etc.) for nutrients (carbon, nitrogen, and phosphorus) and metals ( cadmium, chromium, copper, iron, manganese, nickel, lead and zinc) Biotic nutrient loadings from several marsh types based on vegetation (plant assemblages) Page 17
26 5. Stormwater It is probable that local areas in the Isle of Wight Bay watershed are affected by stormwater runoff. Typical affects of inadequately controlled or managed stormwater discharges include high intensity flows, erosion, sedimentation, stream bank erosion and related problems. Very little information is available to characterize the relative importance of this nonpoint source issue for the Isle of Wight Bay watershed. For example, is it known that all stormwater runoff from Ocean City, Ocean Pines and other developed areas of the watershed are directed to the Isle of Wight Bay. However, as the point source discussion indicates, stormwater permits have been issued to four industrial facilities but no other stormwater permits have been issued as of August No other information is available. Page 18
27 LAND USE In The Isle of Wight Bay Watershed Of the nearly 40,000 acres of land in the Isle of Wight Bay watershed, about 84% is in Maryland and about 16% is in Delaware. Overall, Maryland s portion of the watershed is more urban and projected urban growth is anticipated to be concentrated in Maryland. The watershed characterization presented here concentrates on the Maryland portion of the watershed. Also see the technical report Delaware s Bunting Branch Watershed. 32 Land Use in the Isle of Wight Bay Watershed 40 Delaware Maryland Category Acres Percent Acres Percent Agriculture not reported 46 12, Forest not reported 41 12, Urban not reported 9 7, Other not reported 4 1,008 3 Total By State 6, , Total for Watershed: 39,911 acres Page 19
28 Landscape Indicators Water quality, particularly in streams and rivers, is affected by the land in the riparian area and throughout the watershed. In an effort to gauge the affects of land use on water quality, and to allow comparison between watersheds, DNR has developed a series of Landscape Indicators. These indicators can be used to portray landscape conditions at a watershed scale that tend to support good water quality or that tend to degrade water quality. The Maryland Clean Water Action Plan published in 1998 listed landscape indicators for the Isle of Wight Bay as summarized in the table below. 3 Most indicator ranking (pass / fail) is a relative measure that compares the Isle of Wight Bay watershed with the other 137 watersheds of similar size that covers the entire State of Maryland. Landscape Indicator Finding Rank Bench Mark Impervious Surface 6.9 % of watershed is impervious Pass Of 138 watersheds in Maryland, this one is among the lower 75% Population Density 0.11 people per acre Pass Of 138 watersheds in Maryland, this one is among the lower 75% Historic Wetland Loss Density Unforested Stream Buffer acres Fail Of 138 watersheds in Maryland, this one is among the highest 25% 44 percent Pass Of 138 watersheds in Maryland, this one is among the lower 75% Soil Erodibility 0.23 value per acre Pass Of 138 watersheds in Maryland, this one is among the lower 75% See Interpreting Landscape Indicators for more information. Page 20
29 Interpreting Landscape Indicators Impervious Surface. Reduction of impervious area can be a valuable component of a successful Watershed Restoration Action Strategy (WRAS). Roads, parking areas, roofs and other human constructions are collectively called impervious surface. Impervious surface blocks the natural movement of rain into the ground. Unlike many natural surfaces, impervious surface typically concentrates stormwater runoff, accelerates flow rate and directs flow to the nearest stream. Sideeffects of impervious surfaces become increasingly significant as the percentage of impervious area increases. Examples include reduction of groundwater infiltration, soil and stream bank erosion, sedimentation, destabilization or loss of aquatic habitat, and flashy stream flows (reduced flow between storms and excessive flows associated with storms). Population Density. While changing population density may be beyond the scope of a WRAS, directing growth is a potential WRAS component. Humans are usually very successful in competing for use of land and water. As human population increases, effects of human activity tend to degrade water quality and to displace or eliminate natural habitat. Watersheds with higher populations, assuming other factors are equal, tend to exhibit greater impacts on waterways and habitat. However, growth can be directed in ways to reduce negative impacts. Historic Wetland Loss Density. About 39% of the Isle of Wight Bay watershed is hydric soil (about 16,000 out of 41,000 acres). The historic wetland loss estimate is based on the assumption that the hydric soils were all, at one time, wetlands. Thoughtful, selective restoration of historic wetland areas can be an effective WRAS component. In most of Maryland s watersheds, extensive wetland areas have been converted to other uses by draining and filling. This conversion unavoidably reduces or eliminates the natural functions that wetlands provide. These functions include habitat and nursery areas for many aquatic organisms, buffering floods, and uptake and redistribution of nutrients. In general, watersheds exhibiting greater wetland loss tend to also exhibit greater loss of the beneficial functions that wetlands provide. Strategic replacement of wetlands can significantly improve natural function in local watershed areas. Unforested Stream Buffers. The finding listed in the table means that 44% of the blue line streams (excluding shoreline) in the watershed do not have sufficient stream buffers to promote high quality stream habitat. DNR recommends that forested buffer 100 feet wide, i.e. natural vegetation 50 feet wide on either side of the stream, is typically necessary to promote high quality aquatic habitat and diverse aquatic populations. Restoration of natural vegetation adjacent to streams can be a valuable and relatively inexpensive WRAS element. In most of Maryland, trees are key to healthy natural streams. They provide numerous essential habitat functions: shade to keep water temperatures down in warm months, leaf litter food for aquatic organisms, roots to stabilize stream banks, vegetative cover for wildlife, etc. In general, reduction or loss of riparian trees / stream buffers degrades stream habitat while replacement of trees / natural buffers enhance stream habitat. Soil Erodibility. A finding of 0.23 means that the Isle of Wight Bay watershed has moderate soil erodibility considering soils types, steep slopes and extent of cropland within 1000 feet of waterways. Watersheds with more easily erodible soils are naturally more susceptible to surface erosion, sedimentation, streambank erosion and other problems related to soil movement. These negative effects of soil erosion on water quality can be minimized through careful management. A WRAS can reasonably promote a reduction in disturbance of erodible soils and/or effective soil conservation practices like planting stream buffers. Page 21
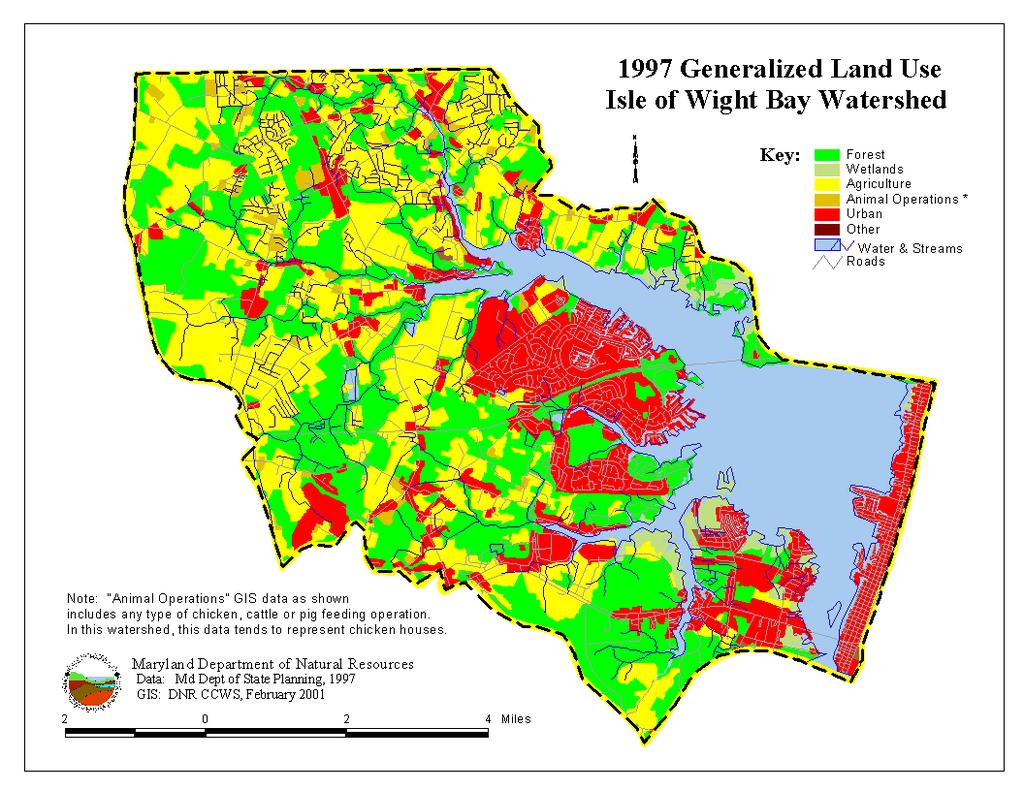
30 1997 Land Use The tables and pie chart show that forest and agriculture dominate the land use in the watershed in both States. Urban land is most significant in Maryland s portion of the watershed which is shown in the 1997 Generalized Land Use Map. Viewing these land uses as potential nonpoint sources of nutrients, as a category agriculture land uses are probably the greatest contributors of nutrients in the Isle of Wight Bay. This generalization is based on size (37% of the watershed, 12,463 acres) and the typical nutrient loads that tend to arise from agricultural land. For more details, see the nonpoint source discussion and the Land Use Technical Report Isle of Wight Bay Maryland Wetland and Beach Area 1997 Land Use Isle of Wight Bay Watershed (Md) Description Acres Tidal marsh, Emergent wetlands (Wetlands in pie chart) 899 Agriculture (37.20%) Urban (23.37%) Beaches and bare ground (not shown in pie chart) 109 Total for Maryland Other Land Use 1,008 Wetlands (2.68%) Forest (36.74%) Page 22
31
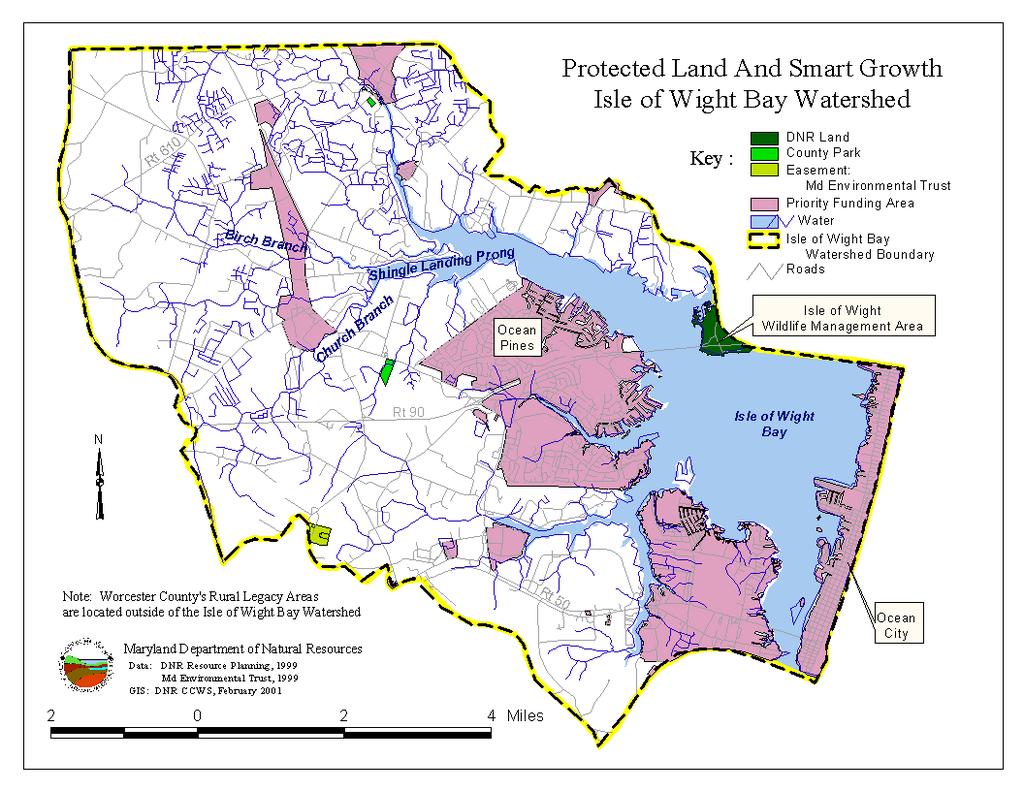
32 Growth Management in Worcester County 26 Worcester County is planning for growth consistent with the opportunities of Maryland s Smart Growth Program. The County has submitted a Priority Funding Areas map to the State that is consistent with the Program. The Protected Land and Smart Growth Map shows the Priority Funding Areas in the Isle of Wight Bay watershed (Worcester County s Rural Legacy Areas designated in the County are outside of the Isle of Wight Bay watershed). Last year the County launched Worcester 2000, an initiative with the goal of bringing the citizens of Worcester County together to create a consensus vision of the County s future. Citizens were asked to participate, through a series of workshops, in identifying the characteristics of Worcester County that are worth protecting as the County continues to develop, and to express preferences regarding the pattern and intensity of future development. Citizens were also asked for input on short and long-term strategies to implement the consensus vision. The final Worcester 2000 Report included results of the community visioning surveys, and a set of recommended changes to the comprehensive plan and the zoning and subdivision codes. The final report was presented to the County Commissioners by the project consultant on November 8, Recommendations include directing new growth to concentrated areas largely in the Isle of Wight Bay watershed, preserving farms and forests with a transfer of development rights program, and promoting protection of environmentally sensitive areas through incentive programs. The County will now use this information as it begins to update the County comprehensive plan and to generate the Watershed Restoration Action Strategy for the Isle of Wight Bay watershed. Other recent planning initiatives include adoption of the Route 50 Scenic and Transportation Corridor Plan, a scenic corridor protection initiative for Route 611, and the purchase of permanent easements on 2,500 acres of land in the Rural Legacy Area. The County is also working with the Maryland Coastal Bays Program to implement the Comprehensive Conservation and Management Plan for the Coastal Bays that was adopted in June Some of the work accomplished to date includes development of educational outreach materials and events, initiation of a septic system tracking program, and review and modification of the County s forest conservation law. Ocean City The area of Ocean City that lies between the Ocean City Inlet and Route 90, excluding the beach on the Atlantic Ocean, is entirely in the Isle of Wight watershed. As shown in the 1997 Generalized Land Use Map, urban land use covers this entire area except for an area of tidal wetlands interspersed along the Ocean City s western boundary. All the stormwater runoff generated by the impervious surfaces in Ocean City flow to the coastal bay side of the barrier island. 26 The density of the existing development will likely determine the extent and kind of stormwater management possible. Page 24
33 Green Infrastructure An additional way to interpret land use / land cover information is to identify Green Infrastructure. In the GIS application developed by Maryland DNR and its partners, Green Infrastructure refers to areas of natural vegetation and habitat that have statewide or regional importance as defined by criteria developed by DNR. The criteria for identifying of lands as Green Infrastructure is limited to considering natural resource attributes currently found on those lands. One example of the criteria is that interior forest and wetlands complexes at least 250 acres in size are considered as part of Green Infrastructure. As a second example, sensitive species habitat that is located within areas of natural vegetation at least 100 acres in size is also counted as Green Infrastructure. Other potential attributes of Green Infrastructure lands, such as ownership or if the current natural conditions are protected in some way, are not criteria for Green Infrastructure but they may be considered independently. Within the Green Infrastructure network, large blocks of natural areas are called hubs, and the existing or potential connections between them, called links or corridors. Together the hubs and corridors form the Green Infrastructure network which can be considered the backbone of the region s natural environment. 7 Protection of Green Infrastructure lands may be addressed through various existing programs including Rural Legacy, Program Open Space, conservation easements and others. An additional initiative targeted at Green Infrastructure called Green Print was proposed in January This proposed program would target State funds for protection of Green Infrastructure areas. The details of the Green Print initiative will be clarified during The Green Infrastructure in the Isle of Wight Bay watershed, as shown in the Green Infrastructure Map, exhibits several significant characteristics: In the map, which is part of a Statewide scenario, the majority of the watershed is not identified as a Green Infrastructure component. This is probably because most areas of natural vegetation in the watershed are smaller than 100 acres. This minimum size was selected to meet statewide interests for identifying Green Infrastructure of statewide or regional importance. In addition to this Statewide scenario, it may be valuable to identify Green Infrastructure that is important at the local watershed scale. Several Green Infrastructure hubs appear in the watershed that are concentrated in three areas: 1) the Isle of Wight Wildlife Management Area (WMA), 2) in the Turville / Herring Creek subwatershed and 3) an area of Shingle Landing Prong s headwaters running from Longridge Swamp down Birch Branch along the north side of Shingle Landing Prong and into the Assawoman Bay drainage area.. In the Isle of Wight watershed, the map shows one Green Infrastructure corridor connecting the hubs in the Shingle Landing Prong and Assawoman Bay subwatersheds. One way to interpret this view of the watershed is to suggest that protection and/or enhancement of the Isle of Wight Bay Green Infrastructure hubs could be considered as one component of the Watershed Restoration Action Plan. Page 25

34
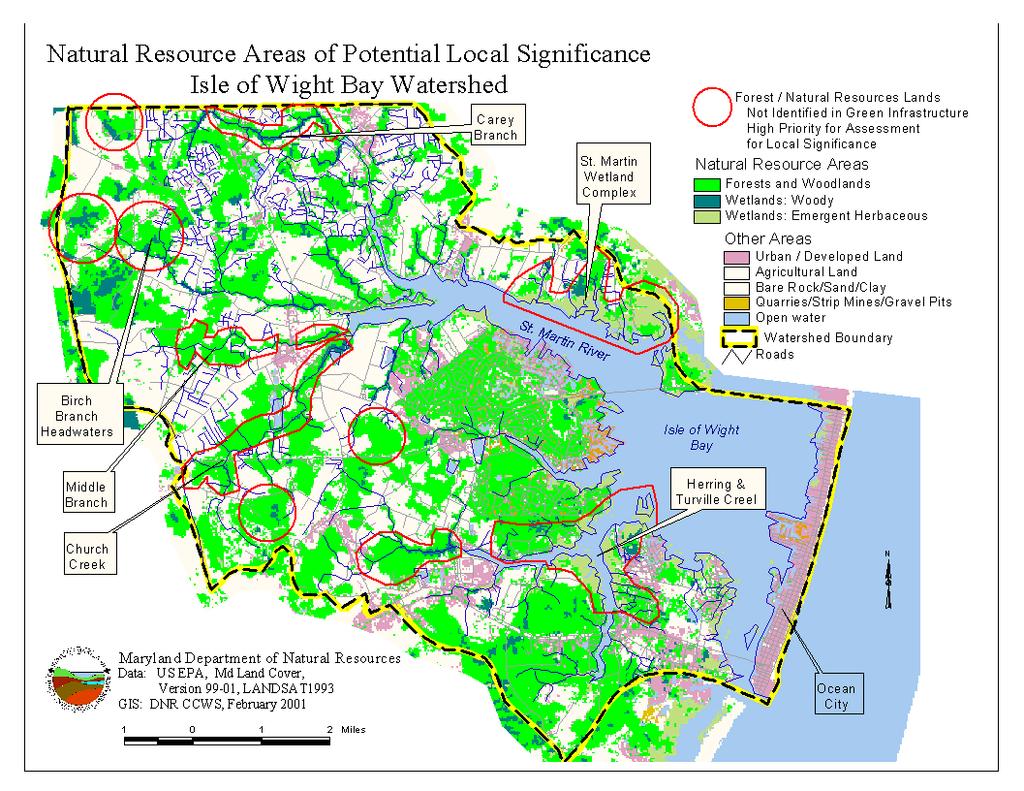
35 Natural Resource Areas At the Watershed Scale The Green Infrastructure Map, due to its Statewide and regional focus, may not identify natural resource areas that are locally significant. Therefore, it is reasonable to employ other information to help identify natural areas of potential local significance. For example, the 1999 stream corridor assessment work conducted in the Saint Martin River drainage area is one information source. DNR staff who assessed Church Branch report that it has significant riparian areas with natural vegetation intact. 23 This area, and perhaps others, could be considered Green Infrastructure important at the local watershed scale. Additional perspective is presented in the map Natural Resource Areas of Potential Local Significance. It uses land cover data LANDSAT satellite imagery to suggest areas for local consideration and investigation. The areas of forest and wetlands highlighted with red outlines on the map were too small to be identified as Green Infrastructure. However, the outlined areas appear to be relatively large blocks of forest and wetland at the watershed scale. Further assessment of these areas will be needed to determine if they exhibit natural resource values that are locally significant. Areas that may identified as locally significant may then be targeted for protection or enhancement through restoration projects targeted to adjacent lands. Page 27
36
37 Protected Lands Protected land, as used here, includes any land with some form of long term limitation on conversion to urban / developed land use. This protection may be in various forms: public ownership for natural resource or recreational intent, or private ownership where a third party acquired development rights or otherwise acquired the right to limit use through an easement purchase, etc. The extent of protection varies greatly from one circumstance to the next and it may be necessary to explore the details of land protection parcel by parcel through the local land records office. For purposes of watershed restoration, a knowledge of existing protected lands can provide a starting point in prioritizing potential restoration activities. In some cases, protected lands may provide opportunities for restoration projects because owners of these lands may value natural resource protection or enhancement goals. The following listing and the Protected Land and Smart Growth Map summarize the status of protected lands in the Isle of Wight Bay watershed. The vast majority of land in the watershed does not meet the definition of protected as applied in this assessment. Therefore, promoting opportunities available for private land owners to protect rural, agricultural and similar land values may be valuable in the Watershed Restoration Action Strategy. Local / County parks are concentrated in two areas: Bishopville Park and the Showell Recreation Area. DNR land in the watershed is limited to the southwestern half of the Isle of Wight Wildlife Management Area. One conservation easement area is located at the edge of the watershed north of Berlin. No agricultural easements have been identified in the Isle of Wight Bay watershed. Page 29
38 Smart Growth Maryland s Smart Growth program has two programs that should be considered as watershed restoration project priorities are established. In Rural Legacy Areas, protection of land from future development through purchase of easements (or in fee simple) is promoted. In Primary Funding Areas, State funding for infrastructure may be available to support development and redevelopment: - Rural Legacy Areas. Located in the southern portion of the County, not in the Isle of Wight Bay watershed. - Priority Funding Areas. Several are in the Isle of Wight Bay watershed as shown on the Protected Land and Smart Growth Map. In Priority Funding Areas, new development and/or redevelopment may be anticipated. Planning for watershed restoration projects in Priority Funding Areas, or downstream of them, needs to account for potential changing conditions during the life of the project. For example, increasing impervious area may alter stormwater conditions that a watershed restoration project will have to adequately address. Page 30
39
40 Soils of the Isle of Wight Bay Watershed 1. Interpreting Local Conditions with Natural Soil Groups Soil conditions, like soil type and moisture conditions, greatly affect how land may be used and potential for vegetation and habitat on the land. Soil conditions also one determining factor for water quality in streams and rivers. Local soil conditions vary greatly from site to site as published information in the Soil Survey for Worcester County shows. This complicated information can be effectively summarized using Natural Soil Groups to help identify useful generalizations about groups of soils. In the Soils Map and the pie chart, prime farmland is depicted in yellow or yellow with crosshatching. About 24% of the Isle of Wight Bay Watershed in Worcester County is prime farmland. The various shades of reds and greens depict soil areas with wetness conditions that affect their agricultural or development potential. Nearly 72% of the watershed exhibits wetnessrelated limitations. Natural Soil Groups Isle of Wight Bay Watershed (Md) (2.59%) (5.33%) (0.98%) (8.29%) (16.87%) (1.48%) (4.08%) (1.36%) (2.10%) (2.26%) 2. Soils and Watershed Planning Local soil conditions can be a useful (54.67%) element in watershed planning and for targeting restoration projects. Soils with limitations related to wetness naturally affect farming practices and may inhibit active use for farming or development. Wet soils are so extensive in the watershed that land owners have invested substantial effort in ditching to improve drainage and utility of the land. However, land owners have also tended leave some of the wetter areas in natural vegetation or other low intensity use. By comparing the soils map to other information including the maps listed below, it is possible to see that existing natural habitat areas in the watershed frequently are associated with areas wet soils: 1997 General Land Use Map, Green Infrastructure Map Natural Resource Areas of Potential Local Significance Map Natural Soil Groups or similar soils assessment techniques can be used to help identify potential areas for restoration projects or habitat enhancement and protection. For example, the wet flood plain soil (G2) coincides with existing high-quality naturally-vegetated stream buffer identified on upper Church Creek in the 1999 stream corridor assessment. This could be an area for protection with conservation easements or for enhancement with adjacent restoration projects. After areas for restoration are targeted and land owner interest is verified, additional on-site soil assessment is an essential step in identifying viable restoration project sites. Page 32

41
42 Wetlands 1. Introduction to Wetland Categories 41 The Eastern Coastal Plain Province likely has the highest diversity of emergent estuarine and palustrine wetland communities relative to other Maryland physiographic regions because both tidal and nontidal freshwater marshes occur here. Wetlands are most abundant in the Coastal Plain due to the low topographic relief and high groundwater table characteristic of the region. Estuarine Wetlands. Estuarine wetlands are abundant throughout the Coastal Plain. These systems consist of salt and brackish tidal waters and contiguous wetlands where ocean water is at least occasionally diluted by freshwater runoff from the land. These wetlands may extend far upstream in tidal rivers to freshwater areas. Differences in salinity and tidal flooding within estuaries have a significant effect on the distribution of these wetland systems. Salt marshes occur on the intertidal shores of tidal waters in areas of high salinity. Brackish marshes are the predominant estuarine wetland type in Maryland. They are found along the shores of Chesapeake Bay, mostly on the Eastern Shore, and for considerable distance upstream in coastal rivers. Estuarine shrub swamps are common along the Maryland coastal zone. Aquatic beds, comprised mostly of submerged aquatic vegetation, are abundant in shallow water zones of Maryland s estuaries, especially Chesapeake Bay and its tributaries. Palustrine wetlands. Forested wetlands are the most abundant and widely distributed palustrine wetland type on the Coastal Plain. These wetlands are found on floodplains along the freshwater tidal and nontidal portions of rivers and streams, in upland depressions, and in broad flat areas between otherwise distinct watersheds. Tidal freshwater swamps occur along coastal rivers in areas subject to tidal influence. Scrub-shrub swamps are not abundant on the Eastern Shore but are represented in the Manokin River watershed. Emergent wetlands on the Coastal Plain are characterized by a wide range of vegetation, depending on water regime. (Adapted from Wetlands of Maryland, Tiner and Burke, 1995.) 2. Tracking Wetlands 41 Oversight of activities affecting wetlands involves several regulatory jurisdictions. The Maryland Dept. of the Environment (MDE) is the lead agency for the State and cooperates with DNR, the Army Corps of Engineers and other Federal and local agencies. As part of its responsibility, MDE tracks State permitting and the net gain or loss of wetlands over time. As the Wetlands Regulatory Status table shows, changes tracked in the State regulatory program have been minor in the Manokin River watershed. (Note: Regulatory tracking for authorized nontidal wetland losses began in Comprehensive tracking of voluntary wetland gains began in Tidal wetland changes are not shown.) Page 34 Tracking Wetland Change Isle of Wight Bay Watershed Permits Authorized = 11 Letters of Authorization Issued = 588 Wetland Class Acres Permanent Impacts Mitigation by Permittee Other Gains (Regulatory) 0.70 Programmatic Gains 5.00
43 3. Interpreting Wetland Distribution Wetlands in the Isle of Wight Bay watershed tend to occur along waterways as shown in the Wetlands of the Isle of Wight Bay Watershed Map. In comparing this map to the 1997 Generalized Land Use Map, it can be seen that forested land in the watershed is frequently found in association with wetlands or adjacent to them. A comparison of the two maps shows that many of the nontidal wetland areas are depicted as forest on the land use map. This difference is simply the result of two differing views of the landscape. For example, wooded nontidal wetlands can be viewed as wetlands from a habitat / regulatory perspective and they can be viewed as forest from a land use perspective. In the Isle of Wight Bay watershed, differing perspectives on counting wetlands are significant for watershed management. From a land use perspective, 899 acres of wetlands are identified by the Wetland Acreage Summary Isle of Wight Bay Watershed 41,42 Wetland Class Acres Estuarine, Intertidal (E2) aquatic bed 5 beach bar 0 emergent 1,316 forested 16 scrub shrub 31 Palustrine (P) aquatic bed 0 emergent 124 flat 0 forested 2,856 scrub shrub 57 Riverine, Lower Perennial (R2) beach bar 0 Riverine, Upper Perennial (R3) beach bar 0 Total Wetlands Total from above DOQQ (DNR estimate) National Wetlands Inventory 4,405 5,266 3,619 Wetlands of Special State Concern (WSSC) 26 acres NOTE: WSSC regulations apply to selected wetlands listed in table Department of State Planning. From a habitat / regulatory perspective, there are between 3600 and 5300 acres of wetlands in the watershed depending on the estimate that you use (see total wetlands in table.). In the context of the Watershed Restoration Action Strategy (WRAS), wetlands serve valuable water quality and habitat functions that may not be provided by other land uses. Therefore, protection and enhancement of existing wetlands, and restoration of past wetland areas, can be a valuable element in the WRAS. (Also see Wetland Restoration.) Page 35
44
45 LIVING RESOURCES AND HABITAT In The Isle of Wight Bay Watershed Overview Living resources, including all the animals, plants and other organisms that call the land and waters of the Isle of Wight Bay watershed home, are being affected by human activity. The information summarized in this characterization suggests some of the significant stresses in the watershed are related to water quality problems from excessive movement of sediment and excessive availability of nutrients and from manipulation of habitat. The living resource information summarized here should be considered a partial representation because numerous areas of potential interest or concern could not be included due to lack of information, time, etc. For example, information on many forms of aquatic life, woodland communities, terrestrial habitats, etc. should be considered as watershed restoration decisions are being made. Therefore, it is recommended that stakeholders in the watershed identify important living resource issues or priorities so that additional effort can be focused where it is most needed. New information should be added or referenced as it becomes available. Page 37
46 Living Resource Indicators Aquatic organisms are sensitive, in varying degrees, to changes in water quality and the habitat associated with water. This association offers to perspectives that are important for watershed restoration. First, improvements for living resources offer potential goals, objectives and opportunities to gauge progress in watershed restoration. Second, selected living resources can be used as to gauge local conditions for water quality, habitat, etc. This second perspective is the basis for using living resources as an indicator. The Maryland Clean Water Action Plan published in 1998 listed the following living resource indicators for the Isle of Wight Bay. 3 The Isle of Wight Bay is also identified in the Plan as a Category 1 Priority Watershed in need of restoration during the next two years. Compared to other watersheds in Maryland, the Isle of Wight Bay watershed exhibits poor abundance of submerged aquatic vegetation (SAV) and monitoring found poor conditions in nontidal streams. Living Resource Indicator SAV Abundance Index Nontidal Benthic Index of Biotic Integrity Nontidal In-Stream Habitat Index Score Rank Bench Mark (percent is based on 138 watersheds) 1.0 Fail Scale of 1 (worst) to 10 (best) Score of 1" yields a rank of fail 5.4 Fail Scale of 1 (worst) to 10 (best) Score less than 6 yields a rank of fail 5.40 Pass Scale of 1 (worst) to 10 (best). Of 138 watersheds in Maryland, the 34 (25%) with the lowest nontidal in-stream habitat index received a rank of fail and were designated as Category 1 watersheds in need of restoration. The top 34 (25%) were designated as Category 3 watersheds in need of protection. Also see Interpreting Living Resource Indicators. Page 38
47 Interpreting Living Resource Indicators General. Several of these indices rely on index rankings generated from a limited number of sampling sites which were then generalized to represent entire watersheds. Considering this limitation, it may be beneficial to conduct additional assessments to provide a more complete understanding of local conditions as part of the WRAS: SAV Abundance Index. The Finding of 1.0" means that Submerged Aquatic Vegetation (SAV) in 1996 covered 10% or less of the potential SAV habitat. This index allows comparison of watersheds based on the actual versus potential SAV area. To generate the number under Finding, the watershed area covered by SAV in a single year is measured using aerial survey. The year used here was The potential SAV area is determined by water depth (water area up to two feet deep), physical characteristics and historic occurrence of SAV. Nontidal Benthic Index of Biotic Integrity. This index allows comparison of streams based on the populations of bottom-dwelling bugs (benthic macroinvertebrate organisms) found in the stream. For coastal plain streams, this index employs seven measurements of these populations which is translated into a rank for each sampling site. An index less than 6 indicates that benthic organisms are significantly stressed by local conditions. Nontidal In-Stream Habitat Index. This index allows comparison of streams based fish and benthic habitat as measured by instream and riparian conditions. For each stream site, that was assessed, visual field observations are used to score the site for substrate type, habitat features, bank conditions, riparian vegetation width, remoteness, aesthetic value, etc. These scores are then integrated to generate a single rank for each stream site. Page 39
48 Plankton Plankton are microscopic plants and animals that are important contributors to natural aquatic systems. Among other valuable functions, they are important food sources for fish and shellfish. When population explosions of some plankton species occur, like algae blooms, many problems may result: fish may die from low dissolved oxygen, submerged aquatic vegetation (SAV) can not survive because essential light is blocked, etc. 1. Algae The technical report Algae Including Phytoplankton, Harmful Algal Blooms and Macroalgae includes extensive assessment and interpretation of data on plankton and algae populations for the Isle of Wight Bay. 34 Some of the report s findings are summarized below. Eutrophication problems associated with algae are greatest in tidal waters with limited flushing characteristics. Bluegreen algae dominated the plankton community in Bishopville Prong and Shingle Landing Prong area in August. In Bishopville Prong, this dominance lasted about four months. This finding of relatively high bluegreen algae populations compared to other algae is an indicator of eutrophication which suggests that nutrients are overly abundant. This assessment considered the period June through October During the study, algae growth in the Bishopville Prong / Shingle Landing Prong area was high enough to inhibit submerged aquatic vegetation (SAV) according to measured chlorophyll a concentrations. Concentrations of chlorophyll a tended to be around 50 ug/l in this area between July 1998 and July (It is recommended that 15 ug/l or less chlorophyll a is necessary to support SAV habitat. 27 ) There were also significant algae blooms during this time frame, particularly in 2000 in Bishopville Prong, when chlorophyll a concentrations reached about 200 and 300 ug/l. (Chlorophyll a concentrations were used as an indicator of algae biomass.) In the St. Martin River, average chlorophyll a concentrations remained higher than the SAV habitat requirement of 15 ug/l throughout the year. Monitoring showed a pattern of summer algae bloom (higher chlorophyll a concentrations) in July. In the open waters of the Isle of Wight Bay, chlorophyll a concentrations were generally stable averaging less than 15 ug/l, which tends to be more supportive of SAV habitat. Either nitrogen or phosphorus limits algae growth in tidal waters of the Isle of Wight Bay watershed depending upon time and location. This suggests that controlling both nutrients is necessary to reduce the potential for algae blooms and to support SAV restoration. The mouth of Herring and Turville Creeks have exhibited very high biomass of macroalgae during surveys conducted in the past two years. The most common of these species are known as red algae. This finding could suggest gaps in understanding its role in the local ecosystem. 37 During the year 2000, DNR monitored macroalgae in response to citizen concerns. No harmful conditions were reported. See Page 40
49 2. Pfiesteria. 13 Following the 1997 Pfiesteria outbreaks in several Chesapeake Bay rivers in the Lower Eastern Shore, monitoring of St. Martin River was initiated because it exhibits similar characteristics to watersheds that experienced problems. Pfiesteria was not found in the water or sediment samples from the St. Martin River during the 1998 through September 2000 monitoring Brown Tide 34 Brown tide is a concern primarily because it can cause fish kills. The organism that is responsible for brown tide, Aureococus, has been monitored in the Isle of Wight Bay watershed since In general, blooms tend to occur seasonally in June/July. This monitoring was prompted by high population levels found in December 1998 in Delaware s Little Assawoman Bay. Typically, the brown tide problem is found in cooler waters off New Jersey and in areas further north. In Maryland, 1999 monitoring results raised concerns but measurable problems were not identified. Samples collected in 2000 indicated that the population had declined with the highest levels found near Ocean Pines. It is unclear if the conditions observed lasted long enough to impact bivalves or seagrasses. DNR is continuing to work with the University of Maryland to better understand this organism. Benthos in Nontidal Streams Two recent assessments in 1997 and 1999 examined macroinvertibrates (bugs) and habitat conditions in nontidal streams as a measurement of stream health. 24, 28 For one area of Carey Branch, both assessments generally agreed that in-stream habitat was moderately impaired or fair. In 1999, DNR Watershed Restoration Division assessed nontidal tributaries to the St. Martin River. The report, issued February 2000, identified nutrient concentrations, macro invertebrate communities and riparian corridor conditions. Thirteen sites were ranked by macro invertebrate community and by habitat: 24 There was little correlation between findings on the community and on habitat condition. Best communities (more diverse, more sensitive species) were found in larger streams - Birch Branch at Campbelltown Road crossing (station SM-17) - Middle Branch at the Route 113 crossing (station SM-14) - Birch Branch at the Route 113 crossing (station SM-13) - Church Creek at the Route 113 crossing (station SM-15) Poorest communities were found in upper watershed streams having little flow and impaired habitat. In 2001, ten sites in the Isle of Wight Bay watershed are scheduled for assessment by the Maryland Biological Stream Survey (MBSS). The focus of this work will be to assess the in-stream aquatic community and habitat conditions. 19 Page 41
50 Historical data on macroinvertebrates are available for some free flowing streams in the Isle of Wight Bay watershed. Records begin in the late 1970s. 36 Why Look At Benthos In Streams? Benthos are sometimes called stream bugs though that name overly simplifies the diverse membership of this group. Unimpaired natural streams may support a great diversity of species ranging from bacteria and algae to invertebrates like crayfish and insects to fish, reptiles and mammals. benthic macro-invertebrates, also called benthos, are an important component of a stream s ecosystem.. This group includes mayflies, caddisflies, crayfish, etc. that inhabit the stream bottom, its sediments, organic debris and live on plant life (macrophytes) within the stream. The food web in streams relies significantly on benthos. Benthos are often the most abundant source of food for fish and other small animals. Many benthic macroinvertebrates live on decomposing leaves and other organic materials in the stream. By this activity, these organisms are significant processors of organic materials in the stream. Benthos often provide the primary means that nutrients from organic debris are transformed to other biologically usable forms. These nutrients become available again and are transported downstream where other organisms use them. Benthos are a valuable tool for stream evaluation. This group of species has been extensively evaluated for use in water quality assessment, in evaluating biological conditions of streams and in gauging influences on streams by surrounding lands. Benthos serve as good indicators of water resource integrity because they are fairly sedentary in nature and their diversity offers numerous ways to interpret conditions. (They have different sensitivities to changing conditions. They have a wide range of functions in the stream. They use different life cycle strategies for survival.) Fish Overall, economically important fishery resources in the Coastal Bays, including the Isle of Wight Bay, are found in open tidal waters. The Coastal Bays area, including Isle of Wight Bay, serves as a spawning, nursery and feeding area for many species of fish and invertebrates. 20 The fish species that now dominate the Coastal Bays are very different from those that were found prior to 1933 when a storm created the Ocean City Inlet. The permanent opening in the barrier island changed the Coastal Bays salinity regime, reduced habitat for anadromous fish and eliminated commercial fisheries for anadromous species like American shad, alewife and others. 28 The Isle of Wight Bay s immediate proximity to the Inlet suggests that it experienced a dramatic fish population shift to salt tolerant species. An ongoing Maryland DNR seine and trawl survey has collected more than 115 fish species from Maryland s Coastal Bays since This survey has also recorded over 157 species of benthic invertebrates. 29 Page 42
51 In nontidal streams, the fish community assessments found only species that are tolerant or moderately tolerant to pollution. There are no significant commercial or recreational fisheries in the 24, 28, 30 nontidal streams of the Ocean Coastal Basin. Sampling in the St. Martin River from 1998 through 2000 as part of the Pfiesteria monitoring program reported that fish populations there were among the healthiest of the Lower Eastern Shore waterways observed. 21 Maryland s coastal bays have supported a recreational sport fishery for many years. The primary sport fishing areas are generally located in the open waters of the coastal bays including an area extending from the Isle of Wight Bay into Assawoman Bay. 20 In the Coastal Bays generally, recreational anglers catch many marine fishes including flounder, weakfish, spotted sea trout, striped bass, red drum, tautog, black sea bass, spot, croaker, and bluefish. 29 Oysters, Clams and Crabs Oyster lease areas are currently located in the Assawoman Bay, Sinepuxent Bay and Chincoteague Bay but not in the Isle of Wight Bay. Oysters were once an important regional fishery but have declined drastically during the twentieth century due to harvesting, disease and predation. 31 A survey conducted from 1906 to 1912 identified oyster beds in Chincoteague Bay and the extreme southern portion of Newport Bay but none were identified in the Isle of Wight Bay. 22 In the Coastal Bays generally, blue crabs and hard clams have commercial and recreational importance. 29 Information for the Isle of Wight Bay is not available. Sensitive Species Sensitive species are most widely known in the form of Federally listed endangered or threatened animals such as the bald eagle. In addition to these charismatic rare animals, both US EPA and Maryland DNR work through their respective Federal and State programs to protect numerous endangered, threatened, or rare species of plants, animals and ecological communities of those species. For the purposes of watershed restoration, it is valuable to account for known habitat locations for these species. These places are often indicators, and sometimes important constituents, of the network of natural areas or Green Infrastructure that are the foundation for many essential natural watershed processes. Protecting these species and/or promoting expansion of their habitats can be an effective foundation for a watershed restoration program. Page 43
52 1. Habitat Protection Categories One way to characterize a watershed for sensitive species is to identify known habitat locations using several broad categories employed by DNR s Wildlife and Heritage Division. The following table and Sensitive Species Map summarize this approach. The three categories listed in the accompanying table (SSPRA, NHA, WSSC) are considered during review of applications for a State permit, for a State approval or for projects that involve State funds. For projects potentially affecting these areas, the State permit or approval will include recommendations and/or requirements to protect sensitive species and their habitat. In addition, many counties have incorporated safeguards for these areas into their permit review process. These categories do not place requirements on any activities that do not require a permit or approval or involve State funds. However, there are State and Federal restrictions that address takings of protected species that apply more broadly. In addition, property owners are encouraged to seek advice on protecting the sensitive species / habitat within their ownership. Maryland s Sensitive Species Protection Categories Sensitive Species Project Review Area (SSPRA) At least eight SSPRAs are identified in the Isle of Wight Bay watershed. Each SSPRA contains one or more sensitive species habitats. However, the entire SSPRA is not considered sensitive habitat. The SSPRA is an envelope identified for review purposes to help ensure that applications for permit or approval in or near sensitive areas receive adequate attention and safeguards for the sensitive species and habitat they contain. At least one SSPRA encompasses each NHA and WSSC. Natural Heritage Area (NHA) No NHAs are located in the Isle of Wight Bay watershed. NHAs are rare ecological communities that encompass sensitive species habitat. They are designated in State regulation COMAR For any proposed project that requires a State permit or approval that may affect an NHA, recommendations and/or requirements are placed in the permit or approval that are specifically aimed at protecting the NHA. Wetlands of Special State Concern (WSSC) One WSSC is designated in the Isle of Wight Bay watershed. These wetlands are associated with one or more sensitive species habitats that are in or near the wetland. For any proposed project that requires a wetland permit, these selected wetlands have additional regulatory requirements beyond the permitting requirements that apply to wetlands generally. For a listing of designated sites see COMAR at Page 44
53 2. Rare Fish and Mussels DNR recently initiated a project to rank watersheds across Maryland to aid in targeting conservation and restoration efforts to benefit known populations of rare fish and mussels. In comparison to the more than 1000 small (12-digit) watersheds identified by DNR in Maryland, the entire Isle of Wight Bay watershed (all four 12-digit sub-watersheds) received a rank of neutral. A ranking of neutral indicates that information is insufficient (rather than absence of these species or low priority.) In neutral ranked areas, it is reasonable to rely on other available criteria for targeting watershed conservation and restoration projects. This ranking considers information from 1970 to 1997 only for rare species of fish or mussels in Maryland that are tracked by DNR. Four possible ranks were used for this project: Very High, High, Moderately High and Neutral. Each rare species being tracked contributed to this ranking based on two types of criteria: 1) presence or absence of the species, and 2) if present, weighting relative rarity on worldwide and Statewide scales. A listing of species considered and project description (metadata) is available upon request. Page 45
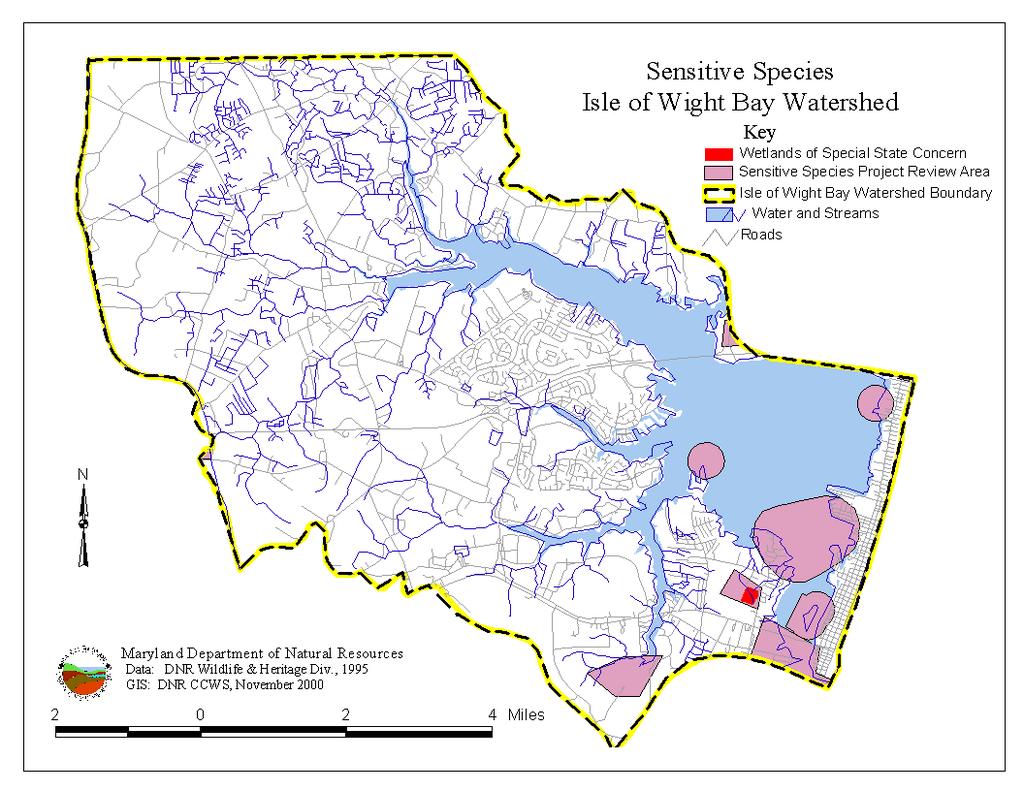
54
55 Submerged Aquatic Vegetation Submerged Aquatic Vegetation (SAV) is considered a significant natural resource in Maryland s tidal waters because it provides food and habitat for fish, waterfowl, and numerous aquatic organisms. It also provides a visible indication of good water quality and functions as an important stabilizer for sediments, a nutrient buffer, and it aids in water oxygenation. Prior to the 1930s, SAV beds were extensive in the Coastal Bays. During the 1930s, extensive SAV beds died for unknown reasons. The low SAV population levels persisted until recent years. 43 Abundance of SAV has been slowly increasing since the middle 1980's. SAV beds are limited to relatively shallow areas where adequate light can penetrate the water column for SAV growth. SAV acreage in the Isle of Wight Bay has been increasing since The majority of the SAV acreage is located on the eastern shore of Isle of Wight Bay. New SAV beds appeared in 1999 in Turville Creek, and on the south and west shores of Isle of Wight. 14 Two species of SAV species are found in the Isle of Wight Bay area: Ruppia maritima - Widgeon grass Zostera marina - Eelgrass The source of the SAV data shown here is the Virginia Institute of Marine Isle of Wight Polyhaline (IOWPH) Bay Grass Acreage Science. The most current SAV information (1999) is available online at the Virginia Institute of Marine Science website ( All 1999 SAV acreage data is still preliminary. DNR s Internet site MERLIN ( ) offers maps for viewing that show SAV bed presence by county for each year 1984 through The US EPA Chesapeake Bay Program recently published an extensive assessment of water quality and habitat requirements for SAV. This document is available for viewing at (under publications, key word SAV). In addition to the annual tracking of SAV described above, aerial photography is currently being used to evaluate damage to SAV beds in the Coastal Bays from water-based activities (motor boats, jet skis, front establishments, hydraulic clam dredging, etc.) YEAR Page 47
56 RESTORATION TARGETING TOOLS For The Isle of Wight Bay Watershed 1999 Stream Corridor Assessment Within the Isle of Wight Bay watershed, a Stream Corridor Assessment was conducted in the St. Martin River by the DNR Watershed Restoration Division This effort included water quality monitoring and a benthic organism assessment (presented elsewhere in this Characterization) and an on-the-ground assessment of the stream corridor conditions summarized here: St. Martin River Watershed Stream Corridor Assessment Findings Matrix Potential Problems Identified Count Length Est. feet / miles * Severity Frequency Pipe Outfalls Pond Sites 0 -- Tree Blockages 0 -- Inadequate Buffers * 24 94,870 / Erosion / Fish Blockages Channel Alternation 11 32,720 / Exposed Pipe 1 6 / Unusual Conditions Trash Dumping 0 -- In or Near Stream Construction 0 -- TOTAL As used here, inadequate buffer means that natural vegetation at least 50 feet wide was not found adjacent to the stream on either side (100 foot total width). This buffer size and condition is being promoted by DNR to enhance natural resource conditions but it is not a requirement. Each side of the stream is reported separately. To generate the length estimate, the two sides of the stream are added together for a total. All other length estimates in the table are reported as a single linear measurement. Page 48
57 2000/2001 Stream Corridor Assessment Using the Stream Corridor Assessment Methodology (SCAM) developed and applied by the DNR Watershed Restoration Division, additional valuable information can be compiled to assist in restoration activities. In partnership with Worcester County, DNR is conducting a Stream Corridor Assessment for the Isle of Wight Bay watershed during winter 2000/2001. Trained teams from the Maryland Conservation Corps will walk along streams to identify and document potential problems and restoration opportunities such as inadequate stream buffers. The team working in the Isle of Wight Bay received training relevant to coastal plain stream conditions and problems. A report will be generated, including maps and photographs, to support targeting decisions for restoration projects. Draft data summaries are expected to be available in Summer 2001 with a final report by December The data from this assessment will provide an important companion report for this watershed characterization and will be used in development of the Watershed Restoration Action Strategy. Clean Marinas Program Overboard sewage discharges from boats are a concern for water quality because these discharges contribute nutrients, biological oxygen demand, pathogens, etc. These discharges are preventable if a sufficient number of pumpout facilities are locally available and boat operators take advantage of these services. Sixteen of the twenty-seven marinas located in Worcester County are located in the Isle of Wight Bay waters. In the Isle of Wight Bay watershed, five marinas offer pumpout facilities and one of these five marinas is currently participating in Maryland s Clean Marinas Program. (See the Fish Blockages and Marinas Map.) The Clean Marinas Program is voluntary way for marina owners to demonstrate that their pumpout service and other high quality boating services provided in accordance with Program guidelines are helping keep local waters cleaner. One potential element of a Watershed Restoration Action Strategy (WRAS) is to encourage and/or support adding marina pumpout facilities serving the local area and increasing participation in the Clean Marinas Program. Page 49
58 Fish Blockages Many fish species need to move from one stream segment to the next in order to maintain healthy resilient populations. This is particularly true for anadromous fish species because they spawn and hatch from eggs in free flowing streams but live most of their lives in estuarine or ocean waters. Blockages in streams can inhibit or prevent many fish species from moving up stream to otherwise viable habitat. To help prioritize stream blockages for mitigation or removal, the DNR Fish Passage Program maintains a database of significant blockages to fish movement. In addition, new information on blockages is being collected like the blockages identified during the recent Stream Corridor Assessment in the Isle of Wight Bay watershed. A summary of the 13 blockages in the Isle of Wight Bay watershed known as of December 2000 appears in the Fish Blockages Table and the Fish Blockages and Marinas Map. One of these has been corrected. As additional Stream Corridor Assessment is done, it is likely that additional potential fish blockage problems will be identified. Some blockages to fish movement may be structural components of drainage ditches and/or Public Drainage Associations (PDAs). If a blockage is found to be in this category, circumstances like requirements for drainage control function and public need are considered in determining the potential for a restoration project. Page 50
59 Fish Blockages Known in the Isle of Wight Bay Watershed Stream Affected Station * Blockage Corrected Name / Location of Fish Blockage Bunting Creek SMR01 Route 367 Bunting Creek SMR miles north of Route 367 Bishopville Prong Tributaries Carey Branch Carey Branch grade control structure, total blockage grade control structure, total blockage Slab Bridge Prong SMR05 Old Stage Road Birch Branch Birch Branch grade control structure (dam), total blockage grade control structure (dam), total blockage Shingle Landing Prong Tributaries Birch Branch grade control structure (dam), total blockage Middle Branch SMR03 projected Route 113, fishway under design Middle Branch Middle Branch SMR shallow water caused by low dam Campbelltown Road. When culvert replacement occurs, regulatory design requirements will eliminate the blockage. West Middle Branch shallow water caused by low dam Turville Creek AT003 yes Route 589 culvert, fishway is in place * Lettered station names are in the fish blockage data base based on pre-1999 information. Dated station names (1999), were newly identified during the 1999 stream corridor assessment in the St. Martin River watershed. Page 51
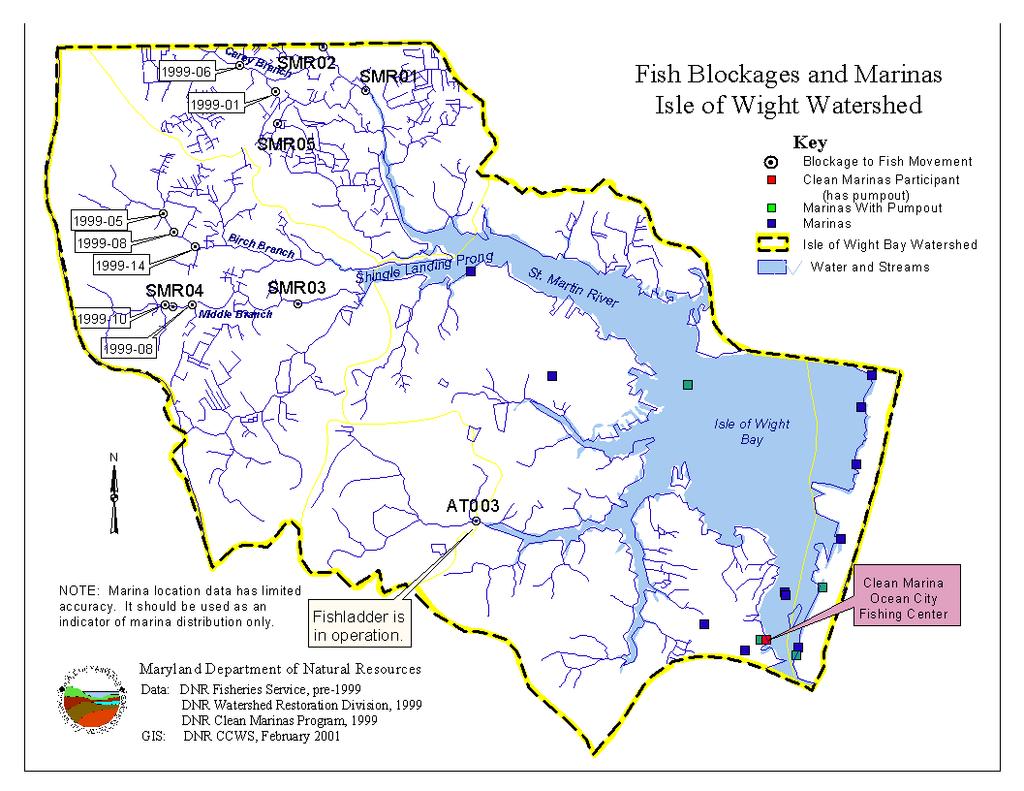
60
61 Stream Buffer Restoration 1. Benefits and General Recommendations In the1999 Stream Corridor Assessment, 45% of the streams assessed in the St. Martin River watershed did not have buffers that were at least 50 feet of natural vegetation on each side of the stream (100 feet total). DNR recommends that 100 feet of forested buffer is typically necessary to promote high quality aquatic habitat and diverse aquatic populations. (20 linear miles of stream were assessed. Left and right banks were assessed separately. 18 out of 40 miles of stream bank were found to be inadequate.) In the same assessment, Church Branch was found to have significant riparian areas with natural vegetation intact. 23 Expanding areas with natural vegetation in stream riparian zones serves as stream buffer that can provide numerous valuable environmental benefits: Reducing surface runoff Preventing erosion and sediment movement Using nutrients for vegetative growth and moderating nutrient entry into the stream Moderating temperature, particularly reducing warm season water temperature Providing organic material (decomposing leaves) that are the foundation of natural food webs in stream systems Providing overhead and in-stream cover and habitat Promoting high quality aquatic habitat and diverse populations of aquatic species. To realize these environmental benefits, DNR generally recommends that forested stream buffers be at least 100 feet wide, i.e. natural vegetation 50 feet wide on either side of the stream. Therefore, DNR is promoting this type of stream buffer for local jurisdictions and land owners who are willing to go beyond the minimum buffers standards. The DNR Watershed Restoration Division and other programs like CREP are available to assist land owners who volunteer to explore these opportunities. A determination of the impacts and compatibility of instituting buffers can be assessed using various methods including those discussed in this section. These methods, combined with other local factors like water quality, land owner and community interests, etc. can be used to establish priorities for buffer restoration. 2. Using GIS Identifying the areas that could benefit from stream buffer restoration and prioritizing them for projects is often a time-consuming and expensive effort. Fortunately, use of a computerized Geographic Information System (GIS) to manipulate remote sensing data can help save limited time and funds. To assist in this technical endeavor, DNR Watershed Management and Analysis Division has developed GIS-based tools to assist in the buffer restoration targeting process. With these tools, GIS maps and other information can be generated to help select stream segments for additional Stream Corridor Assessment, to identify geographic areas for community and land owner contact and for Page 53
62 similar uses. Then, with an appropriate level of on-the-ground verification or ground truthing, these GIS tools can provide an efficient first step toward stream buffer restoration. Several scenarios are presented here to help consider potential areas for stream buffer restoration. These scenarios can be used alone or in combination as models for targeting and field verifying potential restoration sites. These maps are intended to demonstrate a methodology that can be used to locate sites having a high probability of optimizing certain ecological benefits. The resolution of the data used to generate these maps is not sufficient for an accurate site assessment, but can be used to identify potential candidate sites for detailed investigation. 3. Headwater Stream Buffers Headwater streams are also called First Order Streams. These streams, unlike other streams (Second Order, etc.), intercept all of the surface runoff within the watersheds that they drain. In addition, for many watersheds, first order streams drain the majority of the land within the entire watershed. Therefore, stream buffers restored along headwater streams (First Order) tend to have greater potential to intercept nutrients and sediments than stream buffers placed elsewhere. In targeting stream buffer restoration projects, giving higher priority to headwater streams is one approach to optimizing nutrient and sediment retention. Restoring headwater stream buffers can also provide habitat benefits that can extend downstream of the project area. Forested headwater streams provide important organic material, like decomposing leaves, that feed the stream s food web. They also introduce woody debris which enhances in-stream physical habitat. The potential for riparian forest buffers to significantly influence stream temperature is greatest in headwater regions. These factors, in addition to positive water quality effects, are key to improving habitat for aquatic resources. 4. Land Use and Stream Buffers One factor that affects the ability of stream buffers to intercept nonpoint source pollutants is adjacent land use. Nutrient and sediment loads from different land uses can vary significantly as shown in the accompanying table s generalized data. As the table indicates, crop land typically contributes the greats nutrient and sediment loads. However, under some conditions urban land can contribute higher phosphorus loads. By identifying land uses in riparian areas with inadequate stream buffers, like crop land adjacent to streams, potential to reduce nutrient and sediment loads can be improved. To assist in finding areas with crop land adjacent to streams, the same land use data shown in the 1997 Generalized Land Use Map can be filtered using GIS. The new Nonpoint Source Pollution Load Rates By Land Use Chesapeake Bay Watershed Model, in kg/ha-yr Land Use Nitrogen Phosphorus Sediment Crop land Urban Impervious Pervious Page Pasture Forest
63 scenario shown in the Land Use Scenario Map focuses on the land use within 150 feet of a stream. This view, supplemented with the land use pollution loading rates, suggests potential buffer restoration opportunities that could maximize nutrient and sediment loads. 5. Nutrient Uptake from Hydric Soils in Stream Buffers In general, the nutrient nitrogen moves from the land into streams in surface water runoff and in groundwater. In watersheds like the Isle of Wight Bay, a relatively high percentage of nitrogen, and perhaps the majority, enters streams in groundwater. 36 Stream buffers can be used to capture nitrogen moving in groundwater if buffer restoration projects have several attributes: Plant with roots deep enough to intercept groundwater as it moves toward the stream Plants with high nitrogen uptake capability, and Targeting buffer restoration projects to maximize groundwater inception by buffer plants. Hydric soils in riparian areas can be used as one factor to help select stream buffer restoration sites. Siting buffer restoration on hydric soils would offer several benefits: Plant roots are more likely to be in contact with groundwater for longer periods of time Hydric soils tend to be marginal for many agricultural and urban land uses Natural vegetation in wet areas often offers greater potential for habitat. The Nutrient Retention Using Hydric Soils Scenario Map identifies lands adjacent to streams that are on hydric soil and also have insufficient stream buffers in the Isle of Wight Bay watershed. To generate the map, hydric soils (Natural Soils Group of Maryland, MDP) were grouped into three classes and rated in terms of their potential to maximize groundwater/root zone interaction: tidal and marsh soils (very high), poorly drained hydric soils (high), and moderately well drained hydric soils (moderately high). An important next step in using this information is verification of field conditions. Care must be taken during field validation to evaluate any hydrologic modification of these soils, such as ditching or draining activities, which would serve to decrease potential benefits. 6. Wetland Associations Wetlands and adjacent natural uplands form complex habitats that offer a range of habitat opportunities for many species. These habitat complexes tend to offer greater species diversity and other ecological values that are greater than the values that the wetland or uplands could offer independently. Therefore, restoring stream buffers adjacent to or near to existing wetlands tends to offer greater habitat benefits than the restoration project could otherwise produce. The Wetland Proximity Scenario Map identifies unforested buffers zones that are in close proximity (within 300 feet) to wetlands (National Wetlands Inventory). Restoration projects in these areas may offer opportunities to enhance and expand wetland habitat in addition to the other desirable buffer functions. Page 55
64 7. Optimizing Water Quality Benefits by Combining Priorities Strategic targeting of stream buffer restoration projects can take into account many different potential benefits. Several of these scenarios are presented independently in this section. However, site selection and project design generally incorporate numerous factors to optimize benefits from the project. For example, finding a site with a mix of attributes like those in the following list could result in the greatest control of nonpoint source pollution and enhancement to living resources: land owner willingness / incentives marginal land use in the riparian zone headwater stream hydric soils selecting appropriate woody/grass species adjacent to existing wetlands / habitat Two of many possible scenarios for prioritizing stream segments as candidates for additional investigation as examples. The map entitled Nutrient Retention Using Hydric Soils Associated With Crop Land Scenario suggests that targeting buffer restoration on hydric soils between a stream and cropland may offer the greatest reduction in nutrients reaching the stream. The Prioritizing Streams Scenario Map combines several elements discussed here into one possible scenario: lack of adequate naturally vegetated buffers, land use adjacent to the stream and headwater stream status. Page 56

65
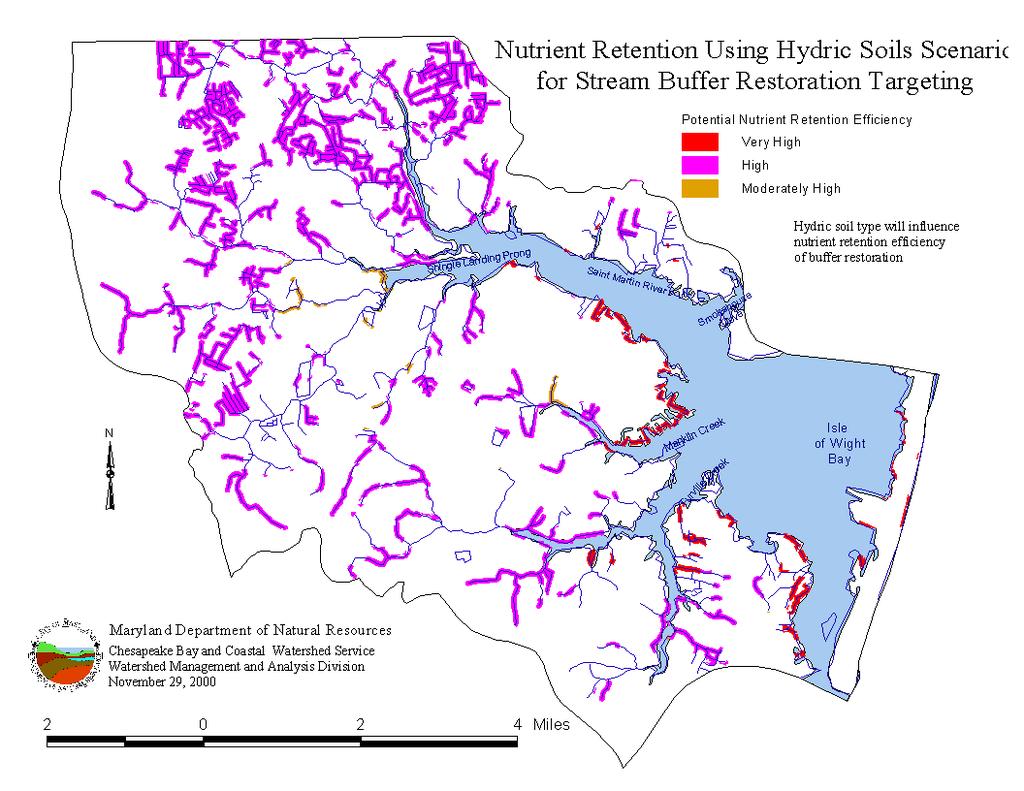
66
67 Map Nutrient Retention Using Hydric Soils Associated With Crop Land Scenario Page 59
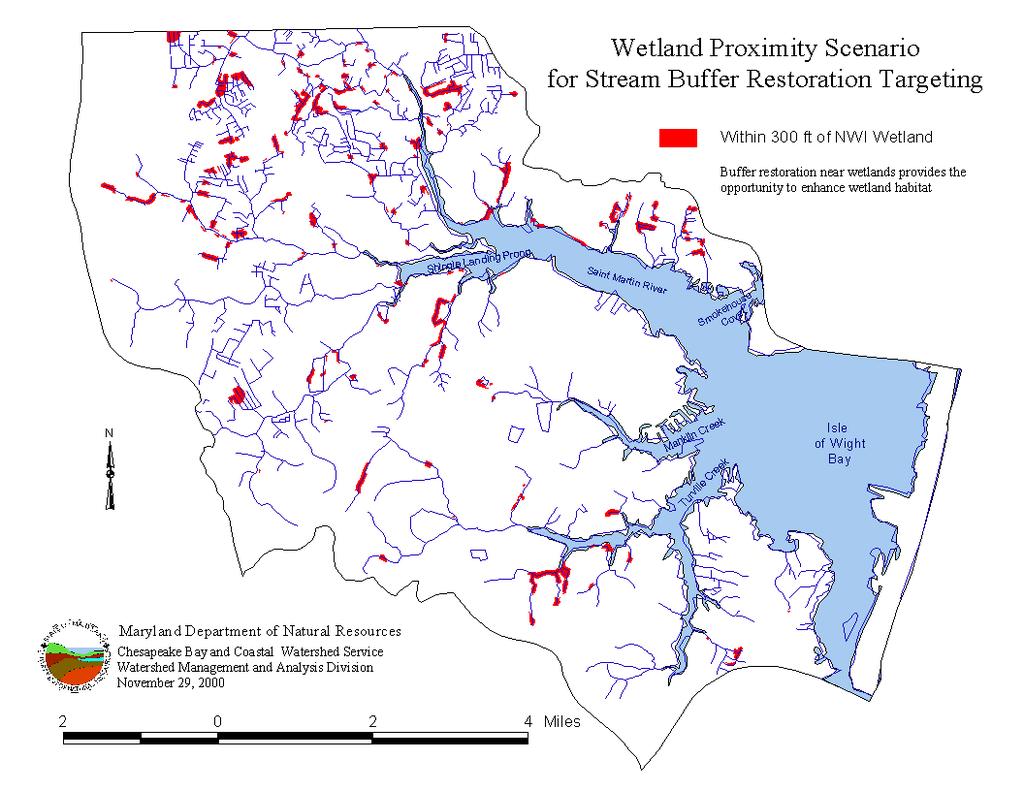
68
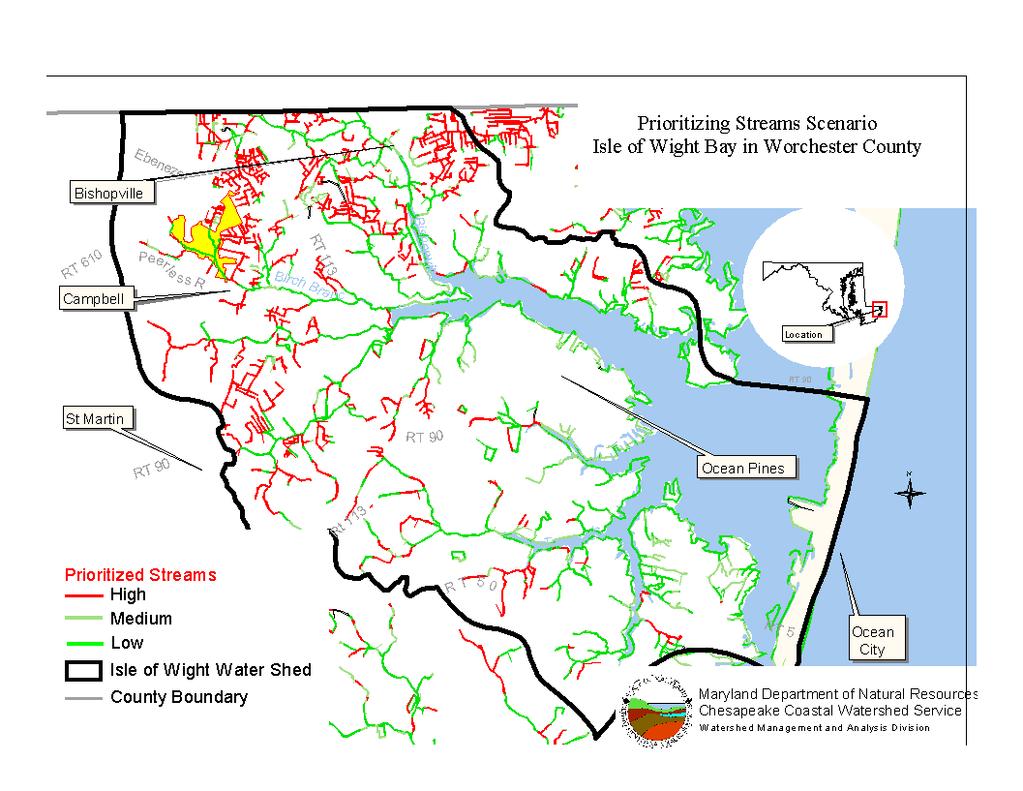
69
70 Wetland Restoration Wetlands serve important environmental functions such as providing habitat and nursery areas for many organisms, nutrient uptake and recycling, erosion control, etc. However, most watersheds in Maryland have significantly fewer wetland acres today than in the past. This loss due to draining, filling, etc. has led to habitat loss and water quality impacts in streams and estuaries. Reversing this historic trend is an important goal of wetland restoration. One approach to finding candidate wetland restoration sites involves identification of historic wetland areas. In this approach, identifying areas of hydric soils is the first step in the investigation. This step in the process can be accelerated by using GIS to manipulate soils information with other data like land use. The GIS products can then assist in initiating the candidate site search process, targeting site investigations and helping to identify land owners. For the Isle of Wight Bay watershed, GIS was used to map and prioritize areas of hydric soil for potential wetland restoration. The steps and priorities used to generate the map are listed below: Data used: Hydric soils (Natural Soil Group), existing wetlands (National Wetland Inventory), land use (Dept. Of State Planning, 1997). Identify candidate hydric soil areas based on land use. Hydric soils on open land (agricultural fields, bare ground, etc.) are retained while those underlying natural vegetation and urban lands are excluded. Explore hydric soils based on proximity to existing wetlands or streams. In the Isle of Wight Bay watershed, hydric soils occur adjacent to existing wetland with significant frequency. Two scenarios for the first step in finding potential wetland restoration sites are presented in accompanying maps: The Wetland Restoration Opportunities Map shows approximately 100 sites that fit three criteria: 1) hydric soil, 2) on open land, and 3) within 300 feet of existing wetlands. The Opportunities to Maximize Nutrient Retention Map shows numerous potential wetland restoration sites considering: 1) hydric soils, 2) on open land, 3) adjacent to streams, and 4) potential to address nutrients in groundwater based on soil type. The potential wetland restoration sites suggested in these scenarios can be filtered further by using more accurate wetlands and soil information, considering landownership, etc. Additional steps to apply this information would likely include considering additional criteria like habitat enhancement opportunities, sensitive species protection, targeting specific streams or subwatersheds for intensive restoration, using Conservation Reserve Enhancement Program (CREP) information, etc. Page 62
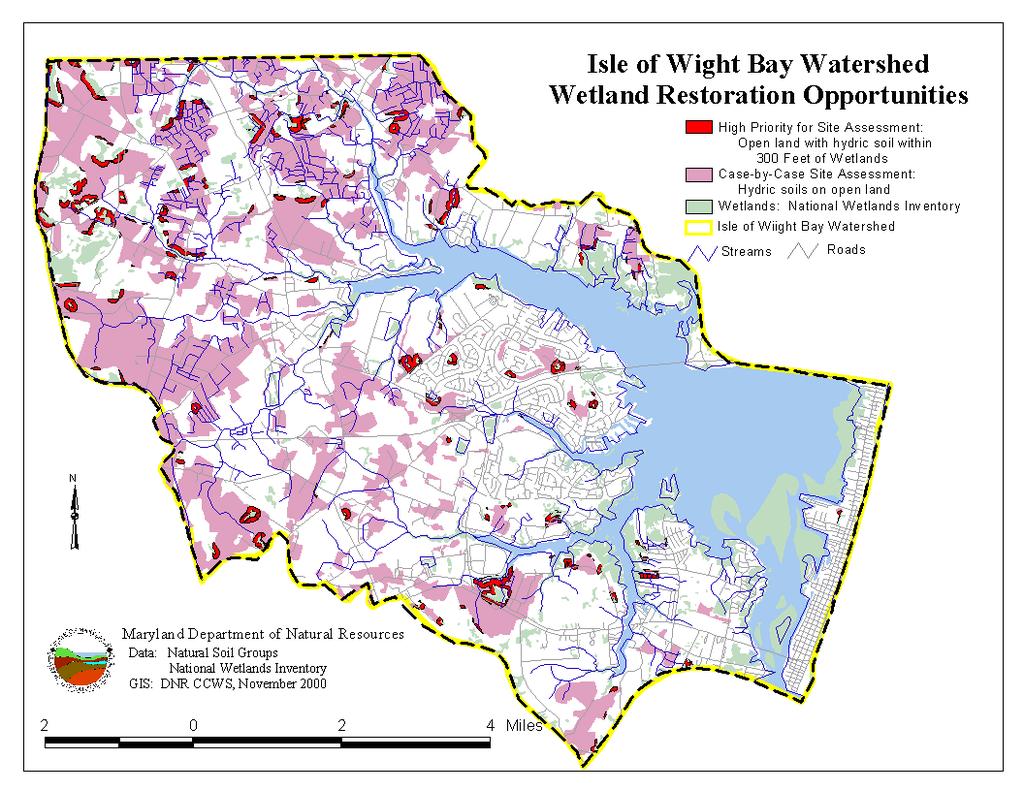
71
Osher Course. What Lies Beneath the Inland Bays?
 Osher Course What Lies Beneath the Inland Bays? Objectives for Course Describe the Delaware Inland Bays and their tributaries Illustrate the ecology and importance of estuaries Demonstrate the threats
Norwalk Harbor Report Card
 Norwalk Harbor Report Card C+ Following the water s trail from your house, into the river, and to the Harbor The way land is used in a watershed has a significant effect on water quality. In areas where
DNR Coastal Resources Division Coastal Resources Management Programs. Brad Gane Assistant Director Coastal Resources Division
 DNR Coastal Resources Division Coastal Resources Management Programs Brad Gane Assistant Director Coastal Resources Division Ecological Services Section Coastal Management Coastal Incentive Grants Water
Phase III Watershed Implementation Plans
 Phase III Watershed Implementation Plans Including programmatic outcomes in your planning to provide co-benefits for your community and reduce pollution Rachel Felver Chesapeake Bay Program Director of
Quittapahilla Creek Watershed Implementation Plan
 Quittapahilla Creek Watershed Implementation Plan Introduction Founded in 1997, the Quittapahilla Creek Watershed Association has been working with landowners, private organizations and public agencies
Lake Creek Watershed Management Plan Public Meeting. Arrowhead Lake May 3, :00 PM
 Lake Creek Watershed Management Plan Public Meeting Arrowhead Lake May 3, 2018 6:00 PM Agenda I. Welcome and Introductions II. III. IV. Watershed Basics Overview of Lake Creek Watershed Elements of a Successful
Riparian Buffers and Stream Restoration
 Riparian Buffers and Stream Restoration Why focus on riparian areas? Link land and water on any given site and link landscapes together in a watershed Riparian corridors protect the circulatory system
EXECUTIVE SUMMARY DES PLAINES RIVER WATERSHED-BASED PLAN WHY A WATERSHED-BASED PLAN? WHAT IS A WATERSHED?
 Des Plaines River Watershed-Based Plan EXECUTIVE SUMMARY June 2018 EXECUTIVE SUMMARY DES PLAINES RIVER WATERSHED-BASED PLAN WHY A WATERSHED-BASED PLAN? Water is elemental to our lives. Plants and animals,
From My Backyard to Our Bay It s the 911 for the Chesapeake Bay
 From My Backyard to Our Bay Reporting Problems on Our Bay, Rivers, and Streams We can all be the eyes and ears of our local waterways. Maryland has established the Chesapeake Bay Safety and Environmental
Long Prairie River Watershed Restoration and Protection Strategies (WRAPS) Report Summary
 Report Summary") Long Prairie River Watershed Restoration and Protection Strategies (WRAPS) Report Summary Minnesota has adopted a watershed approach to address the state s 80 major watersheds (denoted by 8-digit hydrologic
Long Prairie River Watershed Restoration and Protection Strategies (WRAPS) Report Summary Minnesota has adopted a watershed approach to address the state s 80 major watersheds (denoted by 8-digit hydrologic
Fact Sheet. Chesapeake Bay Water Quality
 Fact Sheet Chesapeake Bay Water Quality Water quality is a critical measure of the Chesapeake Bay s health. For the Bay to be healthy and productive, the water must be safe for people and must support
The Snapshot CONODOGUINET CREEK WATERSHED SNAPSHOT
 CONODOGUINET CREEK WATERSHED SNAPSHOT ABOVE: CONODOGUINET CREEK AT RT 74 BRIDGE FACING DOWNSTREAM The Snapshot The Conodoguinet Watershed Snapshot was a collaborative effort to engage local citizens in
Coastal Bays. report card. Gold stars for partnerships
 partners, and visitors, the Maryland between citizens, business, the Program, the Maryland Department of atural Resources, and the U.S. Fish & Wildlife Service has documented more than 113, spawning 212
2008 at a glance. Indicators used in the report card. Total nitrogen. Coastal Bays health ranged from poor to good among reporting regions
 Plant a rain garden (www.co.worcester.md.us). Install a rain barrel (www.epa.gov). Use a programmable thermostat. Buy energy-efficient light bulbs. Plant a tree (www.trees.maryland.gov). Hold a neighborhood
Final Report of the Riparian Forest Buffer Panel
 Chesapeake Bay Program Final Report of the Riparian Forest Buffer Panel Introduction Findings Land Use-Specific Findings On Agricultural Land On Forested Land On Developed and Developing Lands Recommendations
Chapter 6. Aquatic Biodiversity. Chapter Overview Questions
 Chapter 6 Aquatic Biodiversity Chapter Overview Questions Ø What are the basic types of aquatic life zones and what factors influence the kinds of life they contain? Ø What are the major types of saltwater
CHESAPEAKE BAY COMPREHENSIVE WATER RESOURCES AND RESTORATION PLAN - UPDATE. Update to Chesapeake Bay Program STAR January 25, 2018
 CHESAPEAKE BAY COMPREHENSIVE WATER RESOURCES AND RESTORATION 255 255 255 237 237 237 0 0 0 217 217 217 163 163 163 200 200 200 PLAN - UPDATE 131 132 122 239 65 53 80 119 27 110 135 120 252 174.59 112 92
Integrating Water Quality and Natural Filters into Maryland s Marine Spatial Planning Efforts
 Integrating Water Quality and Natural Filters into Maryland s Marine Spatial Planning Efforts Nicole Carlozo NOAA Coastal Management Fellow July 31, 2014 Watershed-scale restoration targeting helps direct
STATE OF THE BAY IN 2012
 9 10 11 STATE OF THE BAY IN 2012 Nitrogen &!Phosphorus Bay-wide nitrogen loads were similar to 2010, but phosphorus loads decreased. These loads are highly elated to river flows and stormwater runoff that
CLMP+ Report on Grass Lake (Anoka County) Lake ID# CLMP+ Data Summary
 Lake ID# CLMP+ Data Summary") CLMP+ Report on Grass Lake (Anoka County) Lake ID# 02-0113-00 2012-2013 CLMP+ Data Summary October 2014 Authors Shannon Martin, MPCA Editing and graphic design Public Information Office Staff The (MPCA)
CLMP+ Report on Grass Lake (Anoka County) Lake ID# 02-0113-00 2012-2013 CLMP+ Data Summary October 2014 Authors Shannon Martin, MPCA Editing and graphic design Public Information Office Staff The (MPCA)
Appendix E : Guidelines for Riparian Buffer Areas
 Appendix E : Guidelines for Riparian Buffer Areas This document should be read in conjunction with the CRCA Planning Policy. 1.0 PURPOSE The purpose of this document is to summarize the recommendations
Prioritizing Climate Change Impacts and Action Strategies
 Prioritizing Climate Change Impacts and Action Strategies Chesapeake Bay Program STAC December 8, 2015 2014 Chesapeake Bay Agreement CLIMATE RESILIENCY GOAL: Increase the resiliency of the Chesapeake Bay
Municipal Stormwater Management Plan Prepared For The Borough of Cape May Point By Van Note-Harvey Associates VNH File No.
 Municipal Stormwater Management Plan Prepared For The Borough of Cape May Point By Van Note-Harvey Associates 2005 VNH File No. 35317-210-21 Table of Contents Introduction... 3 Goals... 3 Storm water Discussion...
Nonpoint Source Pollution A Challenge to Control
 Nonpoint Source Pollution A Challenge to Control Connecticut Envirothon Aquatics Workshop January 14, 2017 Presented by Denise Savageau Conservation Director, Town of Greenwich Point Source Pollution is
6 TH. Most of the Earth Is Covered with Water (2) Most Aquatic Species Live in Top, Middle, or Bottom Layers of Water (1)
 Most Aquatic Species Live in Top, Middle, or Bottom Layers of Water (1)") A Healthy Coral Reef in the Red Sea MILLER/SPOOLMAN ESSENTIALS OF ECOLOGY 6 TH Chapter 8 Aquatic Biodiversity Fig. 8 1, p. 168 Most of the Earth Is Covered with Water (2) Aquatic life zones Saltwater life
A Healthy Coral Reef in the Red Sea MILLER/SPOOLMAN ESSENTIALS OF ECOLOGY 6 TH Chapter 8 Aquatic Biodiversity Fig. 8 1, p. 168 Most of the Earth Is Covered with Water (2) Aquatic life zones Saltwater life
Environmental Check List Georgia Environmental Policy Act
 Environmental Check List Georgia Environmental Policy Act Project No. : Project Name: GEORGIA IS AREA AFFECTED? IF AFFECTED, HOW SEVERELY? AREA/CATEGORY NO YES UNKNOWN MINOR MEDIAN MAJOR UNKNOWN 1. Wetlands
Chesapeake Bay Watershed Agreement Final draft January 29, 2014
 Chesapeake Bay Watershed Agreement Final draft January 29, 2014 Public comment invited through March 17, 2014. Visit: www.chesapeakebay.net/watershedagreement 1 Preamble The Chesapeake Bay watershed is
Cannon River One Watershed, One Plan. POLICY COMMITTEE MEETING January 10, 2018 Rice County Government Center Faribault, MN
 Cannon River One, One Plan POLICY COMMITTEE MEETING January 10, 2018 Rice County Government Center Faribault, MN TASK Task 1. Aggregate Existing Physical & Spatial Data 1A. Create project maps 1B. Meeting
TMDL Report for Chesapeake Bay Shellfish Waters: Ware Creek, Taskinas Creek, and Skimino Creek Bacterial Impairments (VADEQ, 2010)
") As part of a long term commitment to environmental stewardship, James City County volunteers and staff have been gathering information about stream health throughout the County since 2008. The goal of
As part of a long term commitment to environmental stewardship, James City County volunteers and staff have been gathering information about stream health throughout the County since 2008. The goal of
Appendix A Section 404(b)(1) Evaluation
(1) Evaluation") Appendix A Section 404(b)(1) Evaluation I.PROJECT DESCRIPTION Section 404(b)(1) Yonkers Avenue, Village of Tuckahoe New York Section 14 Stream-bank Stabilization Section 404(b) (1) Evaluation a. Location:
Appendix A Section 404(b)(1) Evaluation I.PROJECT DESCRIPTION Section 404(b)(1) Yonkers Avenue, Village of Tuckahoe New York Section 14 Stream-bank Stabilization Section 404(b) (1) Evaluation a. Location:
Reservoir age, increasing human population,
 B-6249 02/12 Eagle Mountain Watershed Management Brent Clayton, Justin Mechell, David Waidler and Clint Wolfe* Reservoir age, increasing human population, and changing land uses have prompted the development
MARYLAND DEPARTMENT OF THE ENVIRONMENT 1800 Washington Boulevard Baltimore MD
 MARYLAND DEPARTMENT OF THE ENVIRONMENT 1800 Washington Boulevard Baltimore MD 21230 410-537-3000 1-800-633-6101 Martin O Malley Governor Anthony G. Brown Lieutenant Governor November 6, 2009 Shari T. Wilson
STREAM AND BUFFER AREA PROTECTION/RESTORATION
 STREAM AND BUFFER AREA PROTECTION/RESTORATION AMENDMENT OPTIONS TO STRENGTHEN POLICY IN HEADWATERS AREAS DRAFT SUBSEQUENT TO THE JANUARY 25, 2007 MEETING OF THE PLANNING COMMISSION ENVIRONMENT COMMITTEE
TORCH LAKE TOWNSHIP WATER QUALITY ACTION PLAN
 TORCH LAKE TOWNSHIP WATER QUALITY ACTION PLAN Elk-River-Chain-of-Lakes Gaps Analysis Project The Watershed Center Grand Traverse Bay Tip of the Mitt Watershed Council Michigan Department of Natural Resources
Testimony of Shari T. Wilson, Secretary Maryland Department of the Environment. Before. The Senate Committee on Environment and Public Works
 Testimony of Shari T. Wilson, Secretary Maryland Department of the Environment Before The Senate Committee on Environment and Public Works The Clean Energy Jobs and American Power Act (S. 1733) Wednesday,
Nutrient Management for Water Quality Protection : A Case Study of Delaware
 Scientific registration n o : 1947 Symposium n o : 25 Presentation: Poster Nutrient Management for Water Quality Protection : A Case Study of Delaware's Inland Bays Watershed Gestion des nutriments pour
North Dakota s Nutrient Reduction Strategy. Presented to the 2016 ND Water Quality Monitoring Conference March 4, 2016
 North Dakota s Nutrient Reduction Strategy Presented to the 2016 ND Water Quality Monitoring Conference March 4, 2016 Nutrients Nutrients, in appropriate amounts, are essential to the growth and health
Regional Stormwater Management Plan for Troy Brook, Morris County, New Jersey
 Regional Stormwater Management Plan for Troy Brook, Morris County, New Jersey Executive Summary Troy Brook is in the Whippany River watershed, which has the first TMDL in the State of New Jersey, for fecal
orking Trees for Water Quality
 W Agroforestry orking Trees for Water Quality Working Trees: a partner in watershed management. Agroforestry helps to protect water quality while achieving both landowner and community objectives. Water
Protecting & Restoring Local Waters and the Chesapeake Bay
 Protecting & Restoring Local Waters and the Chesapeake Bay Restore America s Estuaries National Conference Gregory Barranco Chesapeake Bay Program Office November 2010 The Chesapeake Bay and Watershed
Coastal Bays. report card. Modeling nutrients, assessing climate vulnerabilities, and promoting environmental justice
 One of only 28 such programs nationwide, the goal of the Maryland Program is to protect and enhance the watershed, which includes, Pines and, and Assateague Island ational Seashore. The 175-square mile
BIG ROCHE A CRI LAKE CHARACTERISTICS
 BIG ROCHE A CRI LAKE CHARACTERISTICS Lake Description Big Roche Cri Lake is located in north central Adams County and has a surface area of 205 acres, a shoreline length of 6.1 mile, a volume of 6,993
BMP 5.4.2: Protect /Conserve/Enhance Riparian Areas
 BMP 5.4.2: Protect /Conserve/Enhance Riparian Areas The Executive Council of the Chesapeake Bay Program defines a Riparian Forest Buffer as "an area of trees, usually accompanied by shrubs and other vegetation,
The Hypoxic Zone in the Gulf of Mexico
 The Hypoxic Zone in the Gulf of Mexico References Council Committee on Environmental and Natural Resources. 2003. An Assessment of Coastal Hypoxia and Eutrophication in U.S. Water. National Science and
CHAPTER 15 WATER POLLUTION. INTO THE GULF Researchers try to pin down what s choking the Gulf of Mexico
 CHAPTER 15 WATER POLLUTION INTO THE GULF Researchers try to pin down what s choking the Gulf of Mexico SAVING THE BAY Teams of researchers try to pin down what s choking the Chesapeake Water pollution
The Status of Pompeston Creek, : From Data to Action. Pompeston Creek Watershed Association
 Pompeston Creek Watershed Association P.O. Box 2883 Cinnaminson, NJ 08077 (856) 235-9204 www.pompestoncreek.org The Status of Pompeston Creek, 1998-2008: From Data to Action Pompeston Creek Watershed Association
CHESAPEAKE BAY COMPREHENSIVE WATER RESOURCES AND RESTORATION PLAN. Habitat GIT Meeting 9 May 2017
 CHESAPEAKE BAY COMPREHENSIVE WATER RESOURCES AND 255 255 255 237 237 237 0 0 0 217 217 217 163 163 163 200 200 200 131 132 122 239 65 53 80 119 27 RESTORATION PLAN 110 135 120 252 174.59 112 92 56 62 102
Bee Meadow Pond Shoreline Restoration Project
 Bee Meadow Pond Shoreline Restoration Project Executive Summary Bee Meadow Pond is one of three ponds located in Bee Meadow Park. The ponds are stocked for fishing, but boating and swimming are not allowed.
the ability to manage for a stable and among the jurisdictions, and productive crab population and fishery by implement accountable monitoring
 Blue Crabs Add Bay-wide annual catch limits to Crab catch share included in Additional give predictability to fishermen, Issues for Consideration list. Blue Crab Management Outcome: Improve have an allocation
Eutrophication: Tracing Nutrient Pollution Back to Penns Creek
 Eutrophication: Tracing Nutrient Pollution Back to Penns Creek Nutrients are substances that life depends on for growth and reproduction. However, when these nutrients enter our planets waterways in excess,
Coastal Bays. report card. Gold stars for partnerships. Black skimmers are dependent on island habit in the Coastal Bays
 22 26 21 214 One of only 28 such programs nationwide, the goal of the Maryland Program is and Assateague Island ational Seashore. The 175-square mile watershed is home to the treasured resources of St.
What Does It All Mean? CWA? Sara Esposito, P.E. DNREC Division of Watershed Stewardship
 What Does It All Mean? CWA? Sara Esposito, P.E. DNREC Division of Watershed Stewardship sara.esposito@state.de.us Why are we here? Just like pavement has helped move cars faster; it has also helped water
Maintaining Riparian Areas and Wetlands
 Maintaining Riparian Areas and Wetlands Riparian areas are the lands along the banks of our rivers, lakes, and tidal waters. Many riparian areas not only border surface waters, but they are often adjacent
HARPETH RIVER/JONES CREEK WATERSHED-BASED PLAN
 HARPETH RIVER/JONES CREEK WATERSHED-BASED PLAN Harpeth River Watershed Association PO Box 1127 Franklin, TN 37065 March 2007 Table of Contents Page 1. Identification of Causes and Sources 1 1.1. Unnamed
DEVELOPING A WATERSHED IMPROVEMENT PLAN TO MEET MULTIPLE COMMUNITY OBJECTIVES IN GAINESVILLE AND HALL COUNTY, GEORGIA
 DEVELOPING A WATERSHED IMPROVEMENT PLAN TO MEET MULTIPLE COMMUNITY OBJECTIVES IN GAINESVILLE AND HALL COUNTY, GEORGIA Chrissy, Thom 1, David Dockery 2, Kevin McInturff 3, Betsy Massie 1, and Lauren Murphy
Coastal Wetlands. About Coastal Wetlands. Contact Us. Water: Wetlands. You are here: Water Our Waters Wetlands Coastal Wetlands
 Contact Us Water: Wetlands You are here: Water Our Waters Wetlands Coastal Wetlands Coastal Wetlands About Coastal Wetlands Coastal Wetlands Initiative Managing Stressors Tools & Links About Coastal Wetlands
BAY BAROMETER. Health and Restoration. in the Chesapeake Watershed
 BAY BAROMETER 212-213 Health and Restoration in the Chesapeake Watershed AT A GLANCE 212-13 BAY HEALTH RESTORATION Water Quality Wetlands 29 percent of the Bay and its tidal rivers met overall conditions
Pennsylvania Pequea and Mill Creek Watershed Section 319 National Monitoring Program Project
 Pennsylvania Pequea and Mill Creek Watershed Section 319 National Monitoring Program Project Figure 36: Pequea and Mill Creek (Pennsylvania) Watershed Project Location 231 T-1 C-1 T1-3 T-4 C1-2 T2-3 T-2
Boulder Elkhorn TMDL Project. TMDL Document Public Comment Meeting June 27, 2013
 Boulder Elkhorn TMDL Project TMDL Document Public Comment Meeting June 27, 2013 Presentation Outline: What are TMDLs? Boulder Elkhorn TMDL Project Area What s in a TMDL document? Sediment Overview Temperature
ALMY POND TMDL MANAGEMENT PLAN
 ALMY POND TMDL MANAGEMENT PLAN PUBLIC WORKSHOP Presented by: City of Newport Department of Utilities And Pare Corporation May 7, 2014 Presentation Overview Introduction to Almy Pond Project Introduction
Water for Virginia Master Naturalists. What are the types What is important to know about: Functions Values Issues
 Water for Virginia Master Naturalists What are the types What is important to know about: Functions Values Issues Francis J. Reilly, Jr. http://advancedmastergardener.org/water.htm Frank@TheReillyGroup.net
Primer introduction to watershed management Plan Process highlight the major steps of plan development Project types look at some examples of common
 1 Primer introduction to watershed management Plan Process highlight the major steps of plan development Project types look at some examples of common projects Plan Organization how to read the plan Next
ELK RAPIDS TOWNSHIP WATER QUALITY ACTION PLAN
 ELK RAPIDS TOWNSHIP WATER QUALITY ACTION PLAN Elk-River-Chain-of-Lakes Gaps Analysis Project The Watershed Center Grand Traverse Bay Tip of the Mitt Watershed Council Michigan Department of Natural Resources
Long Island s. Environmental Issues. Environmental Issues. Environmental Setting. Environmental Setting. Suburbia and the Environment
 Environmental Issues Long Island s Environmental Issues Copyright 2011 AFG 1 agricultural land air pollution aquifers automobile barrier islands biozones fisheries groundwater recharge invasive species
Understanding Nutrients and Their Affects on the Environment
 Understanding Nutrients and Their Affects on the Environment Humans & Ecosystems Humans are just like ecosystems, too much or too little of a nutrient is bad for the system. Nutrient management is a balancing
State of the Blanchard River Watershed in (condensed version)
") State of the Blanchard River Watershed in 2016 (condensed version) State of Watershed 2016 Report Introduction - The Total Maximum Daily Load (TMDL) Report for the Blanchard River watershed was adopted
State of the Blanchard River Watershed in 2016 (condensed version) State of Watershed 2016 Report Introduction - The Total Maximum Daily Load (TMDL) Report for the Blanchard River watershed was adopted
Center for Nutrient Solutions (CNS) Nutrient Solution Scenarios Concept Paper September 5, 2014 Draft
 Nutrient Solution Scenarios Concept Paper September 5, 2014 Draft") I. Introduction Center for Nutrient Solutions (CNS) Nutrient Solution Scenarios Concept Paper September 5, 2014 Draft A key goal of the CNS is to develop and test tools for evaluating tactics and strategies
I. Introduction Center for Nutrient Solutions (CNS) Nutrient Solution Scenarios Concept Paper September 5, 2014 Draft A key goal of the CNS is to develop and test tools for evaluating tactics and strategies
2016, 2017 Estuarine Water Quality and Modeling in the Royal and Cousins Rivers
 2016, 2017 Estuarine Water Quality and Modeling in the Royal and Cousins Rivers Angela Brewer and Robert Mohlar Division of Environmental Assessment Bureau of Water Quality Protecting Maine s Air, Land
CLEARWATER TOWNSHIP WATER QUALITY ACTION PLAN
 CLEARWATER TOWNSHIP WATER QUALITY ACTION PLAN Elk-River-Chain-of-Lakes Gaps Analysis Project The Watershed Center Grand Traverse Bay Michigan Department of Environmental Quality July 2011 Purpose The Grand
Appendix X: Non-Point Source Pollution
 Appendix X: Non-Point Source Pollution Sources Nonpoint source of pollution, unlike pollution from industrial and sewage treatment plants, comes from many different sources. Nonpoint source pollution is
Regional Watershed Planning. Calumet Summit 2010: A Call to Connect Calumet Conference Center April 27, 2010
 Regional Watershed Planning Calumet Summit 2010: A Call to Connect Calumet Conference Center April 27, 2010 Basins The Calumet Region Watershed Communities Land Cover- 2006 Impervious Cover 303d Listed
4. Ponds and infiltration BMPs can achieve 60 to 100% removal efficiencies for sediment.
 Landscape BMPs For the purposes of this project, preventive measures have been categorized into two categories: landscape BMPs and source prevention BMPs. Landscape BMPs includes both vegetative practices
Water Quality Ecosystem Services in the Urban Environment
 Water Quality Ecosystem Services in the Urban Environment Dianna Hogan and JV Loperfido ACES 2010 December 7, 2010 U.S. Department of the Interior U.S. Geological Survey Water Quality Ecosystem Services
A Guide to Shoreline Management Planning For Virginia s Coastal Localities
 A Guide to Shoreline Management Planning For Virginia s Coastal Localities Introduction People who live along Virginia s shore enjoy a natural connection to the water. When erosion threatens their property,
River Monitoring and Water Resource Terms
 River Monitoring and Water Resource Terms Baseflow: River discharge or flow composed of ground water drainage and delayed surface drainage. Baseflow is typically characterized as that portion of river
ANCR INDIVIDUAL RESPONSES SUMMARY: 2/11/04 WATER RESOURCES GOALS AND OBJECTIVES
 ANCR INDIVIDUAL RESPONSES SUMMARY: 2/11/04 WATER RESOURCES GOALS AND OBJECTIVES Goal 1: Protect the health and safety of the Dane County population. a. Prevent development that may have an adverse effect
Support legislation that will protect the quantity of water in Lake Erie
 Specific Regional Priorities Each of Pennsylvania s major drainage basins has an array of individual characteristics that distinguish it from other regions of the state. These include diverse geographic
City of Texarkana, Arkansas. Storm Water Pollution
 City of Texarkana, Arkansas Storm Water Pollution STORM WATER GUIDE What is Storm Water Pollution? Stormwater can provide a toxic discharge which can enter into a lake, river or coastal water system. As
Fish Habitat Management Strategy Outline
 Fish Habitat Management Strategy Outline Executive Summary 1. CBP Communications team will draft after the other sections are complete. Outcome and Baselines Fish Habitat Outcome: Continually improve effectiveness
Restoring the Water-Quality Conditions in the Chesapeake Bay: What is working and what still needs to be done
 Restoring the Water-Quality Conditions in the Chesapeake Bay: What is working and what still needs to be done Scott Phillips, USGS Water-Quality Goal Team January 12, 2015 Many Contributors Authors: Christina
Science Enhanced Scope and Sequence Grade 6. Water Quality
 Water Quality Strand Topic Living Systems Investigating water quality Primary SOL 6.7 The student will investigate and understand the natural processes and human interactions that affect watershed systems.
Monitoring Stormwater Best Management Practices: Why Is It Important and What To Monitor
 Monitoring Stormwater Best Management Practices: Why Is It Important and What To Monitor Scott D. Struck, Ph.D. US EPA, Urban Watershed Management Branch New Jersey Water Monitoring Workshop 4/20/2006
Climate Change and Chesapeake Bay Habitats
 Climate Change and Chesapeake Bay Habitats Donna Marie Bilkovic STAC Chesapeake Bay Forage Base Workshop 12 November 2014 http://www.chesapeake.org/stac/ Virginia Institute of Marine Science www.ccrm.vims.edu
Scientific overview: Water quality functions of coastal buffers
 Scientific overview: Water quality functions of coastal buffers Caitlin Chaffee, Coastal Policy Analyst RI Coastal Resources Management Council November 21, 2013 Buffer Zone Setback = Minimum Distance
VEGETATIVE, WATER, FISH AND WILDLIFE RESOURCES POLICIES
 VEGETATIVE, WATER, FISH AND WILDLIFE RESOURCES POLICIES The County will: GOALS AND OBJECTIVES 1.1 Conserve, Enhance, Protect, Maintain and Manage Vegetative, Water, Fish and Wildlife Resources Promote
St. Joseph River Watershed 319 Project Technical Subcommittee November 3, 2003 Meeting Summary DRAFT
 St. Joseph River Watershed 319 Project Technical Subcommittee November 3, 2003 Meeting Summary DRAFT Attendees Sandra Nordmark, FOTSJR Steve Blumer, USGS Water Resources Division Todd Kesselring, Elkhart
Hoosier Creek Watershed All of Ely drains into Hoosier Creek, which runs north to south along the west side of Ely. Hoosier Creek, Hydrologic Unit Cod
 Hoosier Creek Watershed All of Ely drains into Hoosier Creek, which runs north to south along the west side of Ely. Hoosier Creek, Hydrologic Unit Code (HUC) 8 07080208, drains into the Coralville Reservoir,
Maryland s s Critical Area Program
 Maryland s s Critical Area Program Overview of the Critical Area Program Highlights of 2008 Legislative Session Cecil County Land Use Alliance May 29, 2008 What Is the Critical Area Program? Based on Chesapeake
9. Evaluation Mechanisms
 9. Evaluation Mechanisms Not everything that can be counted counts, and not everything that counts can be counted. - Albert Einstein Introduction Watershed planning is meant to be an iterative process
3D WETLAND MANAGEMENT
 3D WETLAND MANAGEMENT 1. ISSUE Wetlands are one of the most productive ecosystems. They provide biological and chemical functions to the landscape that serve the watershed including the moderation of nutrient
Restoring the Chesapeake Bay Challenges & Opportunities
 Restoring the Chesapeake Bay Challenges & Opportunities Jeff Corbin Senior Advisor for Chesapeake Bay U.S. EPA May 29, 2014 A few things to talk about History of Bay Restoration How are we doing? What
Lower Patuxent River In Calvert County Watershed Characterization
 Lower Patuxent River In Calvert County Watershed Characterization December 2003 In support of Calvert County s Watershed Restoration Action Strategy for the Lower Patuxent Watershed Product of the Maryland
ATTACHMENT 1 GEPA CHECKLIST & Historical Archeological & Natural Heritage Preservation Documents
 ATTACHMENT 1 GEPA CHECKLIST & Historical Archeological & Natural Heritage Preservation Documents INTRODUCTION The 1991 Session of the Georgia General Assembly passed Senate Bill 97, as amended, and it
Slide 1: Welcome to today s The Nitrogen Cycle presentation, where we ll be talking to you about the importance of nitrogen in our environment.
 Slide 1: Welcome to today s The Nitrogen Cycle presentation, where we ll be talking to you about the importance of nitrogen in our environment. 1 Slide 2: Barnegat Bay, like many coastal areas in the country,
WASA Quiz Review. Chapter 2
 WASA Quiz Review Chapter 2 Question#1 What is surface runoff? part of the water cycle that flows over land as surface water instead of being absorbed into groundwater or evaporating Question #2 What are
Decision Rationale. Total Maximum Daily Load for Phosphorus for the Sassafras River, Cecil and Kent Counties, Maryland 4/1/2002
 Decision Rationale I. Introduction Total Maximum Daily Load for Phosphorus for the Sassafras River, Cecil and Kent Counties, Maryland 4/1/2002 The Clean Water Act (CWA) requires a Total Maximum Daily Load
Chapter 4 Watershed Goals and Objectives
 Chapter 4 Watershed Goals and Objectives Eight (8) long-term watershed goals have been developed by the NEW Watershed Advisory Group (WAG) after consideration of discussions held during monthly watershed
Reducing Nitrogen, Phosphorus and Sediment Pollution Progress Update. Jeff Corbin, Senior Advisor to the EPA Administrator
 Reducing Nitrogen, Phosphorus and Sediment Pollution Progress Update Jeff Corbin, Senior Advisor to the EPA Administrator Reducing Pollution Briefing Package Overview 1. 29-11 Milestones 2. 211 Progress
Watershed master planning, City of Griffin, Georgia, USA
 Water Resources Management VII 3 Watershed master planning, City of Griffin, Georgia, USA J. K. Kaplan & B. J. Watson Tetra Tech, Water Resources Group, Atlanta, Georgia, USA Abstract Tetra Tech has assisted
National Estuary Program Activities in the Barnegat Bay. Jim Vasslides Barnegat Bay Partnership Ocean County College Toms River, New Jersey
 National Estuary Program Activities in the Barnegat Bay Jim Vasslides Barnegat Bay Partnership Ocean County College Toms River, New Jersey The Barnegat Bay NEP 1987: Barnegat Bay Study Act (Chapter 387)