Georges Creek Watershed Characterization
|
|
|
- Solomon Townsend
- 5 years ago
- Views:
Transcription

1 Georges Creek Watershed Characterization June 2001 In support of Allegany County s Watershed Restoration Action Strategy for the Georges Creek Watershed Product of the Maryland Department of Natural Resources In partnership with Allegany County
 Maryland Department of Natural Resources Tawes State Office Building 580 Taylor Avenue Annapolis,")

2 Parris N. Glendening, Governor Kathleen Kennedy Townsend, Lt. Governor Sarah J. Taylor-Rogers, Secretary Stanley K. Arthur, Deputy Secretary David Burke, Director, Chesapeake and Coastal Watershed Service (CCWS) Maryland Department of Natural Resources Tawes State Office Building 580 Taylor Avenue Annapolis, Maryland Telephone for CCWS Call toll free: DNR TTY for the Deaf: The Mission of the Maryland Department of Natural Resources To inspire people to enjoy and live in harmony with their environment, and to protect what makes Maryland unique our treasured Chesapeake Bay, our diverse landscapes, and our living and natural resources. The facilities and services of the Department of Natural Resources are available to all without regard to race, color, religion, sex, age, national origin, physical or mental disability.
3 Local Contributors to the Georges Creek Watershed Characterization Allegany County Steering Committee (Alphabetical Order by Last Name) Allegany County Staff Mayor Craig Alexander Town of Midland David V. Cotton Maryland Department of Planning Fred Crozier State Highway Administration Katharine Dowell Maryland Department of Natural Resources Keith N. Eshleman Appalachian Laboratory, University of Maryland Karen Fligger Interstate Commission on the Potomac R. Basin Warren Foote Town of Lonaconing Water Commission Jeffrey L. Griffith U.S. Geological Survey, WRD Craig A. Hartsock Allegany Soil Conservation District Joseph Hoffman Interstate Commission on the Potomac R. Basin James J. Kahl Maryland Dept. of the Environment Paul Kahl Allegany County Dept. of Public Works William Kenny Kenny Markets Ursula Lemanski National Park Service Larry Lubbers Maryland Department of Natural Resources Constance Lyons MDE, Maryland Bureau of Mines Joe Mills MDE, Maryland Bureau of Mines William Parrish Maryland Dept. of the Environment-TARSA Kevin Roy Mountainview Landfill William Richmond Georges Creek Watershed Association Benjamin Sansom Allegany County Planning Division Chief Mayor Donald T. Smith Town of Westernport John Torrington Garrett County Andrea Walker US Army Corps Of Engineers Frank Williams Mountainview Landfill Administrator John Winner Town of Lonaconing W. Stephen Young Allegany County Dept. of Public Works Department of Community Services, Division of Planning Benjamin Sansome, Virginia McGann, Alison Rice Department of Public Works W. Stephen Young
4 State, Regional and Federal Contributors To the Georges Creek Watershed Characterization DNR Others Coastal Zone Management Division Katharine Dowell, Ken Sloate Fisheries Service Ken Pavol, Alan Klotz Resource Assessment Service (RAS) Ron Klauda, Paul Petzrick, Sherm Garrison Watershed Management and Analysis Division, CCWS John Wolf, Greta Guzman, Fred Irani, David Bleil, Michael Herrmann, Helen Stewart, Ted Weber Watershed Restoration Division Larry Lubbers Wildlife & Heritage Division Lynn Davidson Maryland Dept. of Agriculture (MDA) John Rhoderick, Louise Lawrence Maryland Department of the Environment (MDE) Constance Lyons, Denice Clearwater, Julie Labranche, Steven Bieber, Robert Daniel Maryland Department of Planning (MDP) Deborah Weller Editor and Primary Author Ken Shanks, Watershed Management and Analysis Division (DNR CCWS)
5 TABLE OF CONTENTS EXECUTIVE SUMMARY... iv INTRODUCTION...1 Watershed Selection...1 Location...1 Purpose of the Characterization...1 Identifying Gaps in Information...2 Adaptive Management...2 WATER QUALITY...5 Designated Uses...5 Not Supporting Designated Use Listings...5 Water Quality Indicators...6 Interpreting Water Quality Indicators Tributary Team Characterization...8 Water Quality Assessment Dissolved Oxygen 2. Bacterial Contamination 3. High ph and Chemical Concentrations 4. High Quality Streams 5. Total Maximum Daily Loads: Nutrients and BOD 6. Drinking Water and Reservoirs of the Midland-Lonaconing Water System Mining Impacts / Acid Mine Drainage Overview 2. History of Local Mining and Subsurface Drainage 3. Cause and History of Local Acid Mine Drainage 4. Mining Impacts on Drinking and Ground Water 5. Mine Reclamation 6. Mill Run Baseline Study 7. AMD Tracking Point Sources...19 NonPoint Sources...19 LAND USE...22 Landscape Indicators...22 Interpreting Landscape Indicators 1997 Land Use...25 Land Use Projection to Floodplain Management and Watershed Restoration Opportunities...28 Geology...29 i
6 Green Infrastructure...31 Protected Lands...33 Smart Growth...33 Soils and Slope Interpreting Local Conditions with Natural Soil Groups 2. Soils and Watershed Planning Wetlands Introduction to Wetland Categories 2. Tracking Wetlands 3. Interpreting Wetland Distribution LIVING RESOURCES AND HABITAT...42 Overview...42 Living Resource Indicators...43 Interpreting Living Resource Indicators Benthic Macroinvertebrates...45 Why Look at Benthos in Streams? Fish Mill Run Trout Recolonization Sensitive Species Habitat Protection Categories 2. Rare Fish and Mussels RESTORATION TARGETING TOOLS...53 Stream Corridor Assessment...53 Fish Blockages...53 Stream Buffer Restoration Benefits and General Recommendations 2. Using GIS 3. Headwater Stream Buffers 4. Land Use and Stream Buffers 5. Nutrient Uptake from Hydric Soils in Stream Buffers 6. Wetland Associations 7. Optimizing Benefits by Combining Priorities Wetland Restoration...62 RELATED PROJECTS...64 Overview...64 Georges Creek Mainstem Projects Barton Wall Repair & Stream Restoration 2. Lonaconing Island Restoration Project Neff Run Watershed Integrated Approach to Restoration Neff Run Watershed Stream Corridor Assessment ii
7 2. Neff Run Watershed Restoration Plan 3. Current Neff Run Projects 4. Neff Run Restoration Project Mill Run Watershed Projects Acid Mine Drainage Mitigation 2. Mill Run Stream Restoration POTENTIAL BENCHMARKS FOR WRAS GOAL SETTING...74 ADDITIONAL INFORMATION...75 Sources of Information...75 Abbreviation Key...77 Contacts for More Information...78 LIST OF MAPS Map Name Page 1 WRAS Project Area Streams and Subwatersheds Monitoring Stations Coal Mining Extent MDE Permits Generalized Land Use Geology Green Infrastructure Protected Lands and Smart Growth Soils by Natural Soil Group Slope Wetlands Trout Habitat and Acid Mine Drainage Sensitive Species Stream Order Land Use Scenario for Stream Buffer Restoration Hydric Soils and Wetland Proximity Scenario Stream Prioritization Scenario Wetland Restoration Opportunities Construction Projects...65 iii
8 EXECUTIVE SUMMARY The purpose of the Watershed Characterization is to assist Allegany County in collecting information and identifying issues that may be used as the County generates its Watershed Restoration Action Strategy (WRAS) for the Georges Creek watershed. Georges Creek is a tributary of the North Branch Potomac River in Maryland. The Georges Creek watershed encompasses about 47,700 acres (74 square miles) of land in Allegany (67%) and Garrett (33%) Counties. The Creek drains north to south a mountain valley bounded by Big Savage Mountain on the west and Dans Mountain on the east. Frostburg, the largest community in the watershed, is situated at the Georges Creek headwaters. Most Georges Creek tributaries on the west side of the mainstem have their headwaters in Garrett County. Fortunately, Garrett County accepted Allegany County s invitation to participate on the WRAS Steering Committee and to have the stream corridor assessment include both Counties. Allegany County, Maryland is receiving Federal grant funding and State technical assistance to prepare a WRAS for the Georges Creek watershed for several reasons: the 1998 Maryland Clean Water Action Plan identified the Georges Creek watershed as a Priority Watershed in need of restoration. Allegany County applied for grant funding and volunteered to develop a strategy in the watershed to improve water quality using protection and restoration projects. Water Quality Acid mine drainage (AMD) has a significant impact on water quality in the Georges Creek watershed. Excessive acidity and/or high concentrations of metals mobilized by acid complete eliminate aquatic habitat in some stream segments. The extent of AMD impacts on local waterways is not quantified in some stream segments and the severity of AMD water quality degradation varies in most streams. However, it appears that about one third of the watershed s stream miles have degraded water quality associated with AMD. In addition, altered hydrology caused by past mining activity is also dewatering some stream segments in the northern half of the watershed. This condition has caused essentially dry streams during otherwise natural low flow periods. Water quality concerns related to biological oxygen demand (BOD) and nutrients have been noted in the watershed, mostly the Georges Creek mainstem. This led to the watershed being scheduled for a total maximum daily load (TMDL) analysis. The Maryland Dept. of the Environment (MDE) has conducted water monitoring and will prepare a water quality analysis for Georges Creek by the end of It will focus on concerns associated with nutrients and BOD contributed primarily by inadequately treated sewage, sanitary sewer overflows and failing septic systems. iv
9 Land Use Approximately 71% of the Georges Creek watershed is forest land (68% forested in Allegany County and 79% in Garrett County). From a watershed-wide perspective, forest management practices on these lands appear to be contributing to good water quality. Agriculture covers about 12% of the watershed but prime agricultural soil only accounts for 1% of the watersheds soils. Agriculture s impacts on water quality appears to be localized, such as streams in some agricultural lands that do not have riparian forest buffers. Urban land is concentrated in Allegany County along the Georges Creek mainstem and tributaries in response to the steep topography that dominates the watershed. This urban land distribution contributes to flood hazard and tends to ensure that instances of inadequately treated sewage discharge readily enter local waterways. Urban is projected to expand over the next twenty years mostly at the expense of forest land. This change is not projected to be significant. Existing and projected impervious area is anticipated to remain between 4.5% and 5% of the watershed. Living Resources and Habitat Native brook trout populations inhabit headwater areas of at least five of the eight subwatersheds (Maryland 12-digit) in the Georges Creek watershed. However, these high quality aquatic habitats are isolated from each other because waters that degraded by AMD encompass downstream tributary areas and the mainstem of Georges Creek. Fish populations and stream bug populations (benthic macroinvertebrates) assessed in four Georges Creek mainstem sites and three tributary sites were rated as poor or very poor. The mainstem sites where in AMD-affected areas. Additional characterization of these aquatic populations will be conducted at 10 new sites in Restoration Targeting Tools Stream corridor assessments were completed for the Neff Run subwatershed in 1999 and for the remainder of the Georges Creek watershed in Winter 2000/2001. These assessments identify the status of stream buffers, stream bank erosion, and other conditions. This information will provide a foundation for targeting restoration projects. Computerized mapping was used to demonstrate concepts for restoration targeting and to help identify areas for additional site investigation for restoration of stream buffers and wetlands. Past flood damage and acid mine drainage (AMD) in the watershed is currently being mitigated through targeted projects and programs. Several projects already underway in the watershed demonstrate that these projects provide opportunities to enhance water quality and habitat improvement. By adding other funding sources to those available through the flood mitigation and/or AMD programs, both environmental and community benefits can be efficiently enhanced because mobilization and administrative costs can be minimized. v
10 INTRODUCTION Watershed Selection Maryland s Clean Water Action Plan, completed in 1998, identified water bodies that failed to meet water quality requirements. As part of the State s response, the Maryland Department of Natural Resources (DNR) is offering funding and technical assistance to Counties willing to work cooperatively to devise and implement a Watershed Restoration Action Strategy (WRAS) for the impaired water bodies. Allegany County is one of five Counties participating in the first round of the WRAS program. The portion of the Georges Creek watershed within Allegany County is the area selected for restoration. This watershed has several key characteristics: mountainous location, steep terrain, roads and buildings often located in flood-prone areas, current and past coal mining operations, and generally rural land uses including extensive forests. Location Georges Creek is a tributary to the North Branch of the Potomac River in mountainous Western Maryland. Approximately 67% of the Georges Creek watershed is in Allegany County, Maryland and the remainder is in Garrett County, Maryland. This area is the focus of the Watershed Restoration Action Strategy and this Watershed Characterization. Map 1 WRAS Project Area shows the geographic location of the WRAS watershed. Map 2 Streams and Sub-Watersheds shows that the two Counties share most of the tributaries on the west side of the Georges Creek mainstem. Purpose of the Characterization One of the earliest steps toward devising a Watershed Restoration Action Strategy is to characterize the watershed using immediately available information. This Watershed Characterization is intended to meet several objectives: briefly summarize the most important or relevant information and issues provide preliminary findings based on this information identify sources for more information or analysis suggest opportunities for additional characterization and restoration work. 1
11 Additional Characterization Recommended The Watershed Characterization is intended to be a starting point. It is part of a framework for a more thorough assessment involving an array of additional inputs: self-investigation by the local entity targeted technical assistance by partner agencies or contractors input from local stakeholders Stream Corridor Assessment, i.e. physically walking the streams and cataloguing important issues, is part of the technical assistance offered by DNR Synoptic water quality survey, i.e. a program of water sample analysis, can be used to focus on local issues like nutrient hot spots, point source discharges or other selected issues. This is also part of the technical assistance offered by DNR. Identifying Gaps in Information It is important to identify gaps in available watershed knowledge and gauge the importance of these gaps. One method is to review available information in the context of four physical / biological assessment categories that have been successfully applied in other watershed restoration efforts. These are the main categories that impact aquatic biota: Habitat: physical structure, stream stability and biotic community (including the riparian zone) Water Quantity: high water - storm flow & flooding; low water - baseflow problems from dams, water withdrawals, reduced infiltration Water Quality: water chemistry; toxics, nutrients, sediment, nuisance odors/scums, etc. Cumulative effects associated with habitat, water quantity and water quality. Adaptive Management In addition, the Watershed Characterization and the Watershed Restoration Action Strategy should be maintained as living documents within an active evolving restoration process. These documents will have to be updated periodically as new, more relevant information becomes available and as the watershed response is monitored and reassessed. This type of approach to watershed restoration and protection is often referred to as adaptive management. 2
12
13
14 WATER QUALITY Designated Uses All waters of the State are assigned a Designated Use in regulation, COMAR , which is associated with a set of water quality criteria necessary to support that use. A simplified summary of the Designation Uses in the Georges Creek watershed is listed below. (The Department of the Environment should be contacted for official regulatory information.) 9 - Use I-P: for water contact recreation, aquatic life, and potable water: Georges Creek mainstem. - Use III-P: for natural trout populations and potable water: all tributaries to Georges Creek. Not Supporting Designated Use Listings One of the more recent official statement on use limitations in the Georges Creek watershed is found in the State s water quality report issued August 2000: 13 Georges Creek ( ) - Data from the CORE station in the mainstem creek above Westernport (GEO0009) show elevated bacterial levels in the mainstem river that may be due to upstream runoff from urban and natural settings and sewerage problems. This reach of Georges Creek between Lonaconing and the North Branch Potomac River (7.8 miles) is considered to be partially supporting all uses. Data from seven biological sampling sites in four sub-watersheds were analyzed using draft biological criteria protocols. Because of poor fish communities (and some sites with poor benthic communities) at each station, the four sub-watersheds (Georges Creek mi. and 7.0 mi.; Staub Run mi.; Sand Spring Run mi.) were identified as not supporting all/aquatic life uses. Biologists noted low ph, siltation, and stream modification (channelization) as site-specific habitat and water quality issues that might affect the aquatic community. Based on 1996 listings, significant portions of the Georges Creek either do not support their designated use or partially do not support their designated use. 2 As required under Section 303(d) of the Federal Clean Water Act, Maryland tracks waterways that did not support their designated use in a prioritized list of Water Quality Limited Basin Segments sometimes simply called the 303(d) list. Georges Creek is referenced in the list in two places: - Nutrients. In the (d) list, the North Branch of the Potomac River (which includes Georges Creek) is listed as Priority #11. Nutrients from point, nonpoint and natural sources are identified as the problem. Georges Creek is also listed separately in the 1996 list for nutrients and suspended sediment from point, nonpoint and natural sources. (Recent monitoring by MDE suggests that nutrient 5
15 loads are not having measurable affects in Georges Creek. See the TMDL section for more information.) - Acid Mine Drainage. In the 1998 Additions to the 303(d) list, Georges Creek is listed as a medium priority for targeting acid mine drainage remediation within two years. Low ph (excessively acidic water) is listed as the problem. The 303(d) priority referenced above is established by the Maryland Department of the Environment. Information considered in setting these priorities include, but is not limited to, severity of the problem and the extent of understanding of problem causes and remedies. These priorities are used to help set State work schedules various programs including total maximum daily loads (TMDLs). Water Quality Indicators The Maryland Clean Water Action Plan published in 1998 listed the following water quality indicators for the Georges Creek. 3 The Georges Creek is also identified in the Plan as a Category 1 Priority Watershed in need of restoration during the next two years. For more details on the Clean Water Action Plan see Water Quality Indicator (click name for details) State 303(d) Impairment No. Finding Rank Bench Mark 3 Fail 3 = additional protection needed. This watershed is included in the 303d list. Modeled TN Load 4.29 lbs/acre Modeled TP Load 0.37 lbs/acre Pass Pass In comparison to 138 watersheds in Maryland, this watershed is among the 104 watersheds (75%) with lower loadings. In comparison to 138 watersheds in Maryland, this watershed is among the104 watersheds (75%) with lower loadings. 6
16 Interpreting Water Quality Indicators State 303(d) Impairment Number. This number is used to characterize watersheds relative to regulatory requirements of the Federal Clean Water Act. It is based on numerous water quality-related factors that are tracked by the State of Maryland under these federal requirements. Modeled TN Load. TN refers to Total Nitrogen. Nitrogen Load is a measure of how much of this important nutrient is reaching streams and other surface waters. For each type of land use in the watershed, on average, stormwater tends to carry or transport a characteristic amount of nitrogen from the land to nearby streams. Based on these averages, computers can be used to estimate (model) how much nitrogen is likely to be reaching local streams. This method was applied Statewide to all the 138 watersheds in Maryland to allow comparison of modeled total nitrogen load among them. The rank of pass means that this watershed was among the 104 (75%) out of 138 total watersheds in Maryland that had the lower estimated total phosphorus load. Modeled TP Load. TP refers to Total Phosphorus. It is a measure of how much of this important nutrient is reaching streams and other surface waters. The ranking for modeled TP Load was performed in parallel to the ranking for modeled TN Load above. (Note: details of the models differ.) The rank of pass means that this watershed was among the 104 (75%) out of 138 total watersheds in Maryland that had the lower estimated total phosphorus load. 7
17 Tributary Team Characterization As part of the work of the Upper Potomac Tributary Team, Georges Creek water quality measured at Franklin is characterized below: Parameter Status 1996/1998 Data Trend 1985 to 1998 Data Nitrogen: total good improving (31%) Phosphorus: total fair no trend Suspended Solids: total poor no trend Water Quality Assessment The Georges Creek watershed includes areas of excellent water quality that are mostly found in headwater tributaries. It also has areas exhibiting water quality so poor that aquatic life is eliminated mostly due to acid mine drainage (AMD). The following summaries indicate the range of water quality issues identified in the watershed. Much of the water quality discussed in this section is available via the Internet at and 1. Dissolved Oxygen For many years, dissolved oxygen levels have been measured at a monitoring station (GEO0009) on Georges Creek upstream of Westernport. Throughout the period 1985 and 2000, dissolved oxygen levels have been consistently better than minimum State standard of 5 mg/l. The range for this time period was from nearly 8 mg/l to over 12 mg/l. See Map 3 Monitoring Stations for the station location. 2. Bacterial Contamination Several sources reported bacterial contamination in Georges Creek between the mouth and Lonaconing. 13, 19 One source notes contamination in several tributary streams. 19 This problem is associated with failing septic systems, inadequate sewage treatment and direct discharge of untreated sewage. It may be noted that this segment of Georges Creek is also a trout stocking area, which suggests that the severity of the problem may have been reduced in recent years. Bacterial contamination as measured by fecal coliforms in Georges Creek is being tracked at a long term monitoring station just upstream of Westernport. In general, fecal coliform levels are seasonally high in summer months. Peak levels in the late 1990s are generally lower that peaks in the early 1990s and earlier. This station is labeled as GEO0009 on Map 3 Monitoring Stations. It is anticipated that MDE will release a Water Quality Assessment later this year that will address this issue in detail. In addition, the 2001 Maryland General Assembly is considering a funding initiative that could potentially be used to help eliminate this problem. 8
18 3. High ph and Chemical Concentrations Streams in the Georges Creek watershed that are impacted in varying degrees by acidity associated with AMD are shown in Map 13 Trout Habitat and Acid Mine Drainage. In the most impacted stream segments, ph levels below 3.0 have been measured. This is about the same acidity as stomach acid and generally eliminates most forms of aquatic life. The map does not show the variation in severity of the acidity problem that is know to exist. High concentrations of chemicals such as iron, aluminum, manganese and others are frequently associated with low ph levels. These water column constituents naturally occur at low levels and are beneficial to aquatic life at low concentrations. However, high concentrations can inhibit growth and survival of many aquatic organisms. The ph and chemical concentrations in Georges Creek vary along its course depending upon buffering influences from some tributaries and additional acidic inputs from others. On balance, the magnitude of the ph problem is greater than the available buffering capacity of the stream system. Therefore, Georges Creek is excessively acidic throughout much of its length. At the long term monitoring station (GEO0009) shown in Map 3 Monitoring Stations, iron concentrations are highly variable. Peak iron concentrations measured between 8 and 15 mg/l are indicative of the dissolved metal issue in Georges Creek. In addition, acid mine monitoring data, generally including ph and metals concentrations, have been collected in streams by MDE Bureau of Mines. However, analysis and summarization of the data needs to be accomplished. 4. High Quality Streams In the Georges Creek watershed, the highest quality water tends to be in headwater areas of tributaries that are not affected by AMD. These high water quality areas generally coincide with the trout habitat areas shown in Map 13 Trout Habitat and Acid Mine Drainage. The streams shown as blue lines in the map may not have sufficient water quality data characterize their condition. The map shows that high quality areas are isolated from each other and that downstream water quality problems are not effectively addressed by dilution. 9
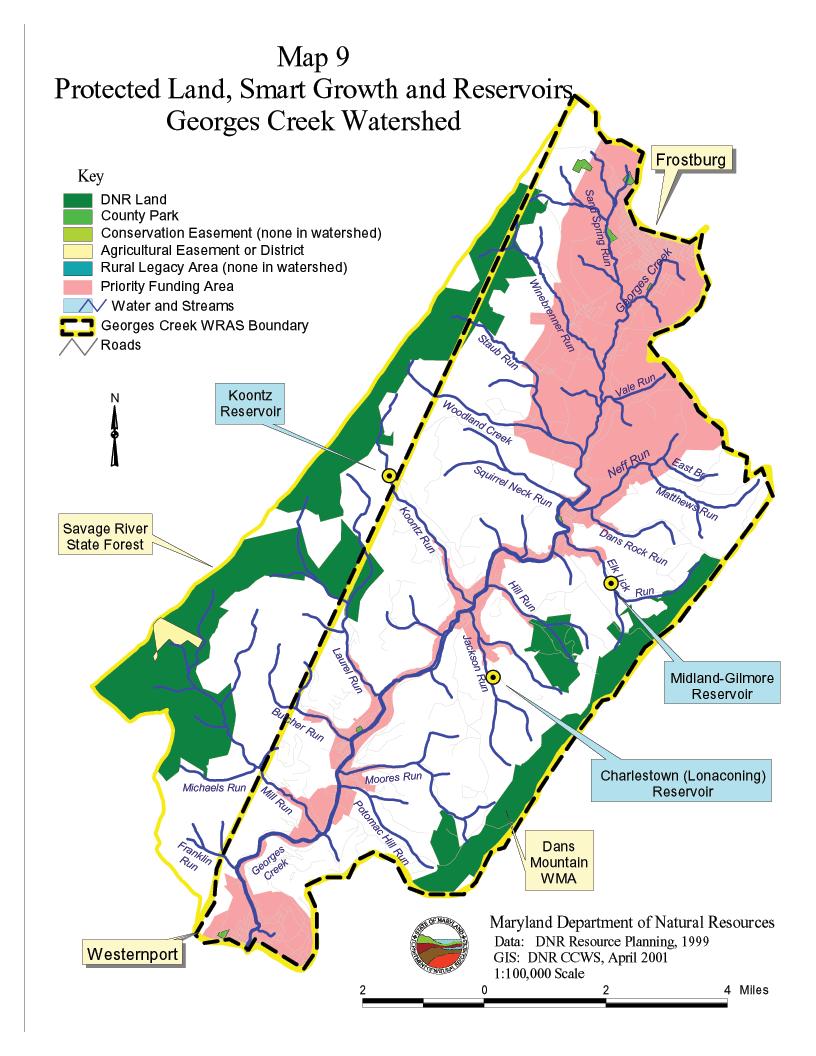
19 5. Total Maximum Daily Loads: Nutrients and BOD In the 2000 Maryland Section 305(b) Water Quality Report issued August 2000, Georges Creek is among the North Branch Potomac River Basin watersheds that is expected to have a Total Maximum Daily Load (TMDL) prepared. 13 The report included this information because available historic data suggested that Georges Creek water quality was being degraded by nutrients and/or biological oxygen demand (BOD). Both of these pollutants are were believed to be contributed by a combination of inadequate sewage treatment, sanitary sewer overflows, failing septic systems. MDE recently conducted water quality monitoring to collect sufficient current data for analysis. Their findings indicate that the pollutants of concern, nutrients and biological oxygen demand (BOD) may not be degrading Georges Creek water quality to a degree that warrants completion of a TMDL. Based on this new information and consistent with requirements of the Federal Clean Water Act, MDE will prepare a Water Quality Analysis (WQA) before the end of calendar year 2001 that documents their findings. It is anticipated that the WQA will indicate that TMDL limits for Georges Creek nutrients or BOD are not necessary at this time. The monitoring information and analysis in the WQA report will be an important addition to the WRAS Characterization. In addition, MDE will also consider the impacts of nutrients and BOD in the Potomac River which will include inputs from the Georges Creek watershed. If Georges Creek pollutants are found to be contributing to downstream water quality problems, TMDL limits may be adopted at that time. However, this work has yet to be scheduled. 6. Drinking Water and Reservoirs of the Midland-Lonaconing Water System 25 Concentrations of iron and manganese in the groundwater of the Georges Creek region tend to be high, exceeding the recommended drinking water limit in the National Secondary Drinking Water Regulation of 0.3 mg/l and 0.05 mg/l respectively. In the thorough source water assessment reported by MDE in December 2000, current drinking water quality issues and susceptibility to increasing contamination in the Midland- Lonaconing Reservoirs relates primarily to fecal coliform bacteria and turbidity related to sediment. The three reservoirs in the Georges Creek watershed are shown in Map 9 Protected Land, Smart Growth and Reservoirs. In general these reservoirs provide water of acceptable quality for potable uses. The majority of each of the three reservoir watersheds is covered by forest and brush. Mining incorporates a small percentage of these watersheds and is not currently an issue. The synthetic contaminants that have been detected in the reservoirs were found at levels below recommended drinking water limits. 10
20
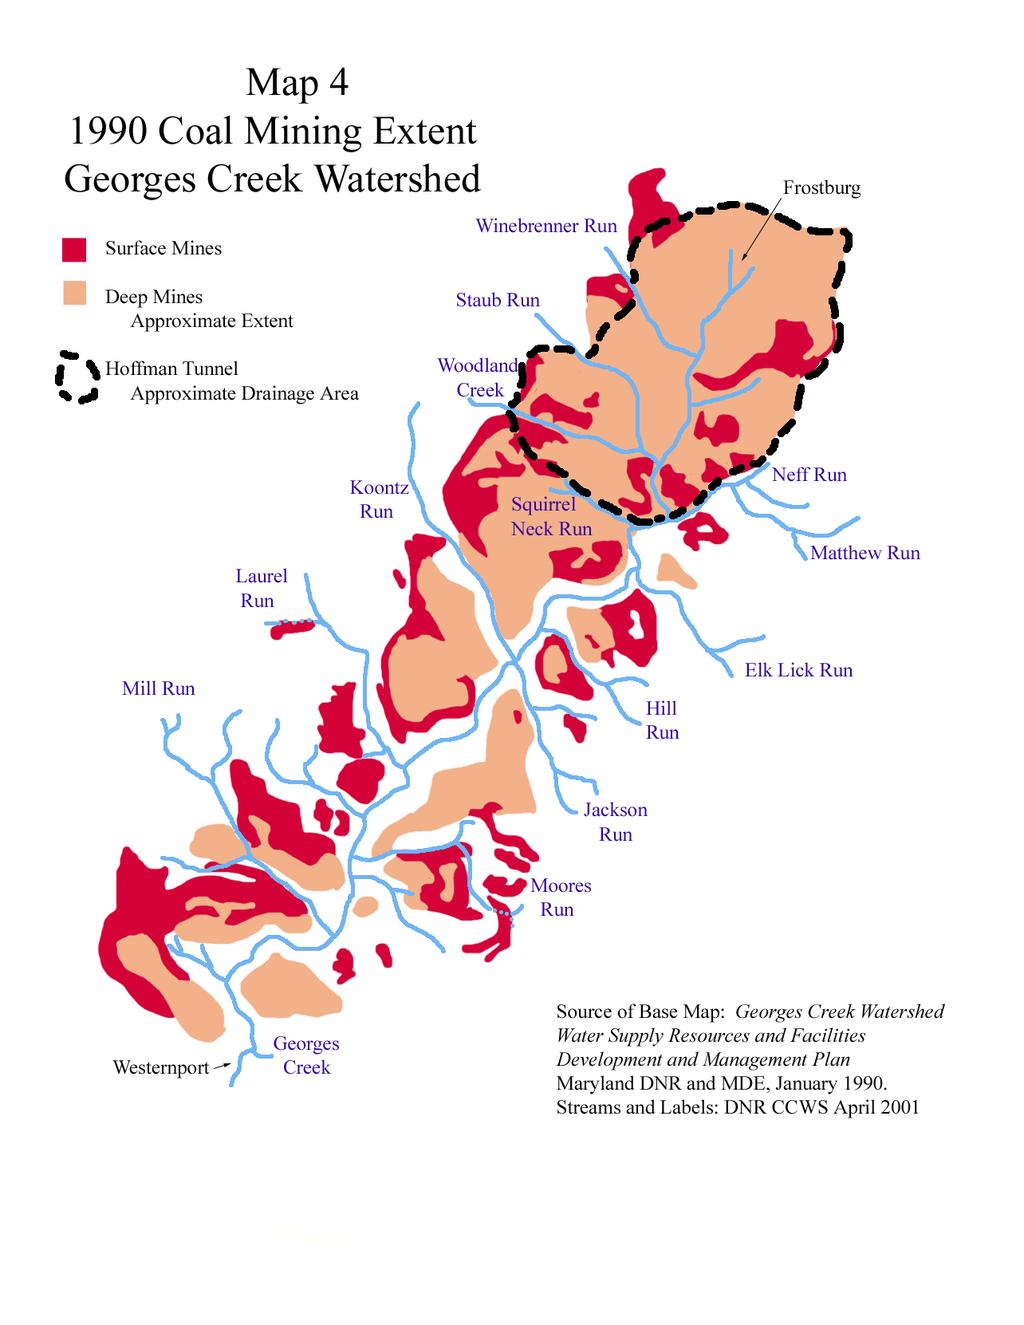
21 Mining Impacts / Acid Mine Drainage 1. Overview Mining for coal and related activities in the Georges Creek watershed have been, and continue to be, an important activities. Map Coal Mining Extent indicates that large areas of the watershed have either been surface mined or have deep mines beneath the surface. The magnitude of coal mining impacts in the Georges Creek watershed are unique in Maryland due to the extent and concentration of the mining activity. 10 These impacts vary greatly from place to place but, overall in the watershed, include: acidified stream and ground waters, seasonally dewatered stream segments, loss of aquatic habitat, lowering of the groundwater table and greatly altered hydrology, and surface subsidence associated with settling over deep mines. To help characterize the relationship of coal mining to surface water and groundwater conditions, several sections of a 1990 report by DNR and MDE are included here in subsections with headings labeled History of... or otherwise presented in quotes. The Georges Creek watershed has numerous stream segments where water quality is impacted by acid mine drainage (AMD). In some places acidic waters associated with AMD have severely altered aquatic habitat conditions and have eliminated habitat for species sensitive to low ph. Map 13 Trout Habitat and Acid Mine Drainage shows the extent of streams affected by AMD. The map does not show the variation in ph that occurs as various tributary flows of buffering or acidic waters mix. 2. History of Local Mining and Subsurface Drainage 19 Bituminous coal was first mined in the Georges Creek watershed around 1804 for local blacksmith forges, inns and homes. Mining activity increased later in the 1800s as the demand for coal in eastern Maryland made it economically feasible to raft coal downstream. Between 1900 and 1918, coal production in the region peaked and 4.5 to 5 million tons were mined annually in Western Maryland. Production decreased significantly [after World War I] because the region s primary coal seam, the Pittsburg Coal [Big Vein], was exhausted. Around 1945, surface (strip) mining became the predominant method of mining in the Georges Creek watershed and at present [1986 information], about 10 percent of the watershed is used for surface mining. The deep mines are now abandoned; although demand and improved technology could rejuvenate deep mining. The maps shows the approximate extent of deep and surface coal mining (past and present) in the Georges Creek watershed. At the turn of the century, subsurface ditches and tunnels were constructed to drain water accumulating in the deep mines. According to Slaughter and Daring (1962), one of the most extensive gravity drainage systems was constructed to drain the Pittsburg Coal seam at the base of the Monongahela Formation. The area drained covers about 14 square miles between Midland and Zihlman and includes the Hoffman drainage tunnel. The Hoffman drainage tunnel, completed in 1907, is two miles long and begins in the upper part of the Monongahela and ends downgrade in the middle of the Conemaugh Formation. Approximately a half-mile of auxiliary tunnels and five miles of ditches, draining both the Tyson and Pitsburg coal veins, are connected to the Hoffman tunnel. Groundwater that enters the underground mine workings above Midland flows to a low point in the coal seam near Borden Shaft and then along the Hoffman Tunnel into 12

22 Braddock Run near Clarysville, in the adjacent Wills Creek watershed. [The drainage area for the tunnel in shown in Map Coal Mining Extent.] In 1923, the Maryland Bureau of Mines estimated that discharge from the tunnel ranged from 14,000 to 30,000 gpm. In 1947, however, part of the tunnel collapsed reducing its outflow, and its average discharge in 1959 was 9,170 gpm (ranging from 4,400 to 17,500 gpm depending on the season). [Note: The table below suggests that the Hoffman Tunnel with 14 sq. miles drainage has less variation and sometimes greater in discharge rate than Georges Creek with its 72 sq mile drainage. This is probably because the Tunnel supercedes Georges Creek in access to groundwater.] Comparison of Discharge Rate (Cubic Feet Per Second) Georges Creek at Franklin and Hoffman Tunnel 19 Date Creek Tunnel Aug. 20, Sept. 23, May 17, Sept. 8, Subsidence also reduces the quantity of water available in the mined areas of Georges Creek watershed. Fractures in the strata above mine workings which may be less than 150 feet below the ground surface increase the capacity of the rocks to hold and transmit water as well as enhancing vertical flow. As a result of water loss to both fractures and tunnels, the water table drops and stream flows are reduced. Consequently, abandoned deep mining operations have diminished the quantity of both ground and surface water in the northern portion of the Georges Creek watershed. Georges Creek loses water to the deep mines between Midland and Woodland Creek and between Sand Spring Run and the Route 936 crossing (Green Associated, Inc. and others 1974). 13
23 Also south of Borden Shaft most or all of the flow of Georges Creek in intercepted by the Hoffman Tunnel drainage system during periods of extremely low basefow. (Slaughter and Darling, 1962). Tributaries of Georges Creek with dewatering problems are located north of Midland and include Vale Run, the lower portion of Squirrel Neck Run, the lower and middle portions of Woodland Creek and Staub Run (Green Associates, Inc. and others 1974). To prevent dewatering, some mining companies reconstructed stream channels but only maintained them long enough for proper mining conduct. Therefore, over the last few decades water has reentered the mine workings. New stream lining projects, however, are being implemented by the Maryland Bureau of Mines to alleviate dewatering problems in the Georges Creek watershed. So far, stream lining projects on Vale Run and Woodland Creek have been completed, and projects on Staub Run and Squirrel Neck Run are in progress [1990]. 3. Cause and History of Local Acid Mine Drainage 19 Pyrite (FeS 2 ), a sulfide mineral, often occurs in association with coal deposits. This mineral may react with water and atmospheric oxygen to produce sulfuric acid which, in turn, can dissolve metals such as iron, aluminum and manganese. Ground and surface waters that come in contact with exposed pyrite may become acidic and their concentrations of sulfate and metals may increase. The concentrations of individual metals vary depending upon local geology. Acidic water, with ph lower than 6.5, must be treated before it is used as drinking water. Acidity also limits recreational water use for swimming and fishing (low ph and fluctuations of ph cannot be tolerated by most fish including trout). Mining has deteriorated the quality of surface and groundwater supplies in the Georges Creek watershed by exposing pyrite to air and water, thus promoting the chemical reactions which produce acid. For example, precipitation percolating through mine waste may become polluted with acid, sulphate and metals. It then may infiltrate ground water, stand in pools concentrating toxins or run off into nearby streams. Water quality in the watershed is affected by both direct mine runoff and discharge, and via intermittent nonpoint source discharges from coal tipples (coal handling and loading facilities), gob piles (mine waste) and sediment from both active and abandoned sites. About 290 mine drainage discharge points have been identified in the Georges Creek watershed although not all discharge pollutants (Green Associates, Inc. and others, 1974). About two thirds of these points produce continuous discharge and the remaining third produce intermittent discharge. Other mining impacts include increases in surface runoff and erosion following changes in slope and the natural ground cover the may accompany strip mining. Subsequently, larger stream sediment loads are produced. In the Georges Creek watershed, this excess sediment is carried to the Potomac because of steep stream gradients. Abandoned and inadequately restored strip mines collect and contaminate surface and groundwater which may enter adjacent streams or deep mines. 14
24 4. Mining Impacts on Drinking and Ground Water Mining is not currently a problem for drinking water reservoirs or municipal wells in the Georges Creek watershed. 25 Locations of the three reservoirs in the watershed area shown in Map 9 Protected Lands, Smart Growth and Reservoirs. The greatest mining impact on surface water quality is in the southern portion of the watershed. Georges Creek and its tributaries south of Barton are unsuitable for potable water supplies because they have large acid loads (low ph values) and high levels of sulfate and other metals. Therefore, at present, historical mining limits the future development of surface water resources in the Georges Creek watershed. Existing community reservoirs, however, are not affected by mining operations In the Georges Creek watershed, mining only impacts the quality and quantity of water in the relatively shallow Monongahela Formation since it contains coal seams and loses water to the Hoffman Tunnel. The Hoffman tunnel s outflow (approximately 0.94 million gallons per day (mgd) per square mile) is about twice the assumed average rate of groundwater recharge (0.5 mgd per square mile) to local aquifers (Maryland Abandoned Mine Reclamation Plan, 1982). Still, the Monongahela Formation is heavily used for commercial/industrial, institutional and recreational supplies as well as individual domestic wells. The Conemaugh Formation, stratigraphically below the Monongahela Formation, has not been impacted by mining except for possible loss of water to the Hoffman Tunnel. The Conemaugh Formation which is tapped by the communities of Midlothian and Hoffman is the watershed s most important source of groundwater. The Pocono Formation (used by Frostburg) and other deep formations also have not been affected by mining. Therefore, in spite of mining impacts on the Monongahela Formation there is potential to the development of aquifers stratigraphically below it
25 5. Mine Reclamation Negative impacts of both surface and deep mining can be minimized by the diversion of water around mined areas and reclamation once mining operations are complete... The already abandoned mines in the Georges Creek watershed are difficult reclamation projects. Strip mines in Maryland operated without reclamation until 1955 when minimal requirements, far from satisfactory by present standards, were instated... Since 1979, the Maryland Bureau of Mines has administered an Abandoned Mine Reclamation Program which draws upon the Federal Abandoned Mine Reclamation Fund... Reclamation projects endeavor to eliminate sediment erosion and acid mine drainage by: stabilizing slopes via backfilling, regrading and revegetation; controlling and redirecting mine drainage; and disposing of mine waste. In addition, stream lining projects aim to remedy dewatering problems. The highest program priority, however, has been given to projects that correct abandoned mine problems constituting a hazard to people or property The Bureau of Mines in MDE is working on many AMD remediation projects in the Georges Creek watershed. During the year 2000, four projects are expected to be constructed 8 : - Mill Run Diversion Well - Oak Hill Landslide - AMD Treatment Project - Railroad Street Project - Coney Dry Cleaners AMD Remediation Project The Power Plant Siting Program in DNR has recently tested a new technology to seal mine shafts. Based on one year of monitoring, this new technique appears to be very successful. This Program is currently considering opportunities to apply this new technology in the Georges Creek watershed Mill Run Baseline Study 20 In 1995, a baseline study of chemical and biological conditions in Mill Run was completed. The study documented severe AMD in the Michaels Run tributary extending downstream in Mill Run to Georges Creek based on data collected in Once Mill Run waters mixed with Georges Creek, ph and acidity levels were moderated but levels of other constituents in the water column including iron and aluminum remained above the threshold for good water quality. The sources of the AMD in Michaels Run were from an abandoned deep mine opening and from seeps associated with old gob piles. Five AMD inputs were identified including four that were categorized major based on loading rate. Several monitoring stations exhibited ph levels averaging around 3. (Most aquatic life can not tolerate ph this low.) Impacts on aquatic life from AMD in the Mill Run watershed were apparent in the study s findings. A viable native brook trout population resides in the good quality waters above the AMD inputs. Below the AMD inputs, fish and macroinvertebrate life (benthos) was completely excluded. Map 13 Trout Habitat and Acid Mine Drainage incorporates findings from this study. Also see Mill Run Watershed Projects for information on recent mitigation efforts. 16
26 7. AMD Tracking In recent years, the MDE Bureau of Mines has had the most complete documentation of AMD discharges and seeps in the Georges Creek watershed. However, this information was collected at different times in different projects. Compilation of this information could be a valuable element in the Georges Creek watershed WRAS In addition, new information is being added to MDE s base information through recent special projects. On Mill Run 20 in 1995 and on Neff Run 4 in 1999, AMD entry points where documented. In the 2001 Georges Creek Stream Corridor Assessment, similar AMD documentation has been collected. All three of these efforts included estimates of severity as well as location. All the AMD information referenced here provides a foundation for drafting the Georges Creek WRAS. In addition, Allegany County may elect to incorporate a WRAS component on AMD that addresses compilation, cross-checking and map updating of AMD site and severity information for the Georges Creek watershed. A WRAS component on AMD could also incorporate tracking of mitigation projects and improved stream segments as a measure of WRAS progress. 17
27
28 Point Sources Discharges from discrete conveyances like pipes are called point sources. Point sources may contribute pollution to surface water or to groundwater. For example, waste water treatment discharges may contribute nutrients or Biological Oxygen Demand (BOD) that reduce oxygen available for aquatic life. Stormwater discharges may contribute excessive flow of water and/or seasonally high temperatures. Industrial point sources may contribute other forms of pollution. Some understanding of point sources discharges in a watershed targeted for restoration is useful in helping to prioritize potential restoration projects. According to the Maryland Department of the Environment (MDE) permit data base which is summarized in the MDE Permits Table and Map 19 MDE Permits, there are six permitted surface water discharges and no permitted groundwater discharges in the Georges Creek watershed. Not included in the table, but shown in the MDE Permits Map, are 30 general permits (mining related, etc.), three general industrial stormwater permits, and one surface water discharge permit in Garrett County that are listed in MDE s permit data base. Characteristics of the these permitted discharges (volume, temperature, pollutants, etc.) are tracked by MDE through the permit system. Most of this information is accessible to the public and can be obtained from MDE. NonPoint Sources Some of water quality indicators and the landscape indicators provide a generalized assessment of nonpoint source pollution in the Georges Creek watershed. A more detailed assessment of pollutants entering Georges Creek waterways from dispersed sources from the land and air was not immediately available. However, based on the immediately available information, several generalizations to be made. 1- Mining and acid mine drainage is the most widespread significant nonpoint source. 2- Extensive forest cover contributed to the relatively favorable indicators for nutrients. 3- Sedimentation is a significant nonpoint source issue in local stream segments. 5, 7 7, Urban stormwater is significant in a few stream segments such as the Frostburg drainage. 5- Failing septic systems could be an issue for consideration in the WRAS if Allegany County feels that the WRAS process would enhance existing programs. 19
29 MDE Permits in the Georges Creek Watershed Facility Name NPDES Permit / MD Code Discharge Type / MDE Permit Category Location Barton Mining Co. #SM MD DP3019 Surface Water / Industrial (surface mine) East of Route 36 Barton Mining Co. Moores Run MD DP3083 Surface Water / Industrial (surface mine) North of Moores Run Win-More Mining OPA No MD DP3287 Surface Water / Industrial (surface mine) Old Mid Lothian Road George s Creek WWTP MD DP2048 Surface Water / Municipal Old Reynolds Road, SW Lonaconing Reservoir MD DP1608 Surface Water / Municipal Also see Map 9 Protected Lands, Smart Growth and Reservoirs Mid Lothian Water Treatment Plant MD DP3074 Surface Water / Municipal Blan Avon Road, SW Note: August 2000 data. Combined sewer overflows (CSOs) are not shown because they do not have permits. 20
30
31 LAND USE Georges Creek Watershed Landscape Indicators Water quality, particularly in streams and rivers, is affected by the land in the riparian area and throughout the watershed. In an effort to gauge the affects of land use on water quality, and to allow comparison between watersheds, DNR has developed a series of Landscape Indicators. These indicators can be used to portray landscape conditions at a watershed scale that tend to support good water quality or that tend to degrade water quality. The Maryland Clean Water Action Plan published in 1998 listed landscape indicators for the Georges Creek watershed as summarized in the table below. 3 Most indicator ranking (pass / fail) is a relative measure that compares the Georges Creek watershed with the other 138 watersheds of similar size that covers the entire State of Maryland. Landscape Indicator (click name for details) Finding Rank Bench Mark Impervious Surface 3.7 % of watershed is impervious Pass Of 138 watersheds in Maryland, this one is among the 104 watersheds (75%) with the least impervious surface. Population Density 0.21 people per acre Pass Of 138 watersheds in Maryland, this one is among the 104 watersheds (75%) with the lower population density. Historic Wetland Loss Density Unforested Stream Buffer 2,042 acres Pass Of 138 watersheds in Maryland, this one is among the 104 watersheds (75%) with smaller historic losses. 27 percent Pass Of 138 watersheds in Maryland, this one is among the 104 watersheds (75%) having the smaller percentage of unforested stream buffer. Soil Erodibility 0.31 value per acre Fail Of 138 watersheds in Maryland, this one is among the highest 25%. (Soil erodibility is a natural condition, see note below.) 22
32 Interpreting Landscape Indicators Page 1 of 2 Impervious Surface. Reduction of impervious area can be a valuable component of a successful Watershed Restoration Action Strategy (WRAS). Roads, parking areas, roofs and other human constructions are collectively called impervious surface. Impervious surface blocks the natural movement of rain into the ground. Unlike many natural surfaces, impervious surface typically concentrates stormwater runoff, accelerates flow rates and directs stormwater to the nearest stream. Side-effects of impervious surfaces become increasingly significant as the percentage of impervious area increases. Examples include reduction of groundwater infiltration, soil and stream bank erosion, sedimentation, destabilization or loss of aquatic habitat, and flashy stream flows (reduced flow between storms and excessive flows associated with storms.) In the case of Georges Creek, the high percentage of imperviousness can be attributed to two very different land use types: 1) All areas identified as urban land uses, were assigned an average percentage of imperviousness to account for the typical amount of roofs, roads, etc. 2) All areas that were identified as bare ground associated with mining (in the other category on the Map) were also assigned an average percentage of imperviousness. Population Density. While population density may be beyond the scope of a WRAS, directing growth is a potential WRAS component. Humans are usually very successful in competing for use of land and water. As human population increases, effects of human activity tend to degrade, displace or eliminate natural habitat. Watersheds with higher populations, assuming other factors are equal, tend to exhibit greater impacts on waterways and habitat. However, growth can be directed in ways to reduce negative impacts. Historic Wetland Loss Density. About 4% of the Georges Creek watershed is hydric soil (about 2000 out of acres). The historic wetland loss estimate is based on the assumption that the hydric soils were all, at one time, wetlands. Thoughtful selective restoration of historic wetland areas can be an effective WRAS component. In most of Maryland s watersheds, extensive wetland areas have been converted to other uses by draining and filling. This conversion unavoidably reduces or eliminates the natural functions that wetlands provide. These functions include habitat and nursery areas for many aquatic organisms, buffering floods, uptake and redistribution of nutrients, etc. In general, watersheds exhibiting greater wetland loss tend to also exhibit greater loss of the beneficial functions that wetlands provide. Strategic replacement of wetlands can significantly improve natural function in local watershed areas. 23
33 Interpreting Landscape Indicators Page 2 of 2 Unforested Stream Buffers. The finding listed in the table means that 27% of the blue line streams (excluding shoreline) in the watershed do not have sufficient stream buffers to promote high quality stream habitat. DNR recommends that forested buffer 100 feet wide, i.e. natural vegetation 50 feet wide on either side of the stream, is typically necessary to promote high quality aquatic habitat and diverse aquatic populations. Restoration of natural vegetation adjacent to streams can be a valuable and relatively inexpensive WRAS element. In most of Maryland, trees are key to healthy natural streams. They provide numerous essential habitat functions: shade to keep water temperatures down in warm months, leaf litter food for aquatic organisms, roots to stabilize stream banks, vegetative cover for wildlife, etc. In general, reduction or loss of riparian trees / stream buffers degrades stream habitat while replacement of trees / natural buffers enhance stream habitat. Soil Erodibility. The soil erodibility indicator accounts for natural soil conditions but not for management of the land. A finding of 0.31 means that the Georges Creek watershed has high soil erodibility considering soils types, steep slopes and extent of cropland within 1000 feet of waterways. Watersheds with more easily erodible soils are naturally more susceptible to surface erosion, sedimentation, streambank erosion and other problems related to soil movement. These negative effects of soil erosion on water quality can be minimized through careful management. A WRAS can reasonably promote a reduction in disturbance of erodible soils and/or effective soil conservation practices planting stream buffers. The naturally erodible soils of the Georges Creek watershed are addressed by techniques called Best Management Practices (BMPs) to prevent soil loss that are typically in use on local farms. BMPs like no-till, reduced till, cover crops, field strips, and others significantly reduce erosion and sediment movement. These BMPs can be seen in use in many places in the watershed. 24
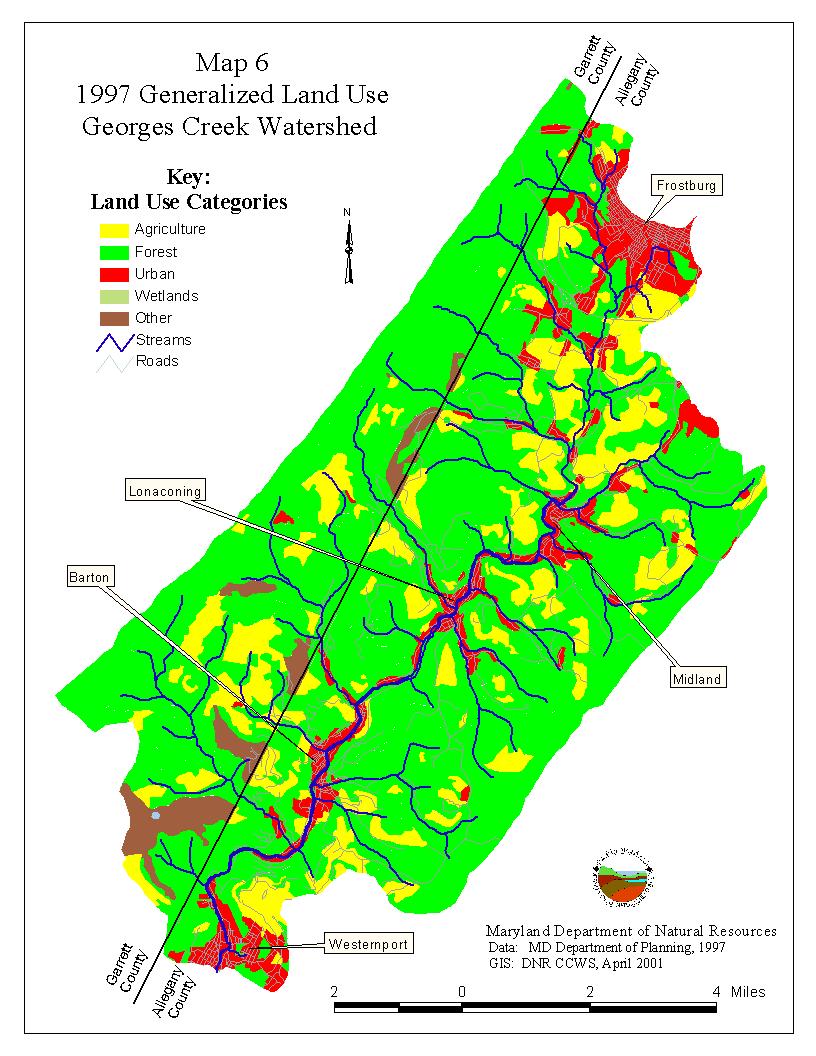
34 1997 Land Use The following table and pie charts summarize several major categories of land use for the Georges Creek Watershed using Maryland Department of Planning data. Viewing these categories of land uses as potential nonpoint sources of nutrients, agriculture and urban land lands may be significant nutrient sources. In addition, extractive land ( other category) may contribute significant sediment and/or acidity depending upon local conditions Land Use Georges Creek Watershed (Allegany) Agriculture (12.71%) Other (5.68%) Urban (13.71%) Forest (67.90%) Georges Creek Land Use 1997 Acres Category Description Allegany Co. Garrett Co. Agriculture field, Pasture, Ag buildings 4,062 1,796 Forest All woodlands and brush 21,699 12,370 Urban All developed areas 4, Other Extractive and bare ground 1,814 1,445 County Totals 31,957 15,729 Watershed Total 47, Land Use Georges Creek Watershed (Garrett) Agriculture (11.42%) Other (9.19%) Urban (0.75%) Map 6 Land Use shows the distribution of watershed land uses for the watershed using the same data as the table and pie charts. Note: A portion of the agricultural lands are reclaimed surface mines and may not have the same characteristics as agricultural lands that were not mined. 17 Forest (78.64%) 25
35 Land Use Projection to 2020 The Maryland Department of Planning is projecting planning estimates for population and related factors like land use to the year Based on work completed as of December 2000, the 2020 land use estimates are shown pie chart and table below. 23 For the Allegany County portion of Georges Creek (the WRAS area), urban land uses are projected to increase by about 1% by the year The majority of land projected for conversion to urban use is anticipated to be forest. A small percent decrease is projected for agricultural land. The projected increase in urban land 2020 Projected Land Use Georges Creek Watershed (Allegany) Agriculture (12.56%) Other (5.67%) Urban (14.77%) Forest (67.00%) is anticipated to concentrate around Frostburg and Westernport. However, at least some small increase in urban land area is projected for each subwatershed in the Georges Creek watershed. The increase in impervious area for the WRAS watershed from 1997 to 2020 is projected to be from 4.7% to 4.9% respectively. Georges Creek Land Use Change 1997 to 2020 Category Description Projected Change in Acres Agriculture Field, Pasture, Ag buildings -47 Forest All woodlands and brush -291 Urban All developed areas 338 Other Extractive and bare ground no change 26
36
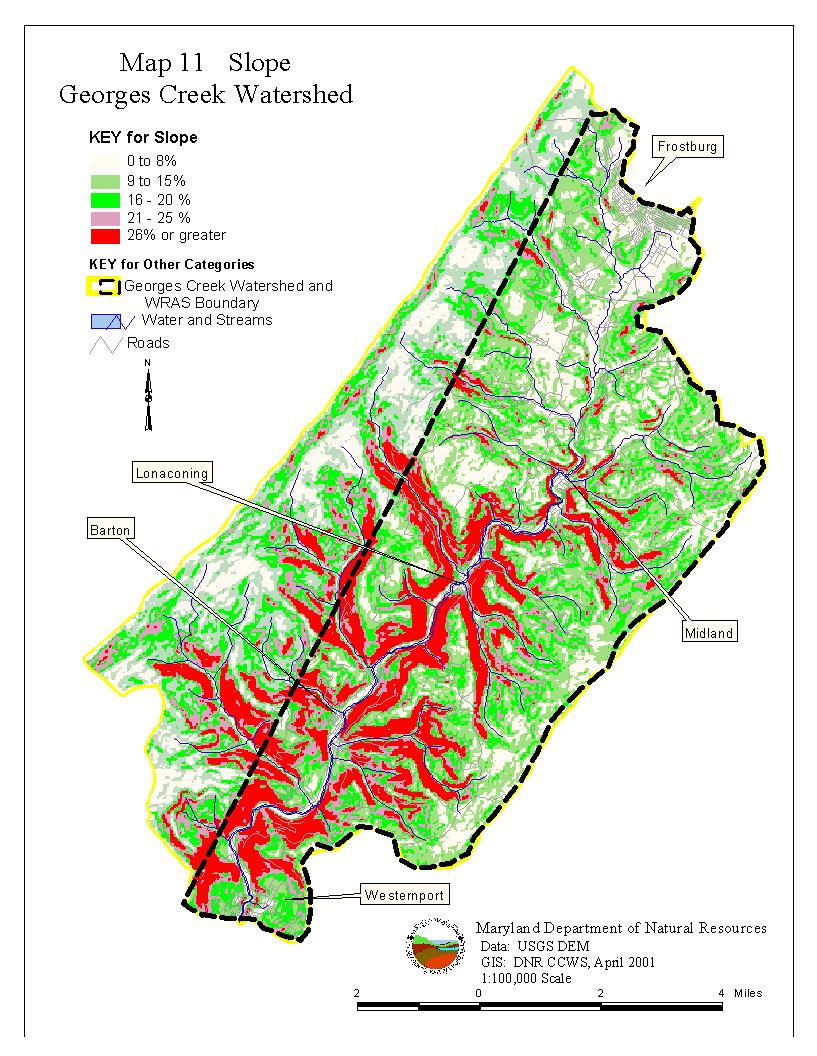
37 Floodplain Management and Watershed Restoration Opportunities In the Georges Creek watershed, steep topography is an important factor in determining potential land use and watershed restoration opportunities. Steep slopes are significant morphological features of local streams. Extensive steep areas in the watershed have also contributed to a concentration of development in valleys in close proximity to streams and in floodplains. Existing development in floodplains is common in the watershed as can be seen by comparing Map Land Use and Map 19 Wetlands Restoration Opportunities, which shows floodplains. Distribution of steep slopes is shown in Map 11 Slope. Control of flood waters and repair of flood damage is an important issue for anyone who uses roads in these areas or owns property in this locality. Consequently, flood mitigation programs are well established in the watershed. For example, the 1999 Allegany County Flood Mitigation Plan identifies flood mitigation needs and lists project priorities. 18 Projects under flood-related programs can provide opportunities to integrate watershed restoration, water quality improvement and natural resource enhancement objectives through careful project design and by integrating additional funding sources. Allegany County is already demonstrating that watershed restoration and flood management objectives can be effectively and efficiently integrated. Several County projects using this approach with multiple funding sources are summarized in the Related Projects section of the Characterization. 28

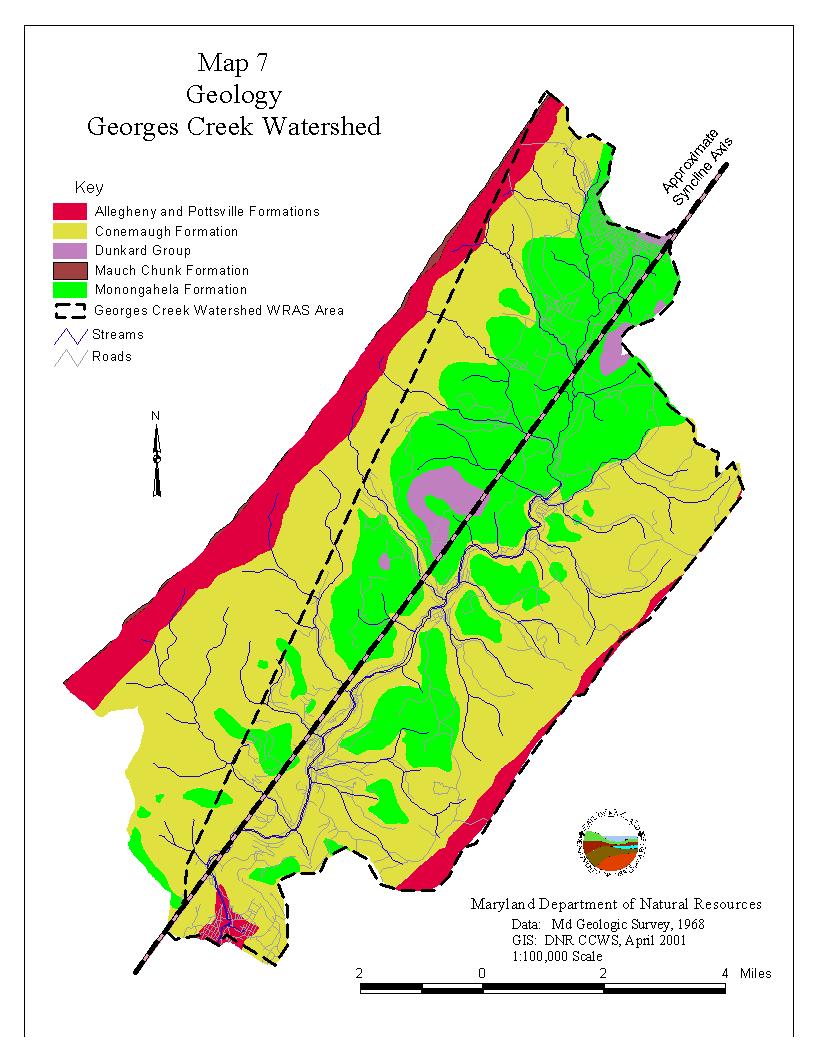
38 Geology In the Georges Creek watershed, geology has strong influence on water movement and quality in the area. The steep terrain, stony soils and hydrologic pattern of the streams are closely tied to local geology. The coal mining in the watershed, which is possible only due to the geology of the area, also contributes to local water quality conditions via layers of rock and crevices that underlie the watershed. The geologic structure known as the Georges Creek Syncline largely defines the local watershed. In general, a syncline is a fold of stratified rock inclining upward on either side of an axis (centerline). Locally, the Georges Creek Syncline includes the folded the rock strata that was pushed up to form Savage Mountain and Dans Mountain on either side of the Georges Creek valley. As a result of this geology, Georges Creek is located near the middle of the valley which is closely aligned with the axis of the syncline. An addition view of local geology is presented in Map 7 Geology. It shows a pattern that indicates its importance to the character of the Georges Creek watershed. The east and west watershed boundaries on the mountains tend to coincide with the Allegany and Pottsville Formations. Therefore, the surface water and groundwater generally flow from areas of the Allegany and Pottsville Formations into and through areas of the Monongahela Formation and the Conemaugh Formation on their way to the Potomac River. 29
39
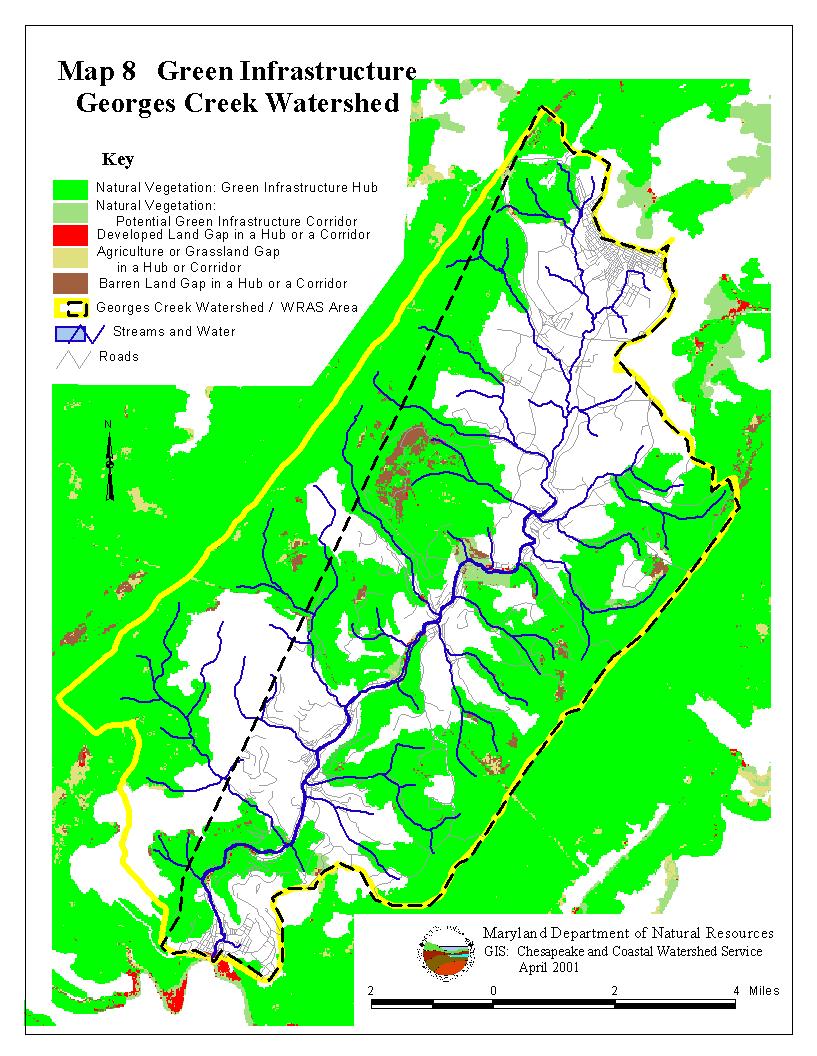
40 Green Infrastructure An additional way to interpret land use / land cover information is to identify Green Infrastructure. In the GIS application developed by Maryland DNR and its partners, Green Infrastructure refers to areas of natural vegetation and habitat that have statewide or regional importance as defined by criteria developed by DNR. The criteria for identifying of lands as Green Infrastructure is limited to considering natural resource attributes currently found on those lands. One example of the criteria is that interior forest and wetlands complexes at least 250 acres in size are considered as part of Green Infrastructure. As a second example, sensitive species habitat that is located within areas of natural vegetation at least 100 acres in size is also counted as Green Infrastructure. Other potential attributes of Green Infrastructure lands, such as ownership or if the current natural conditions are protected in some way, are not criteria for Green Infrastructure but they may be considered independently. Within the Green Infrastructure network, large blocks of natural areas are called hubs, and the existing or potential connections between them, called links or corridors. Together the hubs and corridors form the Green Infrastructure network which can be considered the backbone of the region s natural environment. 6 Map 8 Green Infrastructure shows these lands for Georges Creek. Protection of Green Infrastructure lands may be addressed through various existing programs including Rural Legacy, Program Open Space, conservation easements and others. The 2001 Maryland General Assembly approved $35 million for the Green Print program which is targeted primarily to protecting Green Infrastructure areas. This new funding category will be administered by Program Open Space. The Green Infrastructure in the Georges Creek watershed exhibits several significant characteristics: 1- A large portion of the Georges Creek watershed, particularly on slopes around the perimeter of the watershed are considered Green Infrastructure Hubs. These large blocks of natural habitat have regional or Statewide importance. 2- Compared to other portions of the Maryland these natural areas have relatively low risk of conversion to urban use. However, their management, including the potential for natural resource commodity production (timber, coal) will determine their long term viability as a component of the Green Infrastructure network. 3- Additional analysis of Green Infrastructure in the Georges Creek watershed is appropriate to adequately characterize its status. 31
41
42 Protected Lands As used in the context of watershed restoration, protected land includes any land with some form of long term limitation on conversion to urban / developed land use. This protection may be in the forms: public ownership for natural resource or recreational intent, private ownership were a third party acquired development rights or otherwise acquired the right to limit use through the purchase of an easement, etc. The extent of protection varies greatly from one circumstance to the next and it may be necessary to explore the details of land protection parcel by parcel through the local land records office. For purposes of watershed restoration, a knowledge of existing protected lands can provide a starting point in prioritizing potential restoration activities. In some cases, protected lands may provide opportunities for restoration projects because owners of these lands may value natural resource protection or enhancement goals. The following table and Map 9 Protected Land, Smart Growth and Reservoirs summarize the status of protected lands and reservoir protection in the Georges Creek Watershed. There are three reservoirs for drinking water in the Georges Creek watershed. All three are partially protected by their headwaters location, local zoning and DNR owned land in part of their watersheds. Allegany County Zoning Maps show these reservoir watersheds as Conservation Areas which provides some protection through the County Permit process. However, none of these reservoirs watersheds are completely protected which makes their long term viability a potential issue for the WRAS. Most land in the watershed has no particular limitation on use other than local zoning and applicable permitting requirements. Local / County parks tend to be small parcels geared to local recreational interests in towns. DNR land is the largest block of protected land in the watershed. It is primarily on steep land or ridge tops. While much of this land is covered by natural vegetation, management for timber production is not uncommon. No easements for conservation or agricultural protection have been identified in the watershed. Smart Growth In Maryland s Smart Growth program, there are two targeting programs that should be considered as potential watershed restoration projects are prioritized. In Rural Legacy Areas, protection of land from future development through purchase of easements (or in fee simple) is promoted. In Primary Funding Areas, State funding for infrastructure may be available to support development and redevelopment. See Map 9 Protected Land, Smart Growth and Reservoirs: - Rural Legacy Areas: There are no Rural Legacy Areas in the Georges Creek watershed. - Priority Funding Areas in the Georges Creek watershed cover less then 10% of the watershed. 33
43
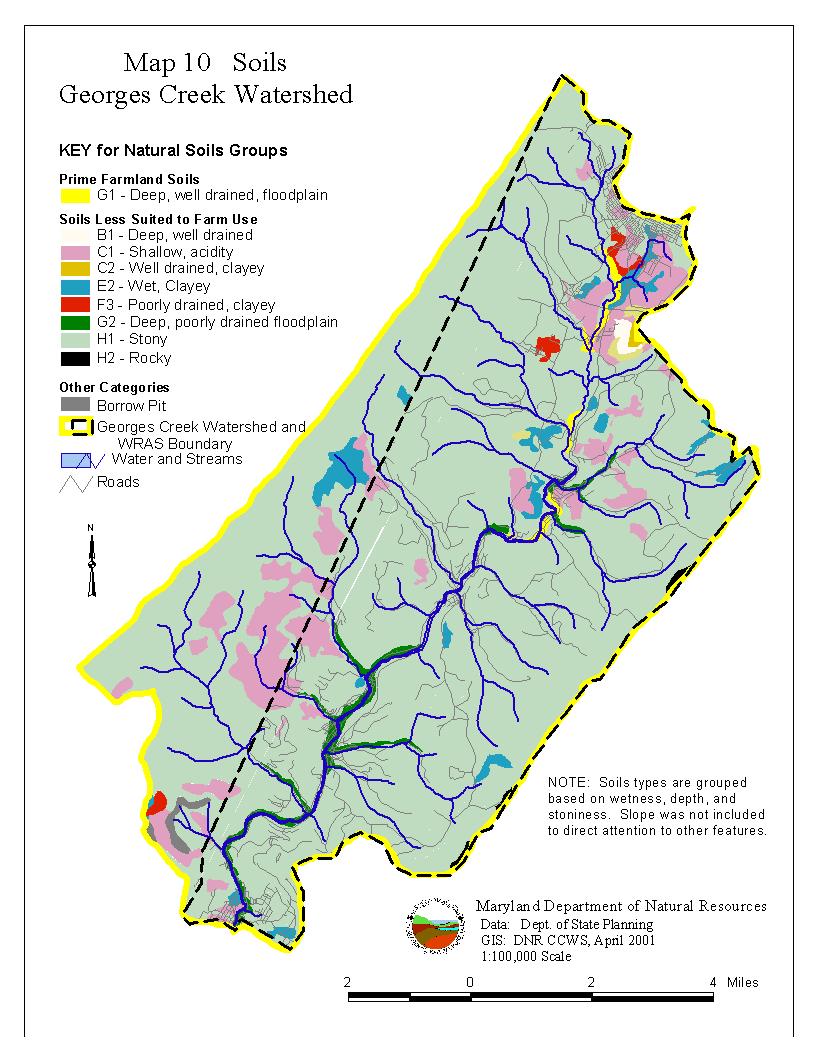
44 Soils and Slope 1. Interpreting Local Conditions with Natural Soil Groups Soil conditions, like soil type and moisture conditions, greatly affect how land may be used and the potential for vegetation and habitat on the land. Soil conditions also contribute to water quality in streams, rivers and groundwater. Local soil conditions vary greatly from site to site as published information in the Soil Survey for Allegany County shows. This complicated information can be effectively summarized using Natural Soil Groups to help identify useful generalizations about groups of soils. In Map 10 Soils by Natural Soil Group and the Natural Soil Groups pie chart, most soils in the watershed have limitations like stoniness, shallow depth or wetness. Stony Soils Grouped by Slope Georges Creek Watershed, both Counties (77.00%) Slopes greater than 15% (9.22%) (13.78%) Natural Soil Groups Georges Creek Watershed, both Counties (3.81%) (85.62%) H1 Soils (8.23%) (2.34%) soil categorized as H1 covers nearly 86% of the Georges Creek watershed. C1 and E2 soils account for 8.23% and 2.34% respectively. All other soils types together account for 3.81% of the watershed including the only prime agricultural soil in the watershed which is G1. Slope is a very important factor in determining soil type and potential land use in the watershed. Elevation varies about 2100 feet from 900 feet above sea level at the mouth of Georges Creek to 2,991 feet above sea level at High Rock on Big Savage Mountain. 19 About 77% of the watershed has 15% or greater slope as shown in the second pie chart which groups the natural soils groups from above by slope. About 9% of the watershed has less than 8% slope and nearly 14% of the watershed has slope between 8% and 15%. A second view of slope in Map 11 Slope is generated from digital elevation model (DEM) information. The map shows the concentration of very steep slopes along lower Georges Creek This generalized slope information appears to be the best available for the Georges Creek watershed. However, more detailed slope information is commonly generated for development projects on a site by site basis. 35
45 2. Soils and Watershed Planning Local soil conditions can be a useful element in watershed planning and for targeting restoration projects. Soils with limitations related to wetness or slope naturally limit active use for farming or development. Land owners in the watershed have tended leave many of these areas in natural vegetation or other low intensity use. By comparing Map 10 Soils by Natural Group with two preceding maps, Map General Land Use and Map 8 Green Infrastructure, it is apparent that marginal soils and current areas of natural habitat tend to coincide. Natural Soils Groups or similar soils assessment techniques can be used to help identify potential areas for restoration projects or habitat protection. Once areas of interest are targeted and land owner interest is verified, additional detailed soil assessment is an essential step in identifying viable restoration project sites. 36
46
47
48 Wetlands In the context of the Watershed Restoration Action Strategy (WRAS), wetlands serve valuable water quality and habitat functions that may not served by other land uses. Therefore, protection and enhancement of existing wetlands, and restoration of past wetland areas, can be a valuable element in the WRAS. (Also see Wetland Restoration.) 1. Introduction to Wetland Categories 16 Compared with other regions of Maryland, wetlands are uncommon in Western Maryland, including Georges Creek as indicated in Map 12 Wetlands. In this area, wetlands are often found in topographic depressions and associated with riverine and palustrine environments. The map also indicates that in the Georges Creek watershed, three types of wetlands are most common though wetlands in Western Maryland generally are more diverse. In general, wetlands in the Georges Creek watershed can be briefly characterized (from Wetlands of Maryland, Tiner and Burke, 1995): - Forested wetlands are typically found on floodplains in stream valleys and are characterized by the frequency and duration of flooding (seasonally flooded and temporarily flooded forested wetlands). - Scrub-shrub are wet thickets and shrub bogs found in river floodplains, valleys and meadows. - Emergent wetlands are seasonally-flooded wet meadows and marshes. They can occur in areas of former forested wetlands that were cleared for agricultural, meadows and valleys and are also characterized by the frequency and duration of flooding (seasonally flooded marshes and meadows, and temporarily flooded wet meadows). 2. Tracking Wetlands 16 Oversight of activities affecting wetlands involves several regulatory jurisdictions. The Maryland Dept. of the Environment (MDE) is the lead agency for the State. MDE cooperates with DNR, the Army Corps of Engineers and other Federal and local agencies. As part of its responsibility, MDE tracks State permitting and the net gain or loss of wetlands over time. As the Wetlands Regulatory Status table shows, changes tracked in the State regulatory program have resulted in a small net loss of wetland acreage in the Georges Creek watershed. Tracking Nontidal Wetland Change Georges Creek Watershed Permits Authorized = 6 Letters of Authorization Issued = 17 Wetland Class Acres Permanent Impacts Mitigation by Permittee 0 Other Gains (Regulatory) 0 Programmatic Gains 0 Net Gain/Loss Note: Regulatory tracking for authorized nontidal wetland losses began in Comprehensive tracking of voluntary wetland gains began in
49 3. Interpreting Wetland Distribution Wetlands in the Georges Creek watershed are found in very limited areas as shown in Map 12 Wetlands. In comparing this map to Map Generalized Land Use, it can be seen that many of these small wetland areas do not appear on the land use map. One interpretation may be that some of these wetlands are too small to be identified using aerial image interpretation which is the basis for the land use data. For the larger wetland areas along Georges Creek on the Wetlands Map that could be interpreted be remote imaging, additional comparison of the two maps shows that these large wetlands are depicted as forest on the land use map. An additional interpretation of this Wetland Acreage Summary Georges Creek Watershed 16 Wetland Class Acres Estuarine, Intertidal (E2) aquatic bed 0 beach bar 0 emergent 0 forested 0 scrub shrub 0 Palustrine (P) aquatic bed 0 emergent 111 flat 0 forested 329 scrub shrub 7 Riverine, Lower Perennial (R2) beach bar 0 Riverine, Upper Perennial (R3) beach bar 0 Total Wetlands (National Wetlands Inventory) 447 difference is simply the result of two differing views of the landscape. For example, wooded nontidal wetlands can be viewed as wetlands from a habitat / regulatory perspective and they can be viewed as forest from a land use perspective. In the Georges Creek watershed, differing perspectives on counting wetlands may be significant for watershed management. From a land use perspective, the Georges Creek watershed s wetlands were not identified by the Maryland Department of Planning. From a habitat / regulatory perspective, there are approximately 447 acres of wetlands in the watershed. In the context of the Watershed Restoration Action Strategy (WRAS), wetlands serve valuable water quality and habitat functions that may not be provided by other land uses. Therefore, protection and enhancement of existing wetlands, and restoration of past wetland areas, can be a valuable element in the WRAS. (Also see Wetland Restoration.) 40
50
51 LIVING RESOURCES AND HABITAT Overview Living resources, including all the animals, plants and other organisms that call the land and waters of the Georges Creek watershed home, are being affected by human activity. The information summarized in this characterization suggest some of the significant stresses in the watershed are manipulation of habitat, excessive acidity or sediment and excessive availability of nutrients. The Living Resource information summarized here should be considered a partial representation because numerous areas of potential interest or concern could not be included due to lack of information, time, etc. For example, information on many forms of aquatic life, woodland communities, terrestrial habitats, etc. should be considered as watershed restoration decisions are being made. Therefore, it is recommended that stakeholders in the watershed identify important living resource issues or priorities so that additional effort can be focus where it is most needed. New information should be added or referenced as it becomes available. 42
52 Living Resource Indicators Aquatic organisms are sensitive, in varying degrees, to changes in water quality and the habitat associated with water. This association offers to perspectives that are important for watershed restoration. First, improvements for living resources offer potential goals, objectives and opportunities to gauge progress in watershed restoration. Second, selected living resources can be used as to gauge local conditions for water quality, habitat, etc. This second perspective is the basis for using living resources as an indicator. The Maryland Clean Water Action Plan published in 1998 listed the following living resource indicators for the Georges Creek watershed. 3 Living Resource Indicator (click on name for details) Non-Tidal Benthic Index of Biotic Integrity Non-Tidal Fish Index of Biotic Integrity Non-Tidal In-stream Habitat Index Score Rank Bench Mark (percent based on 138 watersheds) 3.67 Fail Scale of 1 (worst) to 10 (best) Score less than 6 yields a rank of fail 3.33 Fail Score less than 6 yields a rank of fail and the watershed is designated as a Category 1 watershed in need of restoration. Score greater than or equal to 8 for yields a designation as a Category 3 watershed in need of protection Pass Scale of 1 (worst) to 10 (best) Of 138 watersheds in Maryland, the 34 (25%) with the lowest nontidal in-stream habitat index received a rank of fail and were designated as Category 1 watersheds in need of restoration. The top 34 (25%) were designated as Category 3 watersheds in need of protection. 43
53 Interpreting Living Resource Indicators General. Several of these indices rely on index rankings generated from a limited number of sampling sites which were then generalized to represent entire watersheds. Considering this limitation on field data, it may be beneficial to conduct additional assessments to provide a more complete understanding of local conditions as part of the WRAS. Non-Tidal Benthic Index of Biotic Integrity. An index less than 6 indicates that benthic organisms are significantly stressed by local conditions. This index allows comparison of streams based on the populations of bottom-dwelling bugs (benthic macroinvertebrate organisms) found in the stream. For coastal plain streams, this index employs seven measurements of these populations which is translated into a rank for each sampling site. Non-Tidal Fish Index of Biotic Integrity. In index less than 6 indicates that improvements would be beneficial to fish populations. This index allows comparison of selected streams (first through third order nontidal streams) based fish community health. In each sampling site where fish are surveyed, the makeup of the overall fish population is measured in nine distinct ways such as the number of native species, number of benthic fish species, percent of individuals that are tolerant species, etc. These nine scores are then integrated to generate an index ranking for the survey site. Non-Tidal In-Stream Habitat Index. This index allows comparison of streams based fish and benthic habitat as measured by in-stream and riparian conditions. For each stream site that was assessed, visual field observations are used to score the site for substrate type, habitat features, bank conditions, riparian vegetation width, remoteness, aesthetic value, etc. These scores are then integrated to generate a single rank for each stream site. 44
54 Benthic Macroinvertebrates In 1996, bugs living in streams (benthic macroinvertebrates or benthos), fish and their physical habitat were assessed at nine sites in the Georges Creek watershed as shown in Map 3 Monitoring Stations. This data was gathered by the Maryland Biological Stream Survey (MBSS) which is a program in DNR. As summarized in the table below, scores for both benthic populations and fish populations for the sites surveyed were consistently poor and very poor. However, the physical habitat conditions at those same sites ranged from good to very poor. The Georges Creek site that exhibited poor aquatic populations in good physical habitat suggests that water quality is a limiting factor there. In the Georges Creek watershed, the MBSS is scheduled to collect additional data on instream aquatic community and habitat conditions at 10 sites in the year Findings from the 1996 MBSS in the Georges Creek Watershed Station # AL-A-... Stream Location Fish Benthos Physical Habitat Score Condition Score Condition Score Condition Sand Spring Run Very Poor 8.15 Very Poor Sand Spring Run 1.86 Very Poor 1.89 Very Poor Fair Staub Run 1.0 Very Poor 1.89 Very Poor Poor Georges Creek near Moores Run Georges Creek above Mill Run Georges Creek below Mill Run Georges Creek below Mill Run Index Used In 1996 MBSS Fish Index of Biotic Integrity Benthic Index Biotic Integrity Physical Habitat Index 1.0 Very Poor 2.33 Poor Poor 2.14 Poor 1.67 Very Poor Poor 1.29 Very Poor 1.67 Very Poor 30.9 Poor 2.14 Poor 2.56 Poor Good Description Ranges from 1.0 (worst) to 5.0 (best) Ranges from 1.0 (worst) to 5.0 (best) Range from 0 (worst) to 100 (best) 45
55 Why Look at Benthos in Streams? Benthos are sometimes called stream bugs though that name overly simplifies the diverse membership of this group. Unimpaired natural streams may support a great diversity of species ranging from bacteria and algae to invertebrates like crayfish and insects to fish, reptiles and mammals. Benthic macro-invertebrates, collectively called benthos, are an important component of a stream s ecosystem. This group includes mayflies, caddisflies, crayfish, etc. that inhabit the stream bottom, its sediments, organic debris and live on plant life (macrophytes) within the stream. The food web in streams relies significantly on benthos. Benthos are often the most abundant source of food for fish and other small animals. Many benthic macroinvertebrates live on decomposing leaves and other organic materials in the stream. By this activity, these organisms are significant processors of organic materials in the stream. Benthos often provide the primary means that nutrients from organic debris are transformed to other biologically usable forms. These nutrients become available again and are transported downstream where other organisms use them. Benthos are a valuable tool for stream evaluation. This group of species has been extensively evaluated for use in water quality assessment, in evaluating biological conditions of streams and in gauging influences on streams by surrounding lands. Benthos serve as good indicators of water resource integrity because they are fairly sedentary in nature and their diversity offers numerous ways to interpret conditions. They have different sensitivities to changing conditions. They have a wide range of functions in the stream. They use different life cycle strategies for survival. 46
56 Fish During 1999, sampling was conducted in 16 stream segments within the Georges Creek watershed. Fish species and habitat conditions found there were detailed in an April 2000 report. 7 Based on information collected in recent years, the Fishery Conditions Table summarizes selected fish population conditions by stream segment starting at the Potomac River going upstream on the west side of Georges Creek and continuing downstream on the east side of Georges Creek. 11 Fish populations in the Georges Creek watershed vary significantly depending on local conditions in each stream segment. While there are numerous reasons for these differences, the presence and severity of acid mine drainage is a locally important factor. For example, Map 13 Trout Habitat and Acid Mine Drainage shows that stream segments supporting naturally reproducing populations of brook trout do not occur in areas of severe acid mine drainage (AMD). However, individual trout move from high quality habitat into and through areas of moderate AMD impacts. 20 Currently, the mainstem of Georges Creek from Westernport to Midland is a popular Put & Take recreational trout fishery is stocked by DNR Fisheries Service. Additionally, a portion of Laurel Run is also stocked with trout but it is designated as Special Use because fishing is limited to participants under 16 years of age Mill Run Trout Recolonization In Mill Run, trout recolonized portions of the stream following artificial addition of fine particle limestone to counteract acid mine drainage (AMD). 24 The fish survey conducted in June 1999 found that fish species present before and after the AMD mitigation project had not changed. However, the brook trout population had increased in size in upstream waters unaffected by AMD. The DNR Fisheries Service did not speculate on the cause of the increase. Additionally, significant numbers of brook trout and blacknose dace had moved into Mill Run areas where water quality had improved. This AMD mitigation project successfully counteracted the low-ph symptom of acid mine drainage but it did not eliminate the cause. Even so, it demonstrates the potential to expand the habitat range of desirable fish species here and elsewhere in the watershed. This experience suggests that, in selected streams, either an effort to reduce acid mine drainage and/or an ongoing program to raise ph can make measurable improvements to the fishery. 47
57 Fishery Conditions in the Georges Creek Watershed 7,11 Stream / Location Fisheries Condition AMD = Acid Mine Drainage West Side Tributaries Georges Creek mainstem near Westernport Mill Run Michaels Run Old survey found at least 15 species including young-of-year and adult Brown Trout. About 6,000 trout (mostly rainbow trout) were stocked in Georges Creek in Wild trout above Michaels Run. AMD from Michaels Run to Georges Ck. No trout (tributary to Mill Run) Butcher Run Laurel Run Koontz Run Woodland Creek Staub Run Winbrenner Run Sandy Spring Run 2 fish species collected in Stream volume appears to be limiting. Wild trout in headwaters. 3 fish species also collected in trout stocked in Viable population of brook trout found in addition fish species also found survey found low numbers of wild Brook Trout. no data no data No wild trout based on 1997 sampling. One species of fish collected in High sediment load and low water volume limits fishery potential. Below Midlothian Road stream is intermittent. East Side Tributaries Neff Run Matthews Run Elklick Run Wild Brook Trout population upstream of Matthews Run. 2 additional fish species were collected there. The lower stream reach does not have trout but 4 additional fish species were collected. Wild Brook Trout population in upper stream segments. Two additional fish species collected. Severe AMD in lower 1,000 feet stream segment. Viable brook trout population found Several additional fish species were also collected. Hill Run Jackson Run Moores Run Population of blacknose dace found in No data prior to highly unlikely for Brook Trout. no data 3 fish species collected in High silt load from mining road. Highest embeddedness of any stream sampled. No data prior to
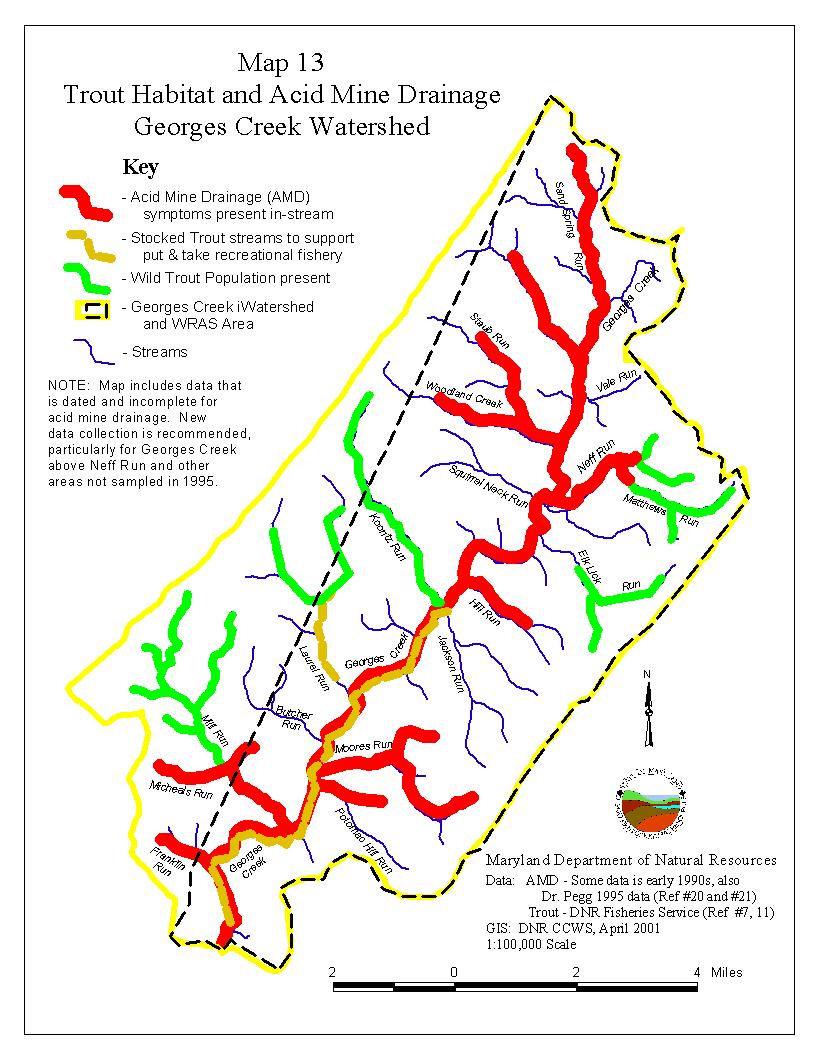
58
59 Sensitive Species Sensitive species are most widely known in the form of Federally listed Endangered or Threatened animals such as the bald eagle. In addition to these charismatic rare animals, both US EPA and Maryland DNR work through their respective Federal and State programs to protect numerous endangered, threatened, or rare species of plants, animals and ecological communities of those species. Map 14 Sensitive Species generally shows areas important to these species. For the purposes of watershed restoration, it is valuable to account for known locations of habitat for these species. These places are often indicators, and sometimes important constituents, of the network of natural areas or green infrastructure that are the foundation for many essential natural watershed processes. Protecting these species and/or promoting expansion of their habitats can be an effective foundation for a watershed restoration program. 1. Habitat Protection Categories One way to characterize a watershed for sensitive species is to identify known habitat locations using several broad categories employed by DNR s Wildlife and Heritage Division. The following table and map summarize this information. Based on this general information, more detailed information and guidance can be requested from Division staff. The three categories listed below (SSPRA, NHA, WSSC) are considered during review of applications for a State permit or approval or involve State funds. For projects potentially affecting these areas, the State permit or approval will include recommendations and/or requirements to protect sensitive species and their habitat. In addition, many counties have incorporated safeguards for these areas into their permit review process. For purposes of project review, all NHAs and WSSCs have SSPRAs that encompass them. These categories do not place requirements on any activities that do not require a permit or approval or involve State funds. However, property owners are encouraged to seek advice on protecting the sensitive species / habitat within their ownership. 2. Rare Fish and Mussels DNR recently initiated a project to rank watersheds across Maryland to aid in targeting conservation and restoration efforts to benefit known populations of rare fish and mussels. In comparison to the more than 1000 small (12-digit) watersheds identified by DNR in the Maryland, all eight 12-digit sub-watersheds in Georges Creek received a rank of neutral. A ranking of neutral indicates that information is insufficient (not absence of these species or low priority.) In neutral ranked areas, it is reasonable to rely on other available criteria for targeting watershed conservation and restoration projects. This ranking considers information from 1970 to 1997 only for rare species of fish or mussels being tracked in Maryland. Four possible ranks were used for this project: Very High, High, Moderately High and Neutral. Each rare species being tracked contributed to this ranking based on two types of criteria: 1) presence or absence, and 2) if present, weighting relative rarity on worldwide and Statewide scales. 50
60 Maryland s Sensitive Species Protection Categories Sensitive Species Project Review Area (SSPRA) There is one SSPRA in the Georges Creek WRAS area as shown in Map 14 Sensitive Species Areas. Each SSPRA contains one or more sensitive species habitats. However, the entire SSPRA is not considered sensitive habitat. The SSPRA is an envelope identified for review purposes to help ensure that applications for permit or approval in or near sensitive areas receive adequate attention and safeguards for the sensitive species / habitat they contain. In general, SSPRAs are delineated so that they compass all NHAs and WSSCs. Natural Heritage Area (NHA) No NHAs are located in the Georges Creek WRAS area. NHAs designated in State regulation. NHAs are rare ecological communities that encompass sensitive species habitat. They are designated in State regulation COMAR For any proposed project that requires a State permit or approval that may affect an NHA, recommendations and/or requirements are placed in the permit or approval that are specifically aimed at protecting the NHA. Wetlands of Special State Concern (WSSC) There are no WSSCs in the Georges Creek WRAS area. In general, these wetlands are associated with one or more sensitive species habitats that are in or near the wetland. For any proposed project that requires a wetland permit, these selected wetlands have additional regulatory requirements beyond the permitting requirements that apply to wetlands generally. For a listing of designated sites see COMAR at 51
61
62 Stream Corridor Assessment RESTORATION TARGETING TOOLS Allegany County, with assistance from DNR, already has experience in using stream corridor assessment information from the 1999 Neff Run stream corridor assessment. Using the Stream Corridor Assessment Methodology (SCAM) developed and applied by the DNR Watershed Restoration Division, on-the-ground issues were assessed and cataloged to assist in targeting restoration activities. (See Neff Run Watershed Integrated Approach to Restoration.) In partnership with Allegany County and in follow-up to the Neff Run assessment, DNR completed a stream corridor assessment in the remaining areas of the Georges Creek watershed during winter 2000/2001. Trained teams from the Maryland Conservation Corps. walked along streams to identify and document potential problems and restoration opportunities such as inadequate stream buffers, erosion, etc. Similar to the 1999 Neff Run products, a report will be generated, including maps and photographs, to support targeting decisions for restoration projects. Draft data summaries are expected to be available in Summer 2001 with a final report by December The data from this assessment will provide an important companion report for this watershed characterization and will be used in development of the Watershed Restoration Action Strategy. Fish Blockages Information on the number and extent of blockages to fish movement is generally limited to the Neff Run watershed. There, the 1999 Stream Corridor Assessment identified 24 blockages. While the DNR Fish Passage program maintains a Statewide database of blockages to fish movement, it generally does not have data for Western Maryland. Therefore, extending use of the Stream Corridor Assessment to additional portions of the Georges Creek watershed is essential to cataloging blockages and prioritizing potential removal. 53
63 Stream Buffer Restoration For the Neff Run tributary to Georges Creek, stream segments needing stream buffer enhancement have already been identified 4 and next-step recommendations (land owner contact, cost-share promotion, site assessment/recommendations) are already in place. 5 The Georges Creek stream corridor assessment conducted during the winter of 2000/2001 also identifies numerous stream buffer restoration opportunities. With this information, Allegany County may select from among numerous approaches to prioritizing these opportunities for further investigation and project development. This section presents several scenarios for stream buffer restoration prioritization based on GIS data. The concepts presented in these scenarios are recommended to help in prioritizing projects for maximizing water quality improvement and habitat enhancement. 1. Benefits and General Recommendations Natural vegetation in stream riparian zones act as stream buffers that can provide numerous valuable environmental benefits: Reducing surface runoff Preventing erosion and sediment movement Using nutrients for vegetative growth and moderating nutrient entry into the stream Moderating temperature, particularly reducing warm season water temperature Providing organic material (decomposing leaves) that are the foundation of natural food webs in stream systems Providing overhead and in-stream cover and habitat Promoting high quality aquatic habitat and diverse populations of aquatic species. To realize these environmental benefits, DNR generally recommends that forested stream buffers be at least 100 feet wide, i.e. natural vegetation 50 feet wide on either side of the stream. Therefore, DNR is promoting this type of stream buffer for local jurisdictions and land owners who are willing to go beyond the minimum buffers standards. The DNR Watershed Restoration Division and other programs like CREP are available to assist land owners who volunteer to explore these opportunities. 54
64 2. Using GIS In additional to the Stream Corridor Assessment information, other factors can be considered that help to prioritize areas for stream buffer restoration. Even with a list of potential restoration sites, it is often important to prioritize opportunities to maximize benefits generated by projects relative to investment of limited human and funding resources. For example, stream buffer restoration opportunities can be considered in the context of land use, wetlands, hydric soils, green infrastructure, land ownership, etc. to assist in prioritizing potential projects achieve multiple benefits. Multiple benefits within a project area could include but are not limited to: habitat improvement, nutrient transport reduction, green infrastructure enhancement, recreational enhancement, buffering sensitive species habitat, etc. Prioritizing areas that have inadequate stream buffers for restoration can be timeconsuming and expensive. Fortunately, use of a computerized Geographic Information System (GIS) to manipulate remote sensing data (and survey data) can help save limited time and funds. To assist in this technical endeavor, DNR Watershed Management and Analysis Division has developed GIS-based tools to assist in the buffer restoration targeting process. Using these tools, selected GIS scenario maps have been generated to supplement the Stream Corridor Assessment. Several scenarios are presented here to help consider prioritizing potential areas for stream buffer restoration. They demonstrate methods that can be used to locate sites having a high probability of optimizing certain ecological benefits. These scenarios are based on remote sensing data, so follow-up is essential to integrate Allegany County s information from the Neff Run and Georges Creek Stream Corridor Assessments. Additionally, sites eventually identified as high priority will also require more intensive investigation. The resolution of the data used to generate these maps is not sufficient for an accurate site assessment, but can be used to identify potential candidate sites for detailed investigation. The streams presented in the maps are blue line streams as generally shown on US Geological Survey Quadrangle Maps. Intermittent streams were not considered in the stream buffer scenario maps. 3. Headwater Stream Buffers Headwater streams are also called First Order Streams. These streams, unlike other streams (Second Order, etc.), intercept all of the surface runoff within the watersheds that they drain. In addition, for many watersheds, first order streams drain the majority of the land within the entire watershed. Therefore, stream buffers restored along headwater streams (First Order) tend to have greater potential to intercept nutrients and sediments than stream buffers placed elsewhere. Map 15 Stream Order, which shows Georges Creek watershed blue line streams ranked by stream order. In targeting stream buffer restoration projects, giving higher priority to headwater streams is one approach to optimizing nutrient and sediment retention. In addition, restoring headwater stream buffers can also provide habitat benefits that can extend downstream of the project area. Forested headwater streams provide important organic material, like decomposing leaves, that feed the stream s food web. They also introduce woody debris which enhances in-stream physical habitat. The potential for riparian forest buffers to significantly influence stream temperature is greatest in headwater regions. These factors, in addition to positive water quality effects, are key to improving habitat for aquatic resources. 55
65 4. Land Use and Stream Buffers One factor that affects the ability of stream buffers to intercept nonpoint source pollutants is adjacent land use. Nutrient and sediment loads from different land uses can vary significantly. As the following table indicates, crop land typically contributes the greats nutrient and sediment loads. However, under some conditions urban land can contribute higher phosphorus loads. By identifying land uses in riparian areas with inadequate stream buffers, like crop land adjacent to streams, potential to reduce nutrient and sediment loads can be improved. To assist in finding areas with crop land adjacent to streams, the same land use data shown in Map Generalized Land Use can be filtered using GIS. The new scenario shown in Map 16 Land Use Scenario for Stream Buffer Restoration focuses on the land Nonpoint Source Pollution Load Rates By Land Use Chesapeake Bay Watershed Model, in kg/ha-yr Land Use Nitrogen Phosphorus Sediment Crop land Urban Impervious Pervious use within 150 feet of a stream. This view, supplemented with the land use pollution loading rates, suggests potential buffer restoration opportunities that could maximize nutrient and sediment loads. 5. Nutrient Uptake from Hydric Soils in Stream Buffers In general, the nutrient nitrogen moves from the land into streams in surface water runoff and in groundwater. In some soils, a significant percentage of nitrogen enters streams in groundwater. Stream buffer restoration can be used to capture nitrogen moving in groundwater if buffer restoration projects have several attributes: Plants with roots deep enough to intercept groundwater as it moves toward the stream Plants with high nitrogen uptake capability, and Targeting buffer restoration projects to maximize groundwater inception by buffer plants. Hydric soils in stream riparian areas can be used as one factor to help select stream buffer restoration sites. Siting buffer restoration on hydric soils would offer several benefits: Plant roots are more likely to be in contact with groundwater for longer periods of time Hydric soils tend to be marginal for many agricultural and urban land uses Natural vegetation in wet areas often offer greater potential for habitat. Map 17 Hydric Soils and Wetland Proximity identifies lands adjacent to streams that are on hydric soil in the Georges Creek watershed. An important next step in using this information is verification of field conditions. Care must be taken during field validation to evaluate any hydrologic modification of these soils, such as ditching or draining activities, which would likely decrease potential benefits Pasture Forest
66 6. Wetland Associations Wetlands and adjacent natural uplands form complex habitats that offer a range of habitat opportunities for many species. These habitat complexes tend to offer greater species diversity and other ecological values that are greater than the values that the wetland or uplands could offer independently. Therefore, restoring stream buffers adjacent to or near to existing wetlands tends to offer greater habitat benefits than the restoration project could otherwise produce. Map 17 Hydric Soils and Wetland Proximity identifies unforested buffers zones that are in close proximity (within 300 feet) to wetlands (National Wetlands Inventory). Restoration projects in these areas may offer opportunities to enhance and expand wetland habitat in addition to the other desirable buffer functions. 7. Optimizing Benefits by Combining Priorities Strategic targeting of stream buffer restoration projects can take into account many different potential benefits. Several of these scenarios are presented independently in this section. However, site selection and project design generally incorporates numerous factors to optimize benefits from the project. For example, finding a site with a mix of attributes like those in the following list could result in the greatest control of nonpoint source pollution and enhancement for living resources: land owner willingness / incentives marginal land use in the riparian zone headwater stream hydric soils selecting appropriate woody/grass species adjacent to existing wetlands / habitat For the Georges Creek watershed, Map 18 Stream Prioritization Scenario suggests stream segments to consider for potential buffer restoration based on the extent of woody vegetation and/or land use in the riparian area. The information for the map is derived from interpretation of photographic images from satellites or high altitude airplanes. This method is useful in identifying areas to target for site assessment but it is not very useful for local site analysis. For example in the Neff Run watershed, the 1999 stream assessment work identified about 15 stream segments with inadequate stream buffers. The map suggests that more than a third of streams in the watershed, mostly nearer to Georges Creek mainstem, are medium priority for buffer restoration (light green on the map). In summary, the GIS approach helps to prioritize areas for field investigation and the stream assessment approach identifies specific sites for potential project prioritization. 57
67
68
69
70
71 Wetland Restoration Wetlands serve important environmental functions such as providing habitat and nursery areas for many organisms, nutrient uptake and recycling, erosion control, etc. However, most watersheds in Maryland have significantly fewer wetland acres today than in the past. This loss due to draining, filling, etc. has led to habitat loss and water quality impacts in streams and in the Chesapeake Bay. Reversing this historic trend is an important goal of wetland restoration. One approach to identifying candidate wetland restoration sites involves identifying historic wetland areas based on the presence of hydric soils. This process can be accelerated by using GIS to manipulate soils information with other data like land use. The GIS products can then assist in initiating the candidate site search process, targeting site investigations and helping to identify land owners. To promote wetland restoration, DNR Watershed Management and Analysis Division has developed GIS capability for these purposes. For the Georges Creek watershed, GIS was used to create Map 19 Wetlands Restoration Opportunities using hydric soils as an indicator for potential wetland restoration sites. The steps and priorities used to generate the map are listed below: Data used: Hydric soils (Natural Soil Groups), existing wetlands (National Wetland Inventory), land use (Maryland Department Of Planning, 1997). Identify candidate hydric soil areas based on land use. Hydric soils on open land (agricultural fields, bare ground, etc.) are retained while those underlying natural vegetation and developed lands are excluded. Explore hydric soils based on proximity to existing wetlands or streams. In the Georges Creek watershed, hydric soils are relatively rare compared to non-mountainous regions in Maryland. Additionally, proximity to wetland and streams supplements the potential to target or prioritize candidate sites for on-the-ground assessment. The Wetland Restoration Opportunities Map highlights open lands on hydric soils in the Georges Creek watershed. Based on the analysis above, the following priorities for further assessment are offered: -- High Priority for site assessment: Considering the limited number of open land / hydric soils sites identified in this analysis, it is reasonable to assess all identified sites as potential wetland restoration sites. However, if assessment opportunities must be even more focused, open land / hydric soil sites that are in the floodplain or adjacent to existing wetlands are more likely to offer multiple benefits as wetland restoration projects. 62
72
73 RELATED PROJECTS Overview There are numerous projects and programs that have the potential to contribute to successful development and implementation of a Watershed Restoration Action Strategy (WRAS). Map 20 Construction Projects Affecting Watershed Restoration shows the approximate location of 23 projects. The accompanying Table by the same name serves a key for the map and gives a very brief description of each. Some of these projects are also described in greater detail in this section. The project listing included here suggests opportunities for cooperation and coordination that can improve the likelihood of success for the WRAS. While this listing is not all-inclusive, additions should be made to include important related projects and follow-up should continue to be undertaken to promote the WRAS process with these and other projects and programs. Georges Creek Mainstem Projects Georges Creek has a history of flooding and related property and stream corridor damage. Consequently, many projects along the Georges Creek mainstem integrate flood mitigation with watershed restoration. Two recently funded projects are summarized below. Additional projects may have been previously conducted in the area and they can be added to this section as the discretion of Allegany County. 1. Barton Wall Repair & Stream Restoration In Georges Creek at the town of Barton, eroding and unstable stream bed has undermined a flood control wall and bridge abutments and has exposed waterlines resulting in fish blockage and poor fish habitat. Total project cost is $1,349,000 including $386,000 in Federal Transportation Enhancement Program (TEP) funding. Project contact is Paul Kahl (see Contacts listing). The project has several objectives: - Stabilize 2100 linear feet of stream channel and elevate the stream to pre-existing conditions using hydraulic structures; - Eliminate fish blockage and protect water lines by adjusting the stream profile and using grade stabilization; - Reduce high bedload sediment by stopping stream down-cutting. Boulders, cross vanes and rock vanes will be used; - Improve fish habitat by creating pools and riffles, and; - Repair or replace 1700 linear feet of flood protection wall 64
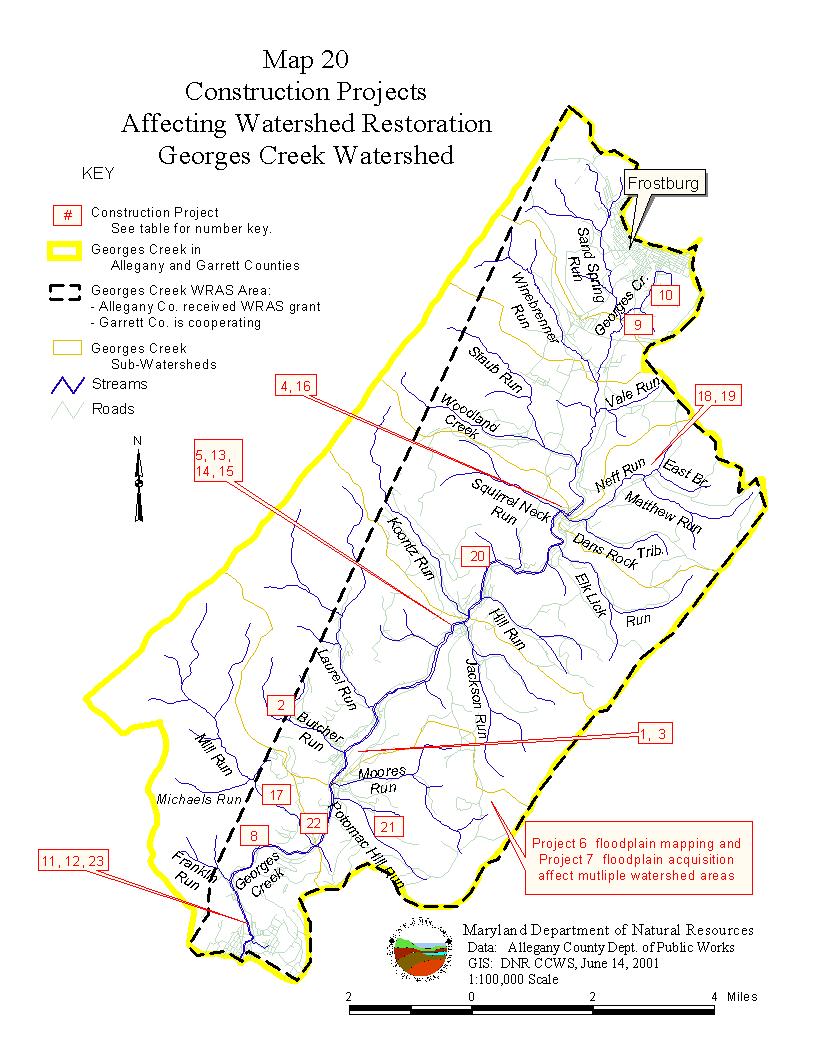
74