Solids Characteristics of Stormwater
|
|
|
- Allen Phelps
- 5 years ago
- Views:
Transcription


1 Module 4a: Catchbasins, Inserts, and Hydrodynamic Devices for the Control of Gross Solids and Conventional Stormwater Pollutants Robert Pitt Department of Civil and Environmental Engineering The University of Alabama Tuscaloosa, AL Gross floatables currently most important wet weather flow pollutant in many urban areas. Aesthetic (Floatables) and Gross Solids Characteristics of Stormwater Many communities are struggling with aesthetic degradation of urban waterways Litter from the landscape contributes to shoreline contamination Gross solids/bedload material, although a small portion of stormwater total solids loads, contributes to clogging of sewerage Stirred and Settled Sample, Showing Settleable Solids (Madison high-efficiency street cleaning tests) 1


 are")


2 Coulter Counter Multi-Sizer 3 used to measure particle size distribution of solids up to several hundred micrometers. Larger particles (up to several mm) are quantified using sieves. Measured Particle Sizes, Including Bed Load Component, at Monroe St. Detention Pond, Madison, WI Particle Size Analyses Using Cascading Sieves 2


3 Many stormwater monitoring configurations used over the years 8,000 25, Bed load compromises about 4% of Madison area total solids discharges. Problem isn t sample line velocity, but location of intake; need bedload sampler ,500 3,000 3,000 10,000 Size range (1.5 to 2.5 sp. gr.) Percentage loss of Critical settling particulates rate (cm/sec) Loss of Large Particulates in Sampling Lines (100 cm/sec sample line velocity) 3
")
 Sampled solids load out 1623 +131 = 1754 kg 1218 kg Trapped")
 Fraction total solids not captured by")

4 USGS and WI DNR Monitoring Facility for Stormceptor Tests, Madison, WI Results of Verification Monitoring of Stormceptor (Madison, WI) Sampled solids load in (plus material not sampled by automatic sampler) Sampled solids load out = 1754 kg 1218 kg Trapped by difference 405 kg (25% removal) Actual trapped total sediment 536 kg (33% actual removal) Fraction total solids not captured by automatic samplers 7.5% Trash screening, along with alum injection, Orlando, FL EquiFlow pump back system (Fresh Creek Technologies), Brooklyn, NY 4
")
 found cleaning catchbasin twice per year reduced total residue yields between 10% and 25%.")
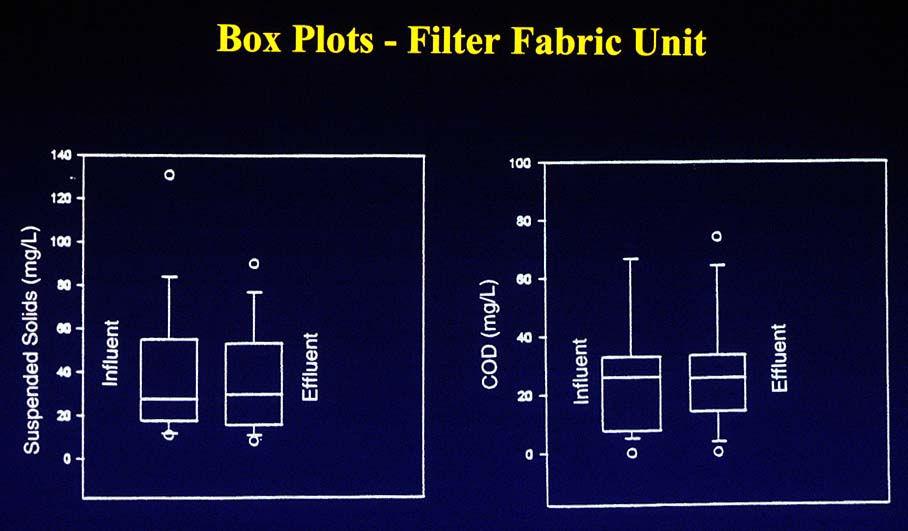
5 Netting TrashTrap (Fresh Creek Technologies), Brooklyn, NY Goals of Storm Drainage Inlet Devices Does not cause flooding when clogged with debris Does not force stormwater through the captured material Does not have adverse hydraulic head loss properties Maximizes pollutant reductions Requires inexpensive and infrequent maintenance Research Results A New Jersey study (Pitt, 1999) found average removal rates of 32% for suspended solids using catchbasins with a suitable sump. Pitt & Shawley (1982) found cleaning catchbasin twice per year reduced total residue yields between 10% and 25%. Pitt (1985) found sediment in catchbasins were the largest particles washed from streets. Typical German Inlet Strainer Basket Small British Gully pot inlet for combined sewers 5


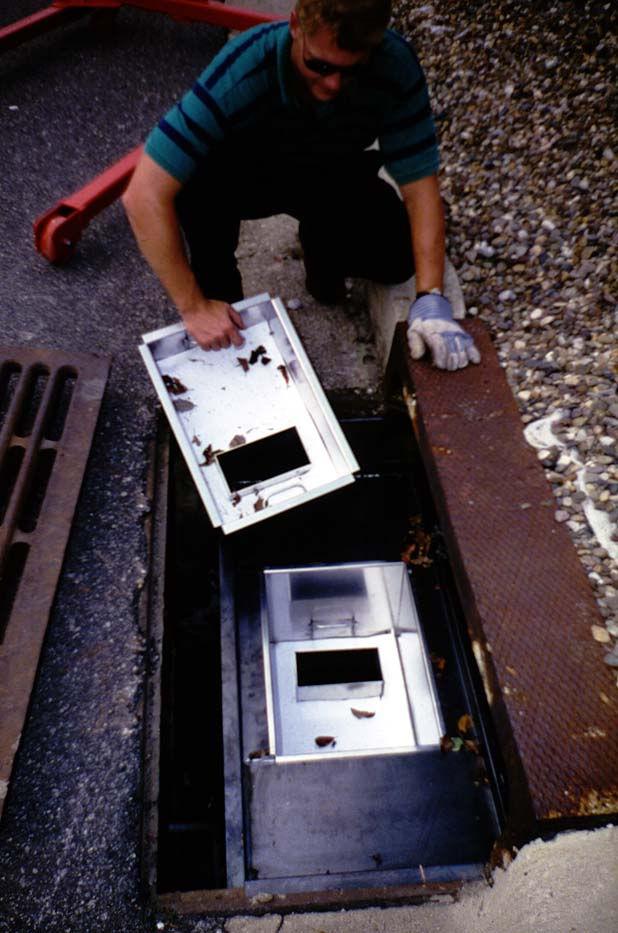
6 Drain Inserts Caltrans, San Diego and Los Angeles, California Coarse Screen Tested at Ocean County, NJ Filter Fabric Inlet Insert Tested at Ocean County, NJ 6


7 Retro-fitted Catchbasin with Sump Tested at Ocean County, NJ 7
 Depth/ Diameter ratio 0.")

 (recent EPA wet-weather group report) Severe deposition Mild to moderate deposition None to slight erosion top")
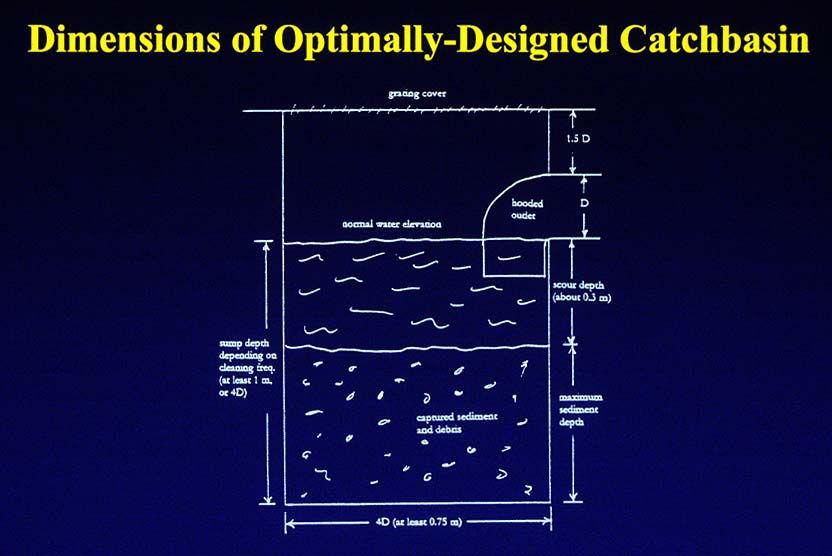
8 Pollutant Accumulations in 200+ Bellevue, WA, Residential/Commercial Area Catchbasins (kg/ha/yr) (Pitt 1985) Total Solids COD TKN TP Lead Zinc Baseflow total solids discharge: 110 kg/ha/yr Stormwater: 210 kg/ha/yr Velocity and shear stress for different slopes and depths (2 ft pipe) Depth/ Diameter ratio 0.1 Velocity (ft/sec) 0.1% slope 0.91 Shear stress (lb/ft 2 ) 0.1% slope Velocity (ft/sec) 2% slope 4.1 Shear stress (lb/ft 2 ) 2% slope Pipes having small slopes allow large particles to settle and form permanent deposits, while pipes with large slopes will likely have moving beds of larger material. Velocity (ft/sec) Fluid Shear Stress (lb/ft 2 ) Example conditions for 10 ft rough concrete pipe (full-flowing pumped system) (recent EPA wet-weather group report) Severe deposition Mild to moderate deposition None to slight erosion top layer Slight to mild erosion of consolidated beds (2-5%) Moderate erosion of consolidated beds (15-25%) Substantial erosion (35-50%) 8

, moderate to fine solids capture (34 and 24), and sorption/ion")


 9")


9 Upflow filter insert for catchbasins Upflow Filter TM patented Main features of the MCTT can be used in smaller units. The Upflow Filter TM uses sedimentation (22), gross solids and floatables screening (28), moderate to fine solids capture (34 and 24), and sorption/ion exchange of targeted pollutants (24 and 26). Successful flow tests using prototype unit and mixed media as part of EPA SBIR phase 1 project. Phase 2 tests are being currently conducted, including ETV to 20 gpm/ft 2 obtained for most media tested Series1 Series2 Series Pelletized Peat, Activated Carbon, and Fine Sand y = x R 2 = Residence Time, minutes Headloss (inches) 9 Flow (gpm) % Removal UpFlow Filter New Concept Components: 1. Access Port 2. Filter Module Cap 3. Filter Module 4. Module Support 5. Coarse Screen 6. Outlet Module 7. Floatables Baffle/Bypass Hydro International to 90% removal of dissolved zinc using sand/peat upflow filtration Upflow Filter Components 1. Module Cap/Media Restraint and Upper Flow Collection Chamber 2. Conveyance Slot 3. Flow-distributing Media 4. Filter Media 5. Coarse Screen 6. Filter Module Hydro International


 Judy")
10 Hydraulic Characterization High flow tests Assembling Upflow Filter modules for lab tests Initial CFD Model Hydro International Results EPA-funded SBIR2 Field Test Setup, Tuscaloosa, AL Preliminary Look at WinSLAMM as Method for Sizing Proprietary Settling Devices Roger Bannerman (WI DNR) Judy Horwatich (USGS) Jim Bachhuber (Earth Tech) September 19 22,

11 Examples of Proprietary BMPs Using Settling for Treatment Downstream Defender Stormceptor Vortechs Why Not Use Methods for Designing Detention Ponds to Develop a Sizing Criteria for Proprietary Treatment Practices Both Rely on Settling Suntree Detention Pond Proprietary Devices Using a Unit Process of Settling Benefits Underground Easy to Install Easy Maintenance Claims of High Performance Costs Installation Cost Biggest Variable Installation + Capitol Cost Range from $15,000 to 50,000 per Acre of Imperviousness Critical Velocities and Detention Pond Dimensions Path of particle is the vector sum of the water velocity (V) in the pond and the particle settling velocity (v). V v D Length 11
12 Upflow Velocity In an ideal sedimentation pond, particles having settling velocities greater than the upflow velocity will be removed. Design pond to make v as small as practical. Only increasing the surface area or decreasing system discharge rate will increase removal rates. Q v = ---- A v = Upflow Velocity = critical settling velocity Q = Pond Outflow Rate A = Pond Surface Area Average particle size distrubtion for 6 monitored sites NURP Particle Size Distribution NURP Site N Site Na Site S Site M Site SM Site Sc Particle size, microns 12 Percentage greater than Variables in Sizing Treatment Practice Influent hydrograph Particle Size Distribution Influent Pollutant Load Upflow Velocity Scour Calculation Short-circuiting Calculation Land Use Needs for Continuous Simulation Model Changing Q means changing v; create flow weighted critical velocity. Flexibility to use different inputs eg. Particle size distribution, rainfall, etc. Account for short-circuiting. More flexibility in selection of outlet structures..
13 Influent and Effluent Particle Size Distributions for Monroe St. Pond 45% Influent Particle Size Distribution 36% 19% Clay Silt Sand 26% Effluent Particle Size Distribution 1% Clay Silt Sand 73% Models Using Upflow Velocity Authors Robert Pitt and John Voorhees Source Load and Management Model (SLAMM) Developed to assist cities in evaluating the benefits of alternative stormwater treatment practices for both runoff quality and quantity in existing and developing urban areas. DETPOND Developed to predict how much particulate solids a wet detention pond will be removed from urban runoff. Most features of DETPOND are in SLAMM. Criteria for Testing Validity of Using SLAMM Example of Proprietary Device Monitoring 1. Treatment Efficiency Range 0 to 20 Percent = Low 20 to 40 Percent = Medium Low 40 to 60 percent = Medium 60 to 80 percent = Medium High 80 to 100 percent = High Rob Waschbusch USGS 1996 to 1997 Sponsors City of Madison and WDNR 2. Closer than 10 percentage points Stormceptor 13


14 Manufacturer Sizing Guidelines Claimed 80% Removal of Total Suspended Solids for the Site. 4.3 Acres with 100% Connected Imperviousness Site Conditions Maintenance Yard Stormceptor Monitoring Equipment Sampled 45 Runoff Events Site Conditions Stormceptor 14


15 Monitoring Locations Inlet Sample Point Bypass Sample Point Outlet Sample Point Vortechs Milwaukee,WI. Test Site: I

 $ $ Stormceptor Measured Estimated Percent Difference Water Volume, cubic feet TSS Load, lbs.")
16 Vortechs Monitoring Site Vortechnic's Comparison of Observed vs. Predicted Volumes Observed Versus Predicted Water Volumes and TSS Loads for the Vortechs Site Observed (cf) Vor t echnic Compar ison of Obser ved vs. Pr edict ed Loadings Observed Load ( lbs) $ $ Stormceptor Measured Estimated Percent Difference Water Volume, cubic feet TSS Load, lbs. 85, , Observed Versus Predicted Water Volumes and TSS Loads for Stormceptor Site Vortechs System Measured Estimated Percent Difference 10,466 10, Predicted (cf)
 Stormceptor (15 events, bypass) Influent 63 939 Effluent 51 895 % TSS Reduction 19% 5% 100 80 60 40 20 0-20 TSS Reduction as a Function of Peak Discharge")
17 TSS Load Reduction Results Used for Model Comparison TSS Loads, Kg. Type of Load Vortechs (18 events, no bypass) Stormceptor (15 events, bypass) Influent Effluent % TSS Reduction 19% 5% TSS Reduction as a Function of Peak Discharge for the Stormceptor (includes both treated & bypass water) >1.1cfs = bypass flow Peak Flows, CFS 17 TSS Reduction, % Model Input Tank is: Height: 13.5 Diameter: 10 Surface Area = acres. Outlet Structure = 10 Orifice Used Actual Rainfall Measured for 15 Storms.
18 Particle size distrubution for warm weather events at the Stormceptor site Particle size (microns) Particle-size data used in WINSLAMM Vortech Stormceptor Sieve Size (Microns) 18 % greater than Percent Greater Than Ideal Particle Size Trapped for Different Sites Percent Greater Than Site 20 Percent 40 Percent 80 Percent Residential (Monroe) Freeway (Riverwalk) Parking Lot (St. Marys) NURP Particle Sizes Distribution for Selected Storms at the Vortechs Site Particle Size Distribution Percent Greater Than
19 Particle size distribution for summer events at Stormceptor site IN-4 IN-7 IN-8 IN-10 IN-13 IN-12 IN-15 Summer Events Particle size (microns) Comparison of Measured and Modeled TSS Reductions Stormceptor Measured TSS Reductions 5% SLAMM / DETPOND Estimates with Measured PSD and Rainfall 12% Vortechs 19% 19% 19 Percent greater than Stormceptor's Removal efficiency of suspended solids as a function of peak discharge 90% 80% 70% 60% 50% 40% 30% 20% 10% 0% -10% Observed Predicted Under Over Peak flow (cfs) Efficiency 1. Good agreement (+- 10%) for ½ half of events. 2. Particle size range of 35 microns = 35% change in percent control Vortech Removal Efficiency of TSS as a Function of Peak Discharge Observed Predicted Peak Discharge (cfs) -173 TSS Removal (%)
20 Factors Affecting Difference Between Observed and Predicted Percent Reductions for Individual Storms Scour SLAMM needs to predict scour using velocity, type of sediment, and depth of sediment Particle Size Distribution Individual event particle size not practical, but SLAMM will accept Bypass - SLAMM does, but needs higher concentration (Concentrations x 1.7) Short Circuiting Appears to have small effect. TSS Reductions for Stormceptor using DETPOND (Madison Rain81 and NURP PSD) Percent of Drainage Area How Big Do We Have to Make Stormceptor to Achieve TSS Performance Standards at Maintenance Yard? Stormceptor Size of Stormceptor for Selected TSS Reductions (Madison Rain81 and NURP PSD) Percent TSS Reduction Diameter of Tank, Feet Tank as a Percent of Drainage Area % % % % 20 Percent TSS Reduction
 To Achieve Performance Standards?")

21 Number of 10 Diameter Stormceptors to Achieve TSS Reduction on a 4.3 acre Site Percent TSS Reduction Number of Stormceptors for 4.3 acre Site 10% 1 20% 3 40% 20 Why Does Stormceptor Require Such a Large Surface Area (A) To Achieve Performance Standards? Typically, these devices do not have sufficient active storage Water Quality Storage Active storage is needed to allow for a small enough outlet structure (smaller Q) Q V = A Detention Pond Needs to be 2.4% of the Drainage Area to Achieve 80% Control of TSS at Stormceptor Site. Monroe St. Detention Pond Conclusions WinSLAMM is a reasonable way to estimate SOL for for Proprietary Settling Devices. 80 % Control is Probably Not Practical for Most Sites. 40 % Control Might Work for Sites with Larger Particle Sizes. 20 % Control may be Practical for Most Sites. 21

22 Information Needed to Model Catchbasins and Hydrodynamic Devices 1. Catchbasin Density 2. Catchbasin Geometry 3. Flow and Particle Size Data 4. Catchbasin Cleaning Information 5. Outlet Controls 6. Bypass Information for Hydrodynamic Device Geometry Information Use average values for the drainage basin you are modeling Catchbasin Density Inflow Bypass Data Hydrodynamic Devices Only 22


23 Inflow Bypass Data Two Options Either User-defined Maximum Flow, or... Flow and Particle Size Data Hydrodynamic Devices Only Inflow Bypass Data Defined Flow Diversion Geometry Hydrodynamic Devices Only Catchbasin Cleaning Information 23
 24 1 Velocity (ft/hr) Settling modeled as a detention basin assuming: Vertical sides No storage Flow rate calculated using Complex Triangular Hydrograph")


24 Catchbasin Performance Algorithms Calculated Settling Velocity Particulate removal based upon particle size Particle Size (microns) 24 1 Velocity (ft/hr) Settling modeled as a detention basin assuming: Vertical sides No storage Flow rate calculated using Complex Triangular Hydrograph Transition from Stokes Settling to Fitted Data Curve Settling Velocity (ft/hr) Settling Velocity (ft/hr), R > 0.5 Drainage System Particulate Solids Yield Before Drainage System Total After Drainage System Total Rain No. Catchbasin Output Catchbasin Cleaning Model Results StageOutflowCB.csv StageInflowCB.csv Additional Output CBPerformanceByStep.csv CBPerformance.csv Maximum Weighted Runoff Inflow Maximum Total Cumulativ Total Volume from Time Inflow Hydraulic Seepage Volume Bypass e Volume CB Maximum Solids Rain per CB Basin Increment through Volume In Volume Volume Out of CB Volume Out of CB Efficiency Inflow Maximum Reduction Depth (in) (cf) (cfs) (min) CB (cfs) (cf) Out (cf) Out (cf) (cf) (cf) (cf) Reduction Stage CB Stage (fraction) E E E E E E E E E E E E E E E E E E E E E E E E E E E E E E E