I-880, SR-84 and SR-92 Express Lanes Project in Alameda and Santa Clara Counties Summary of Environmental Technical Analyses
|
|
|
- Noreen Copeland
- 5 years ago
- Views:
Transcription
1 Summary of I-880, SR-84 and SR-92 Express Lanes Project in Alameda and Santa Clara Counties Environmental Technical Analyses: Greenhouse Gas Emissions, Vehicle Miles Traveled and Use by Low-Income Populations January 13, 2016 Metropolitan Transportation Commission th Street Oakland, CA
2 Section 1: Overview This report, prepared solely by the Metropolitan Transportation Commission (MTC), summarizes technical analyses of greenhouse gas (GHG) emissions effects, vehicle miles traveled (VMT) effects, and use of express lanes by low-income populations of the I-880, SR-84 and SR-92 Express Lane Project (Project). The Project consists of the following three segments, I-880 between Hegenberger Road/Lewelling Boulevard and SR-237, the Dumbarton Bridge westbound approach on SR-84 and the San Mateo Bridge westbound approach on SR-92. The Project is proposed by the State of California Department of Transportation (Caltrans) in cooperation with the MTC. As the lead agency, Caltrans prepared the technical studies for environmental review in accordance with the California Environmental Quality Act (CEQA) and National Environmental Policy Act (NEPA). The technical studies follow the formats and procedures outlined in Caltrans Standard Environmental Reference. This summary was prepared by the MTC and in accordance with the Settlement Agreement dated June 18, 2014 among the MTC and the Association of Bay Area Governments (ABAG), and Communities for a Better Environment and the Sierra Club. This summary is solely the work of the MTC. Caltrans was not involved in the production of this summary. 1.1 Project Description Two alternatives were considered in the technical studies: the Build Alternative and the No Build Alternative. The Build Alternative, also referred to as the Project, would convert approximately 30 miles of existing HOV lanes to tolled express lanes (Figure 1). Express lane conversions on I-880 would total approximately 25 miles, in the northbound direction between SR 237 and Hacienda Avenue and in the southbound direction between Dixon Landing Road and Hegenberger Road. The San Mateo Bridge approach would convert approximately 3 miles of HOV lanes to express lanes in the westbound direction from the Toll Plaza to I-880. The Dumbarton Bridge approach conversion would be approximately 2 miles in length in the westbound direction from the Toll Plaza to Hesperian Boulevard. Consistent with other express lanes that are currently being planned and implemented in the Bay Area, the express lanes along I-880 and the bridge approaches would generally allow for continuous access between the express lane and the adjacent mixed-flow (general purpose) lane. Under this configuration, all eligible users, including HOVs, motorcycles, buses, decal vehicles as authorized by the California Air Resources Board, and toll-paying single occupant vehicles, would be able to access the express lane with FasTrak Flex during the hours of operation, which are planned to be morning and evening peak periods. Eligible vehicles with HOV status would continue to use the express lane toll-free. Solo users who value time savings and who want a more convenient and reliable trip may choose to use the new express lane for a fee. A wide white dashed pavement stripe between the express lane and general purpose lane would be used to inform motorists of the limits of the continuous access express lane. In areas where substantial amounts of merging into and out of the express lane are expected, restricting access between the express lanes and the mixed-flow lanes can be beneficial to reduce congestion and improve safety. There are several locations along the I-880 corridor where restricted access is planned 2
.")
3 to ensure that merging movements into and out of the express lanes flow smoothly and support optimal traffic operations. Restricted access would be achieved through lane striping. A double solid line would indicate restricted access and inform motorists to not merge into or out of the express lane until they reach a designated ingress and/or egress weave lane (Figure 2). Figure 1: Express Lane Project Map (Figure 1-1 in the Air Quality Technical Report) 3

4 Figure 2: I-880 Express Lane Locations of Continuous Access and Buffer Separation (Figure 2-1 in the Environmental Justice Technical Memorandum) 1.2 Environmental Review As the lead agency, Caltrans found the Project to qualify as a Categorical Exemption under CEQA and Categorical Exclusion under NEPA. The State Clearing House number for the Notice of Exemption is SCH# , and was posted on October 26, See: 4
5 Section 2: Greenhouse Gas (GHG) Emissions Effects This section summarizes the results of technical analyses of greenhouse gas emissions (GHG) as reported in the Air Quality Technical Report for the I-880 Northbound & Southbound, State Route 84 Westbound, and State Route 92 Westbound Phase 1 Express Lanes Project (January 2015). The purpose of the Air Quality Technical Report is to assess the existing and future air quality impacts in the vicinity of the proposed modifications from the construction and operation of the Project. 2.1 Methodology The GHG analysis methodology is described in Chapters 4 and 5 of the Air Quality Technical Report. The Air Quality Technical Report states that the analysis of the operational phase involves a quantitative evaluation of GHG emissions for the existing year (2012), opening year No Build (2015), opening year Build (2015), horizon year No Build (2035), and horizon year Build (2035). GHG emissions were modeled using the latest EMFAC model (EMFAC2011) for vehicles in Alameda County. GHG emissions were predicted both without and with the Pavley and Low Carbon Fuel Standard (LCFS) requirements. GHG emissions were modeled using estimates of peak period and off-peak period traffic volumes, distance traveled and speeds from traffic analysis. The Air Quality Technical Report states that the EMFAC model was run using the procedures described in the UC Davis Methodology for Alameda and Santa Clara Counties. Under the UC Davis Methodology, daily traffic volumes were split between peak and off-peak hours, and emissions were calculated for each of these periods using average travel speeds for each period. This procedure was followed for each segment between interchanges and then summed to estimate the total GHG emissions from the Project. The peak period is the time the highway is congested and the off-peak period is all other times. The analysis included separate peak hour volumes for each of the four-hour peak periods. Caltrans general procedures for construction analysis, including use of Sacramento Air Quality Managements District s Road Construction Model, were also used for the analysis. 2.2 Analysis Results The Project s effect on GHG emissions is reported in Chapter 5 of the Air Quality Technical Report, in Section 5.2.4, which considers potential adverse contributions to climate change, and in Section 5.3.3, which considers GHG construction impacts Summary The Air Quality Technical Report finds the Project would not produce substantial air quality impacts for GHG emissions in the operations phase, and therefore recommends no avoidance, minimization or mitigation measures. Construction GHG emissions are not quantified due to the limited construction scope proposed. The report does not identify any mitigation measures for GHG emissions during construction Context 5

6 The Air Quality Technical Report states that global climate change is a cumulative impact. An individual project does not generate enough GHG emissions to significantly influence global climate change. An individual project may, however, contribute to a potential impact through its incremental change in emissions when combined with the contributions of all other sources of GHG 1. In assessing cumulative impacts, it must be determined if a project s incremental effect is cumulatively considerable (CEQA Guidelines sections 15064(h) (1) and 15130). To make this determination, the incremental impacts of the Project must be compared with the effects of past, current, and probably future projects. The Air Quality Technical Report states that Caltrans has created and is implementing a Climate Action Program that was published in December One of the main strategies in Caltrans Climate Action Program to reduce GHG emissions is to make California s transportation system more efficient. The highest levels of carbon dioxide (CO 2) from mobile sources, such as automobiles, occur at stop-and-go speeds (0-25 mph) and speeds over 55 mph; the most severe emissions occur from 0-25 mph (see Figure 3). To the extent that a project relieves congestion by enhancing operations and improving travel times in high congestion travel corridors, GHG emissions, particularly CO 2, may be reduced. Figure 3: Possible Effect of Traffic Operation Strategies in Reducing On-Road CO 2 Emissions (Figure 5-3 in the Air Quality Technical Report) Operational Phase The Air Quality Technical Report shows GHG emissions are predicted to go down from the existing year (2012) to the opening year (2015) and then to the horizon year (2035) under either the Build and the 1 This approach is supported by: Recommendations by the Association of Environmental Professionals on How to Analyze GHG Emissions and Global Climate Change in CEQA Documents (March 5, 2007), as well as the South Coast Air Quality Management District (Chapter 6: The CEQA Guide, April 2011) and the US Forest Service (Climate Change Considerations in Project Level NEPA Analysis, July 13, 2009). 2 Caltrans Climate Action Program is located at the following address: 3 Traffic Congestion and Greenhouse Gases: Matthew Barth and Kanok Boriboonsomsin (TR News 268 May-June 2010) 6

7 No-Build Alternatives, due mostly to the Pavley and Low Carbon Fuel Standard requirements. 4 Tables 1 & 2 show Project GHG emissions expressed in metric tons per day of CO 2. The summary of the total emissions are shown in Table 3. GHG emissions are presented with the Pavley and Low Carbon Fuel Standard requirements. The Air Quality Technical Report also finds the Build Alternative will help relieve congestion in the traffic peak hour periods during the day by shifting traffic from the mixed flow lanes to the HOV lanes, making more efficient use of the corridor s excess HOV lane capacity. In the opening year, both the No Build and Build Alternative would have lower CO 2 GHG emissions than existing conditions, and the Build emissions would be higher than No Build. Emissions for the horizon year of the No-Build and Build Alternative would have lower CO 2 GHG emissions than the existing conditions, and Build emissions would be lower than No Build condition. The speeds and VMT used in the emissions model are shown in Tables 1 & 2. The speeds represent the average speeds during the off-peak period and the peak periods along the I-880, SR 84 and SR 92 corridor within the Project limits. The Air Quality Technical Report states that the daily VMT will remain the same for both the Build and No-Build Alternatives in the opening year and the horizon year. In the Build Alternative there will be a shift in the VMT from the off-peak period to the peak period and a slight increase in the average speeds during the peak period. Table 1: I-880 CO 2 Emissions (Metric Tons per Day) (Table 5-2 in the Air Quality Technical Report) 4 This terminology refers to requirements resulting from Assembly Bill 1493 (AB1493) enacted in 2002 and Executive Order S AB 1493, sponsored by assembly member Pavley, required the California Air Resources Board to develop and implement regulations to reduce automobile and light truck greenhouse gas emissions beginning in the 2009-model year. Executive Order S-01-07, signed by California Governor Arnold Schwarzenegger in 2007, established that the carbon intensity of California s transportation fuels was to be reduced by at least ten percent by the year
 The Air Quality Technical Report states that the computed CO 2 emissions are only useful for a comparison between alternatives.")

8 Table 2: Westbound SR 92 and SR 84 CO 2 Emissions (Metric Tons per Day) (Table 5-3 in the Air Quality Technical Report) Table 3: Summary of CO2 Emissions (Metric Tons per Day) (Table 5-4 in the Air Quality Technical Report) The Air Quality Technical Report states that the computed CO 2 emissions are only useful for a comparison between alternatives. The numbers are not necessarily an accurate reflection of what the true CO 2 emissions will be because CO 2 emissions are dependent on other factors that are not part of the model, such as the fuel mix 5, rate of acceleration, and the aerodynamics and efficiency of the vehicles. The Air Quality Technical Report does not evaluate the changes in CO 2 emissions translated throughout the entire Bay Area transportation network, which is conducted at the regional transportation plan level. The Project is included in the 2013 Regional Transportation Plan, Plan Bay Area, and 2015 TIP, which demonstrate that the region will remain below all approved vehicle emission budgets through the RTP study year. The Air Quality Technical Report finds no avoidance, minimization, and/or mitigation measures are required during the operations phase, as the Project would not produce substantial operational air quality impacts for GHG emissions Construction Phase 5 EMFAC2011 model emission rates are only for direct engine-out CO2 emissions, not full fuel cycle; fuel cycle emission rates can vary dramatically depending on the amount of additives like ethanol and the source of the fuel components. 8
9 The Air Quality Technical Report states that construction GHG emissions for transportation projects include emissions produced as a result of material processing, emissions produced by onsite construction equipment, and emissions arising from traffic delays due to construction. These emissions will be produced at different levels throughout the construction phase; their frequency and occurrence can be reduced through innovations in plans and specifications and by implementing better traffic management during construction phases. In addition, with innovations such as longer pavement life cycles, improved traffic management plans, and changes in materials, the GHG emissions produced during construction can be reduced to some degree by longer intervals between maintenance and rehabilitation events. Currently, neither Caltrans nor the Bay Area Air Quality Management District (BAAQMD) have adopted GHG significance thresholds that apply to construction projects. Similar to construction exhaust and evaporative emissions, GHG emissions from construction activities have not been quantified due to the limited construction scope proposed. The Air Quality Technical Report does not identify any mitigation measures for GHG emissions during construction. 9
10 Section 3: Vehicle Miles Traveled (VMT) Effects This section summarizes vehicle miles traveled (VMT) estimates as reported in the Final Traffic Operations Analysis Report: MTC Phase 1 Express Lanes Project-I-880 Corridor (April 2015), Final Traffic Operations Analysis Report: MTC Phase 1 Express Lane Project-SR 84 Corridor (February 2015), and Final Traffic Operations Report: MTC Phase 1 Express Lane Project-SR 92 Corridor (February 2015). The traffic operations analysis reports (TOARs) present the existing and future conditions related to transportation without and with Express Lanes on the I-880 between Hegenberger Road and SR 237 interchanges in the southbound direction, and between the SR 237 and south of the SR 238 interchanges in the northbound direction; on SR 84 between I-880 and the Dumbarton Bridge Toll Plaza in the southbound direction; and on SR 92 between I-880 and the San Mateo Bridge Toll Plaza in the westbound direction. A TOAR was completed for each corridor individually so the VMT analysis is presented for each corridor. The results in the TOARs serve as the basis for the traffic operations section of the Project Approval/Environmental Document (PA/ED). In the TOARs, VMT is included as one of the system-wide Measures of Effectiveness (MOEs), and is not the focus of the report. The system-wide MOEs are based on all passenger vehicles in the study area. 3.1 Methodology The traffic analysis methodology is described in Sections 2.4 and 4.0 of each TOAR. The methodology explained in section 3.1 of this summary applies to the I-880 TOAR, SR 84 TOAR and SR 92 TOAR. The TOARs state that freeway analyses were conducted using procedures and methodologies consistent with the Highway Capacity Manual 2010 (Transportation Research Board, 2011) and applied using VISSIM traffic analysis software. The existing conditions traffic analysis model was validated to observed traffic counts, travel times, bottleneck locations and queues prior to extracting measures of effectiveness from the model. The procedures used are consistent with Traffic Analysis Toolbox Volume III: Guidelines for Applying Traffic Micro-simulation Modeling Software (FHWA, 2004). The TOARs state that VMT, one of the MOEs, was computed with VISSIM models to quantify traffic operations of the I-880, SR 84, and SR 92 corridors. The system-wide MOEs are presented for the fourhour study period to provide a better understanding of overall traffic operations during each study period. VMT is a measure of the total vehicle throughput of the corridor. This measure takes into consideration the actual volume served versus the demand and the trip lengths of those vehicles and travelers. The TOARs state that Alameda County Transportation Commission (Alameda CTC) serves as the designated Congestion Management Agency for Alameda County and in that capacity is responsible for maintaining a travel demand model and database that is consistent with MTC s model and database. The Alameda CTC Model was used in the traffic forecast analysis for the TOARs. The Alameda CTC Model is a regional travel demand model that covers the entire Bay Area, with higher level of geographic detail within Alameda County. The model receives its demographic inputs from the Association of Bay Area Governments (ABAG) regional land use projections, and produces estimates of regional travel flows 10
11 based on a standard four step modeling process. To ensure a high level of confidence in the forecasting process, the Alameda CTC Model was first refined and validated within the Project study area. The TOARs state that the Alameda CTC Model was updated to 2012 conditions and was validated to a level well within the application model validation guidelines. The analysis scenarios used in the reports are opening year (2015) No Build, opening year (2015) with Express Lanes, horizon year (2035) No Build and horizon year (2035) with Express Lanes I-880 TOAR Analysis Results In section 3.2 of this summary, the Project is the traffic study area defined as I-880 from the Montague Expressway interchange in the City of Milpitas to the 66 th Avenue interchange in the City of Oakland (Figure 4). The TOAR states that the geographic area considered for the analysis extends beyond the Project limits to capture effects of the proposed Express Lane on the surrounding area and the effects of traffic in the surrounding area on the proposed Express Lane. The estimated VMT associated with the Project is reported in Chapter 5 of the I-880 TOAR in Sections and , which considers the MOEs for the opening year (2015), and in Chapter 6 in Sections and , which considers the MOEs for the horizon year (2035). 6 Since the TOARs analyze the impact to passenger vehicles, truck traffic is excluded from the Measures of Effectiveness analyses. 11
 3.2.")
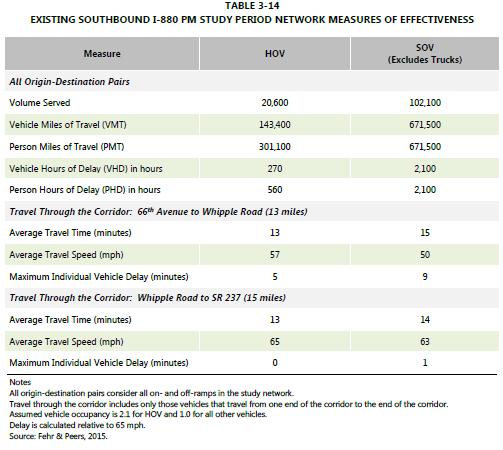
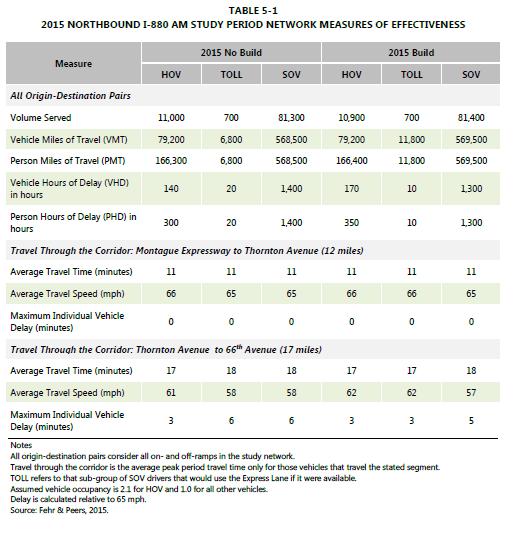
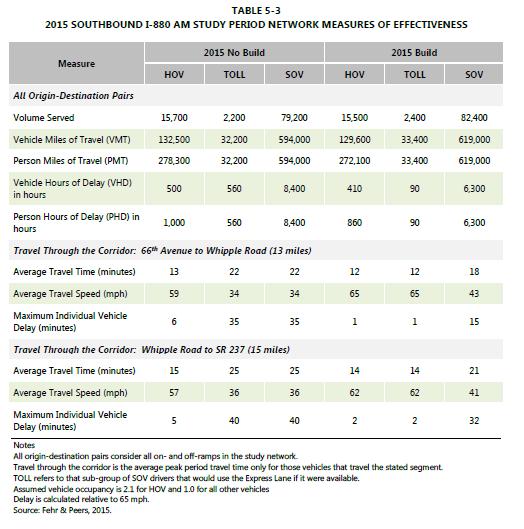
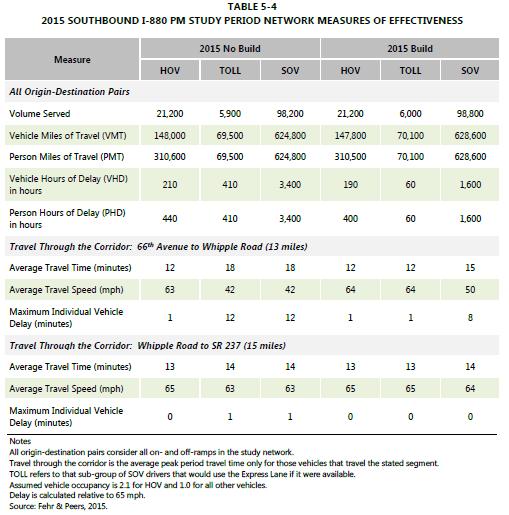
12 Figure 4: I-880 Express Lane Project Area and Limits (Figure 2-1 in the I-880 TOAR) Existing Year (2012) VMT Forecasts The Alameda CTC Model was updated to 2012 conditions and was validated to a level well within the applicable model validation guidelines, so the base year model for the Project reflects year 2012 conditions. Existing year (2012) VMT forecasts are shown with other MOEs in Appendix A; Tables 3-11, 3-12, 3-13, & Opening Year (2015) VMT Forecasts The TOAR summarizes the VMT findings with other MOEs. The TOAR states that for the opening year (2015) northbound a.m. peak study period, VMT would remain relatively unchanged for SOV and HOV drivers with the Express Lanes, but would increase substantially for tolled drivers because the Express Lanes would provide these drivers with a more efficient and reliable trip than drivers in the general purpose lane. Taken as an aggregate, the overall volume served, VMT, and person miles traveled (PMT) for all drivers would increase about 1 percent during the opening year (2015) northbound a.m. peak period. The TOAR states that for the opening year (2015) northbound p.m. peak study period there is little change (about 1 percent) in VMT with the Express Lane for SOV and HOV drivers. The TOAR states the volume served, VMT and PMT increase between 2 percent and 3 percent with the Express Lanes during the opening year (2015) southbound a.m. peak study period and remain relatively 12
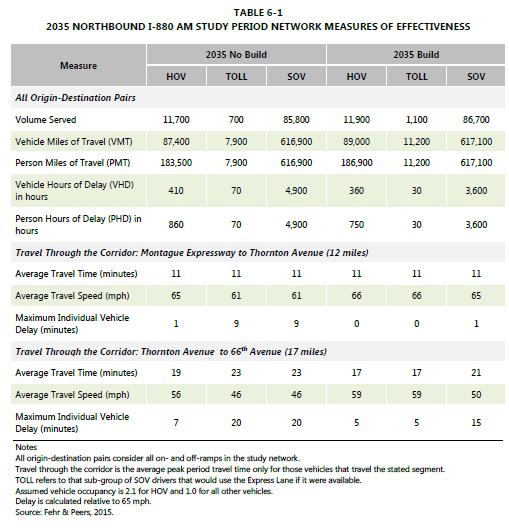
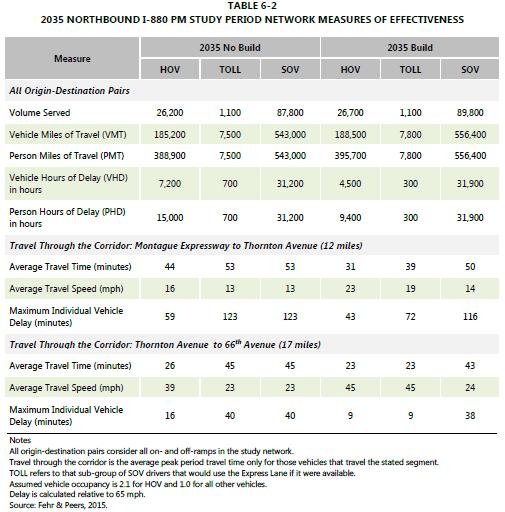
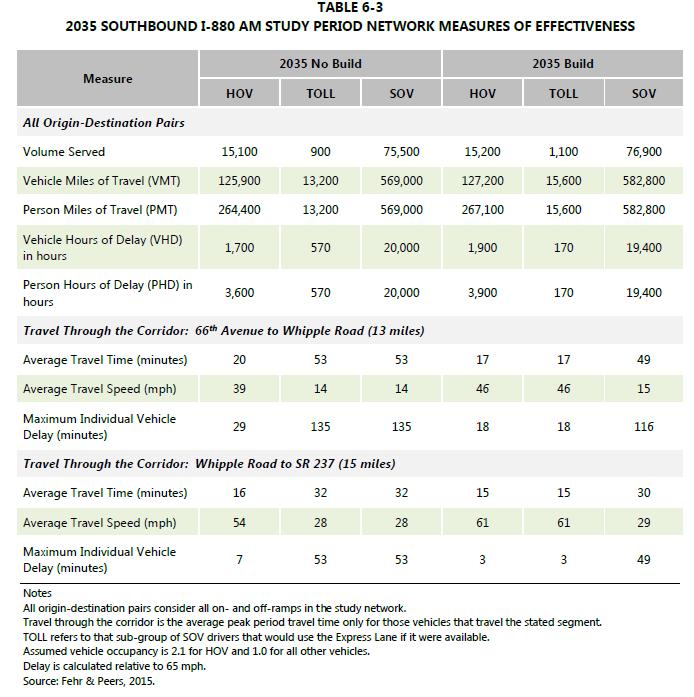
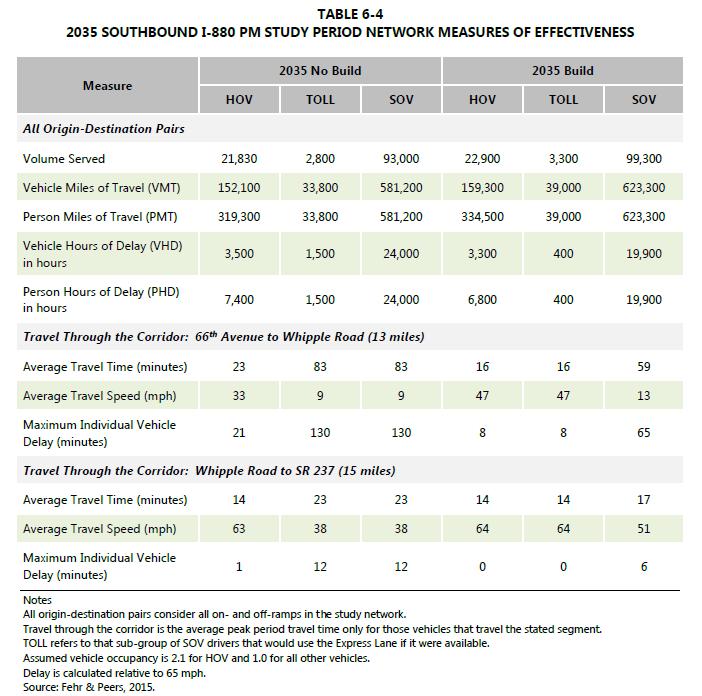
13 unchanged during the opening year (2015) southbound p.m. peak study period because there is only one bottleneck in the corridor so most drivers are able to reach their destinations. The Express Lane relieves southbound congestion during the a.m. and p.m. peak periods, allowing for an increase in vehicles served and a corresponding increase in VMT. The TOAR states that these changes are small and only occur during the a.m. peak period when the Express Lane is operational and so will not induce more traffic to use the corridor over the day. [Opening year (2015) VMT forecasts are shown with other MOEs in Appendix A; Tables 5-1, 5-2, 5-3, & 5-4] Horizon Year (2035) VMT Forecasts The TOAR states that for the horizon year (2035) northbound a.m. and p.m. study periods the volume served, VMT and PMT remains relatively unchanged (about 2 percent) with the Express Lane. The TOAR states that for the horizon year (2035) southbound a.m. study period the volume served, VMT and PMT increase between 1 percent and 2 percent with the Express Lane. During the horizon year (2035) southbound p.m. study period, volume served, VMT and PMT increase between 5 percent and 7 percent. The greater increase during the p.m. peak period occurs because the Express Lane increases the vehicle throughput at the SR 84/Decoto Road bottleneck allowing more vehicles to be served than under the No Build scenario. [Horizon year (2035) VMT forecasts are shown with other MOEs in Appendix A; Tables 6-1, 6-2, 6-3, & 6-4]. 3.3 SR 84 TOAR Analysis Results In section 3.3 of this summary, the Project is the traffic study area defined as the southbound SR 84 corridor from east of the I-880 interchange in the City of Newark to west of the Toll Plaza and mainline metering lights at the Dumbarton Bridge (Figure 5). The TOAR states that the geographic area considered for the analysis extends beyond the Project limits to capture effects of the proposed Express Lane on the surrounding area and the effects of traffic in the surrounding area on the proposed Express Lane. The estimated VMT associated with the Project is reported in Chapter 5 of the SR 84 Traffic Operations Report in Section , which considers the MOEs for the opening year (2015), and in Chapter 6 in Section , which considers the MOEs for the horizon year (2035). 13
 VMT Forecasts The Alameda CTC Model was updated to 2012 conditions and was validated to a level well within the applicable model validation guidelines, so the base year model")
14 Figure 5: Southbound SR 84 Express Lane Project Area (Figure 2-1 in the TOAR) Existing Year (2012) VMT Forecasts The Alameda CTC Model was updated to 2012 conditions and was validated to a level well within the applicable model validation guidelines, so the base year model for the Project reflects year 2012 conditions. Existing year (2012) VMT forecasts are not provided in the SR 84 TOAR Opening Year (2015) VMT Forecasts The TOAR summarizes the VMT findings with other MOEs. The TOAR states that for the opening year (2015) southbound a.m. peak study period, vehicles served and VMT would realize a slight increase, less than 1 percent in the aggregate. The TOAR states that for the opening year (2015) southbound p.m. study period there is no change in VMT with the Express Lane when corridor congestion levels are minimal. The TOAR states that the Express Lane would not induce more traffic to use the corridor because the bridge s mainline metering lights would constrain the vehicle throughput crossing the bridge to 5,350 vehicles per hour whether or not the Express Lane is provided. [Opening year (2015) VMT forecasts are shown with other MOEs in Appendix B; Table 5-2] Horizon Year (2035) VMT Forecasts The TOAR states that for the horizon year (2035) southbound a.m. peak study period, vehicles served and VMT would realize a slight increase, less than 1 percent in the aggregate. The TOAR states that for 14

15 the horizon year (2035) southbound p.m. study period there is no change in VMT with the Express Lane when corridor congestion levels are minimal. The TOAR states that the Express Lane would not induce more traffic to use the corridor because the bridge s mainline metering lights would constrain the vehicle throughput crossing the bridge to 5,350 vehicles per hour whether or not the Express Lane is provided. [Horizon year (2035) VMT forecasts are shown with other MOEs in Appendix B; Table 6-2]. 3.4 SR 92 TOAR Analysis Results In section 3.4 of this summary, the Project is the westbound 92 corridor from east of the I-880 interchange in the City of Hayward to west of the Toll Plaza and mainline metering lights at the San Mateo Bridge (Figure 6).The TOAR states that the geographic area considered for the analysis extends beyond the Project limits to capture effects of the proposed Express Lane on the surrounding area and the effects of traffic in the surrounding area on the proposed Express Lane. The estimated VMT associated with the Project is reported in Chapter 5 of the Traffic Operations Report in Section , which considers the MOEs for the opening year (2015), and in Chapter 6 in Section , which considers the MOEs for the horizon year (2035). Figure 6: Westbound SR 92 Express Lane Project Area (Figure 2-1 in the TOAR) 15
16 3.4.1 Existing Year (2012) VMT Forecasts The Alameda CTC Model was updated to 2012 conditions and was validated to a level well within the applicable model validation guidelines, so the base year model for the Project reflects year 2012 conditions. Existing year (2012) VMT forecasts are not provided in the SR 92 TOAR Opening Year (2015) VMT Forecasts The TOAR summarizes the VMT findings with other MOEs. The TOAR states that for the opening year (2015) westbound a.m. peak study period, vehicles served and VMT would realize a slight increase, less than 1 percent in the aggregate. The TOAR states that for the opening year (2015) westbound p.m. study period there is no change in VMT with the Express Lane when corridor congestion levels are minimal. The TOAR states that the Express Lane would not induce more traffic to use the corridor because the bridge s mainline metering lights would constrain the vehicle throughput crossing the bridge to 5,550 vehicles per hour whether or not the Express Lane is provided. [Opening year (2015) VMT forecasts are shown with other MOEs in Appendix C; Table 5-2] Horizon Year (2035) VMT Forecasts The TOAR states that for the horizon year (2035) westbound a.m. peak study period, vehicles served and VMT would realize a slight increase, less than 1 percent in the aggregate. The TOAR states that for the horizon year (2035) westbound p.m. study period there is no change in VMT with the Express Lane when corridor congestion levels are minimal. The TOAR states that the Express Lane would not induce more traffic to use the corridor because the bridge s mainline metering lights would constrain the vehicle throughput crossing the bridge to 5,550 vehicles per hour whether or not the Express Lane is provided. [Horizon year (2035) VMT forecasts are shown with other MOEs in Appendix C; Table 6-2]. 16
17 Section 4: Use of Express Lanes by Low-Income Populations This section summarizes information on the use of the Project by low-income populations as reported in the Interstate 880, State Route 92 and State Route 84 Regional Express Lane Project: Environmental Justice Technical Memorandum (April 2015). In accordance with Federal guidance, the purpose of the Environmental Justice (EJ) Technical Memorandum is to identify and assess the project effects that could disproportionately and adversely affect minority or low-income populations 7. Benefits of the Project and the public engagement activities are also discussed in the EJ Technical Memorandum. The EJ Technical Memorandum addresses use of the express lanes by low-income populations to the degree it informs the main purpose of identifying disproportionate and adverse effects on minority or low-income populations. The following aspects of the analysis include information that addresses use of the Project by low-income populations: Summary of the current travel patterns of low-income populations in the study area. (Chapter 5: Transportation Travel Patterns) Analysis of the project effects, which discusses potential future use of the Project by low-income populations, considering current travel patterns, express lane design and operations, benefits of express lanes, and willingness and ability to pay to use the lanes. (Chapter 6: Project Effects) 4.1 Methodology Identification of Low-Income Populations Three study areas are defined and considered in the EJ Technical Memorandum for the Project: Direct Impact Area: This is defined as the area in close proximity to the proposed Project, and consequently includes the population most likely to experience the potential impacts of the physical improvements associated with the Project. The Direct Impact Area included all census tracts within onequarter mile of the Project (Figure 7). Extended Resource Area: The Extended Resource Area is included to consider the potential impacts to the likely users of the Project. While it cannot be determined exactly who will be using the express lanes and from where they will be traveling, for the purposes of the analysis, based on existing trip patterns, 7 The EJ Technical Memo states that the Federal Highway Administration (FHWA) requires that environmental justice be considered throughout the transportation decision-making process. A Presidential Order (EO) was created and contains the three major principles of environmental justice: Avoid, minimize, or mitigate disproportionately high and adverse human health and environmental effects, including social and economic effects, on minority and low-income populations; Ensure the full and fair participation by all potentially affected communities in the transportation decision-making process; and, Prevent the denial of, reduction in, or significant delay in the receipt of benefits by minority and low-income populations. In response to EO 12898, the U.S. Department of Transportation (USDOT) issued Order , Order to Address Environmental Justice in Minority Populations and Low-Income Populations. This order requires agencies to accomplish the following: 1. Explicitly consider human health and environmental effects related to transportation project that may have a disproportionately high and adverse effect on minority or low-income populations; and, 2. Implement procedures to provide meaningful opportunities for public involvement by members of those populations during project planning and development. 17

18 all of Alameda County, all census tracts in Contra Costa County that extent within 10 miles of the Project, all census tracts in Santa Clara County that extend within 10 miles of the southern terminus of the Project, and all census tracts that extend within 10 miles of the San Mateo-Hayward and Dumbarton Bridges on the western edge of the San Francisco Bay are included in the Extended Resource Area (Figure 7). Region of Comparison: The EJ Technical Memorandum states that a Region of Comparison is necessary in order to determine if Project-related adverse impacts are disproportionate in comparison to the greater area. The Region of Comparison is comprised of the following counties in their entirety, due to their proximity to the Project: Alameda, Contra Costa, San Mateo and Santa Clara. Figure 7: Direct Impact Area and Extended Resource Area (Figure 4-1 in the EJ Technical Memorandum) The EJ Technical Memorandum states that for environmental justice evaluations of its long-range plans, MTC identified concentrations of low-income persons where 30 percent or more of individuals within a geographic unit are below 200 percent of the federal poverty level. MTC uses 200 percent of the poverty level to account for the region s high cost of living relative to the nationwide federal standard. MTC confirmed the appropriateness of using this definition for analysis of express lanes by reviewing 18
19 travel patterns in the MTC regional travel demand model (Travel Model One) and population and income data from the American Community Survey for Alameda, Contra Costa and Solano counties. The EJ Technical Memorandum states that in the Direct Impact Area, 26 percent of the population is below 200 percent of the poverty level; however, the percentages of low-income populations vary considerably among the census tracts in the Direct Impact Area. As a whole, the percentage of the population within the Direct Impact Area below 200 percent of the poverty level is under the MTC threshold of 30 percent. In the Extended Resource Area, 24.3 percent of the population is below 200 percent of the poverty level. The percentages of individuals in the portions of the four counties that comprise the Extended Resource Area are also each below the 30 percent threshold. The percentages of individuals below 200 percent of the poverty level in each individual county comprising the Region of Comparison area all below 30 percent. The EJ Technical Memorandum states that the Extended Resource Area and the Region of Comparison have lower percentages of low-income populations than the Direct Impact Area. Of the 71 census tracts in the Direct Impact Area, 24 have a low-income population over 30 percent and 34 have a low-income population greater than the Region of Comparison (Figure 8). 19

20 Figure 8: Low-Income Populations Greater than the Region of Comparison (Figure 4-3 in the EJ Technical Memorandum) Data Sources Discussion of the use of express lanes by low-income populations in the EJ Technical Memorandum is informed primarily by the following data sources: Data from the U.S Census Bureau s American Community Survey, 5-year Estimate ( ) on population and commute travel characteristics. This data is used to identify areas with concentrations of low-income populations, and to understand how low-income populations travel today. Results from outreach and engagement directed at low-income and minority populations using focus group and intercept surveys in multiple express lanes corridors, including I-880/SR 84/SR 92 Corridor (described below). Data available on use of express lanes in operation throughout the United States. The EJ Technical Memorandum includes a summary of MTC s outreach and engagement efforts throughout Alameda, Contra Costa, and Solano Counties for the overall Regional Express Lane Network, including the I-880/SR 84/SR 92 corridor. The data gathered from communities with high concentrations 20
21 of minority and low-income populations ( EJ communities ) included: current travel patterns, perceptions about express lanes, ability and willingness to pay to use express lanes, and any potential barriers to using express lanes. The outreach effort included the collection of quantitative data through intercept surveys and qualitative or subjective data through focus group meetings. A total of 132 surveys were conducted at six locations typically frequented by a large and diverse number of people from November 10, 2012 to December 1, The locations were: Vallejo Farmers Market, Laney College Flea Market, Coliseum Flea Market, Solano Swap Meet, 99 Ranch Market, and Grocery Outlet in Solano County. Six focus groups were conducted between November 5, 2012 and December 7, 2012 at various community-based organizations (CBOs) in Alameda, Contra Costa and Solano Counties. Seventy-five people participated in the focus groups. Seventy-one percent of the focus group participants provided income information, and 44 percent of the participants reported that their income is below 200 percent of the poverty level, qualifying them as low-income, based on the definition used in the EJ Technical Memorandum. Eighty-two percent of the intercept survey participants provided income information, and 40 percent of the participants reported their income is below 200 percent of the poverty level. 4.2 Analysis Results The transportation impacts, economic impacts and benefits of the Project to EJ communities is reported in Chapter 6 of the EJ Technical Memorandum. The EJ Technical Memorandum concludes that the Project will not result in disproportionate adverse transportation or economic impacts; and will provide a benefit by providing a choice to low-income populations Summary Transportation Impacts: The EJ Technical Memorandum concludes that operation of the Project and the options it provides to drivers along the Project will improve transportation operations along the corridors by maximizing the capacity of the system by making carpool lanes available to solo drivers for a fee. Those opting to pay the fee to use the carpool lane will experience less congestion and a decrease in travel time compared to travelers in general purpose lanes. The Project will improve travel speeds for carpools in the HOV/express lanes as well as vehicles in the general purpose lanes. The incorporation of restricted access buffers in a few locations along I-880 will preclude some drivers with shorter trips from using the express lanes depending on their travel plans and desired freeway exit; however, the buffers will reduce the existing friction that now occurs, due to drivers changing lanes between the HOV and general purpose lanes, and improve the effective capacity and operation of the express lane. These benefits of the Project are available to all users; however, EJ populations may have greater benefit at times when their travel is very time-sensitive and the low fee to reach their destination sooner will ultimately be less than the cost of lost wages or late fees at a childcare center. Economic Impacts: The EJ Technical Memorandum states that the Project will have an economic effect on solo drivers who choose to pay a toll to use the facility as well as on HOV users who will need to establish a FasTrak account and obtain a toll tag to use the Express Lanes. To take advantage of the 21
22 transportation benefits provided by the Project, a user must incur a fee. The data and analysis reveal that most people understand this benefit; however, the financial hardship associated with obtaining a toll tag and paying the fee to access the express lane is dependent on income levels. In the San Francisco Bay Area, the FasTrak system is administered by the Bay Area Toll Authority (BATA) in cooperation with the Golden Gate Bridge Highway and Transit District. Together, these agencies set the policies and procedures for establishing and maintaining a FasTrak account. Similar to other agencies which have implemented express lanes across the country, BATA has an extensive program in place to allow customers to obtain a toll tag and pay the fees in several ways. Lower-income drivers who may lack a credit card or bank account would still have alternative means of obtaining a toll tag and paying fees to access the express lanes. MTC s surveys and focus groups found most people of all income levels would be willing to pay a small fee to use the lane; however, lower-income drivers would be less likely than higher-income drivers to pay a fee higher than $2.00. For lower-income drivers who set up a toll account and choose to use the express lanes, even only in emergencies, the fee is balanced with the potential larger cost of being late. Benefits: The EJ Technical Memorandum states that the Project results in a number of benefits to lowincome drivers using the I-880/SR 84/SR 92 corridor, as well as some potential economic impacts to lower-income drivers who may experience a financial hardship in obtaining a toll tag or using express lanes. Since the Project will provide a choice for solo drivers to access the express lanes for a fee and carpoolers will still be able to use it for free, lower-income drivers who use the facility will experience benefits that will likely outweigh the cost. The EJ Technical Memorandum concludes that the Project will not result in disproportionate adverse transportation or economic impacts to low-income populations Current Travel Patterns Commuting Patterns The EJ Technical Memorandum states that within the census tracts of Alameda, Contra Costa, Santa Clara, and San Mateo Counties that comprise the Extended Resource Area, the majority of workers age 16 and older are employed within their county of residence; however, there is a large number of workers who commute to other counties. Low-income workers tend to work in their own county. There are slightly higher percentages of lower-income workers in the census tracts of the four counties that comprise the Extended Resource Area that are employed within their own county than for the population in general. For those who are accessing jobs in the nine-county Bay Area region, particularly Alameda County, I-880 is a common corridor for travel from points north, south and east. Table 4 shows the modes of transportation for commuters who are above and below 150 percent of the poverty level within the Extended Resource Area. Carpooling and transit are more common for those below 150 percent of the poverty level. Along the I-880/SR 84/SR 92 Corridor, these lower-income carpoolers are likely using the HOV lanes on I

23 Table 4: Modes of Transportation and Low-income Status-Extended Resource Area 8 (Table 5-6 from the EJ Technical Memorandum) Travel Characteristics of Focus Group and Intercept Survey Participants The EJ Technical Memorandum states that all intercept survey respondents indicated that they travel regularly on freeways and bridges in the project area. Most respondents regularly drive alone, regardless of which freeways they use. Intercept survey respondents and focus group participants reported adjusting their driving behaviors to avoid using freeways during peak hours, including changing work schedules and departure times. Focus group and intercept survey results show that carpooling is a relatively popular mode of travel for about one-third of respondents and transit is less common. Respondents reported that the majority of regular trips are long trips (a trip over five miles). Focus group participants also reported that although they do carpool, there are potential barriers to carpooling on a consistent basis. Participants stated that getting three people for a carpool is difficult and the HOV lane is not always faster and is often as congested as other lanes. Other participants expressed frustration with underutilized carpool lanes, admitting that they use carpool lanes as solo drivers. Other Research on Travel Behavior The EJ Technical Memorandum states that additional data on low-income use of HOV lanes are limited. The EJ Technical Memorandum cites data from the National Household Travel Survey (NHTS)/Nationwide Personal Transportation Survey (NPTS) that shows that low-income populations take 8 For the poverty status analysis, a threshold of 150 percent below the poverty level was used to identify low-income populations since data for 200 percent below poverty level was unavailable for this analysis. 23
24 fewer trips, travel fewer vehicle miles, travel to work within their county of residence at a proportionately higher rate, and also carpool at a higher rate than non-low-income populations. The EJ Technical Memorandum also notes a study from Los Angeles, showing low-income drivers used HOV lanes at a higher rate than general purpose lanes on the I-10 and I-110 freeways. These results are in line with the higher carpooling rates for low-income travelers in the Extended Resource Area from the U.S. Census data Project Effects: Future Use Travel within the I-880/SR 84/SR 92 Corridor The EJ Technical Memorandum states low-income populations who cannot use the express lane will not have any change in their travel; however, there is the potential for congestion in the general purpose lanes to improve as traffic shifts to the extra capacity in the express lane. The EJ Technical Memorandum states that with the implementation of the Project, the travel time of an express lane user will be lower than that of a general purpose lane user. Moreover, the Project would provide significant time savings, especially on SR 84 and SR 92. Experiences on Operational Express Lanes The EJ Technical Memorandum states that studies have been conducted following the construction and start of operation of express lanes. The studies indicate low-income drivers pay tolls to use express lanes, but they do not pay tolls as frequently as higher-income households. This shows that low-income drivers may find it worthwhile to pay the toll in some situations even though it may be a greater burden on their household budget than it would be for higher-income households. All income groups placed a value on the reliability and reduced travel time provided by express lanes. For lower-income groups, the value of travel time savings (VTTS) varied substantially depending on travel conditions and expected or unexpected trip urgency (Patil et al. 2011). The EJ Technical Memorandum notes that at times, calculated value of travel time savings for lower-income groups exceeded the value of ordinary trips for higher income groups, particularly due to fixed schedule constraints associated with lower-paying jobs. Ability to Obtain a Toll Tag In its consideration of the economic impacts of the Project on low-income populations, the EJ Technical Memorandum assesses the ability of low-income populations to obtain a toll tag. Express lane users need to have a toll tag to use the lane as a paying customer. In addition, carpoolers will need to have a switchable toll tag to access the express lane without incurring a fee. The EJ Technical Memorandum reviewed express lanes nationally and found that, as in the Bay Area, there is commonly an up-front cost to acquire a toll tag, and most systems also require a pre-paid balance from which tolls are deducted. These requirements can make it difficult for low-income persons who do not have bank accounts, debit cards, or credits cards to purchase a toll tag and maintain an account balance. It was found that in 2009, in the San Francisco Metropolitan Statistical Area (MSA), 4.7 percent of households in the MSA are unbanked, or over 74,000 households. A similar study conducted in 2011 reported 5.9 percent of households were unbanked, totaling 108,000 (FDIC, 2012). 24
25 The EJ Technical Memorandum states that in the Bay Area, the FasTrak Regional Customer Service Center (RCSC) offers a variety of options, similar to other California toll operators. Customers can replenish their account with cash, check, money order or debit or credit cards. The RCSC and numerous retail locations such as Safeway, Costco or Walgreens include the option to purchase a toll tag for $25.00 which includes $5.00 for use to pay tolls and a deposit of $ Customers can check account balances, make a one-time toll payment, and pay a violation notice or an invoice at numerous Cash Payment Networks (CPN). Customers can establish anonymous accounts that do not require personal identification, and pay with cash or money order. If a motorist receives a first-time violation and sets up a new account within 30 days, the violation penalty of $25.00 is dismissed. The EJ Technical Memorandum states that the ability to obtain a toll tag was also explored in the focus group and intercept surveys. Focus group participants stated that their preference would be to use a debit or credit card, but that many do not have one. The majority (85 percent) expressed willingness to pre-pay the deposit although for 41 percent of these participants it would involve cutting other expenses. Fifty-four percent of intercept survey respondents reported being able to maintain the minimum balance on a FasTrak toll tag without cutting expenses when paying with a debit/credit card, while 23 percent made the same statement when using the cash/check option. These results indicate that those with access to debit/credit cards have a substantially higher ability to maintain a minimum balance on a FasTrak toll tag. Focus group participants who reported that they would use cash or a check to maintain a FasTrak toll tag balance also shared concerns about having money tied up in an account. Few participants reported that they currently use a FasTrak toll tag to pay bridge tolls. Those that do use a toll tag acknowledged the ease of using a FasTrak toll tag with a credit or debit card and stated that they would continue to use a FasTrak toll tag in the future to pay express lane fees. A majority of Intercept Survey respondents (65 percent) responded that a cash payment network - locations such as grocery, convenience, drug stores, gas stations, check cashers, and dollar stores equipped to replenish account balances - would increase the likelihood that they would obtain a FasTrak toll tag. Willingness to Pay Toll The EJ Technical Memorandum states that there are transportation benefits to low-income populations with the Project. The ability to reach a destination faster and spend less time in traffic could result in an economic benefit such as avoidance of financial penalties for being late or possibly reduction in expenditures on gasoline. The majority of focus group participants and intercept survey respondents expressed willingness to pay a moderate fee to use an express lane at least some of the time. When asked specifically about their ability to afford express lane usage fees, focus group participants and intercept survey respondents responses diverged. The majority of intercept survey respondents stated that they could afford to pay a fee to utilize express lanes without having to cut expenses. When asked about willingness to pay a fee to avoid congestion on freeways, 32 percent of the 129 intercept survey respondents replied that they are willing to pay money to be able to drive as a solo car in an express lane. An additional 30 percent responded that they were willing to pay at least sometimes. No respondents with incomes below 200 percent of the Federal Poverty Level were willing or very 25
26 willing to pay a congestion pricing fee of $6.00; however, they were willing to use the lane for free as a bus rider or carpooler. Focus group participants indicated that they would not be able to afford to use express lanes regularly, citing the unpredictability of cost and their limited budgets as primary concerns. Focus group participants across geographic locations indicated that a $2.00 fee to use an express lane is the maximum fee they could afford, and for some, even that would require cutting other expenses. Sixty-two percent of low-income Intercept Survey respondents indicated that they would be willing to pay a $2.00 toll to access the express lanes, and 55 percent of the respondents indicated that they would be unwilling to pay a toll of $4.00 or more to access the express lanes Conclusion The EJ Technical Memorandum concludes that the Project results in a number of benefits to low-income drivers using the I-880/SR 84/SR 92 corridor, as well as some potential economic impacts to lowerincome drivers who may experience a financial hardship in obtaining a toll tag or using express lanes. Since the Project will provide a choice for solo drivers to access the express lanes for a fee and carpoolers will still be able to use it for free, lower-income drivers who use the facility will experience benefits that will likely outweigh the cost. The EJ Technical Memorandum states that the Project will not result in disproportionate adverse economic impacts to low-income populations. 26


27 Appendix A: Measures of Effectiveness from the I-880 TOAR 27
28 28
29 29
30 30
31 31
32 32


33 Appendix B: Measures of Effectiveness from the SR 84 TOAR 33


34 Appendix C: Measures of Effectiveness from the SR 92 TOAR 34