Integrated health impact assessment of transport policies
|
|
|
- Shona Harrell
- 5 years ago
- Views:
Transcription
1 Integrated health impact assessment of transport policies J. Theloke, U. Kugler, C. Schieberle, T. Kampffmeyer, J. Roos, A. Kuhn, S. Torras Ortiz, R. Friedrich Presentation on the Air Quality Conference in Athens 21. March 2012
2 Introduction The most important environmental health risks in Europe are caused by exposure to fine particles (PM10, PM2.5, EC, OC, PNC) Current PM10 and PM2.5 concentrations result in an average reduction of life expectation of the European population of a few (ca. 3 to 5) months. The PM10 thresholds are frequently exceeded. Thus a further reduction of the fine particle concentration is necessary. This should be done with efficient measures, i.e. measures with the lowest costs per unit of health risk reduced (e.g. expressed in DALYs disability adjusted life years). The aim of TRANSPHORM is to identify and assess European transport policies to reduce health risks on different scales.
3 Approach Development of mitigation and policy options for reducing transport related particle emissions Distinction between urban and European scale related measures Developing and applying methodologies for assess these options Compile a reference scenario for future years Apply the full chain approach Ranking the options for identifying the most cost efficient options (Health Impacts avoidance costs) [Euro 2010 ]) - ((Measure costs +Utility Losses) [Euro 2010 ])
4 Reference Scenario (2005, 2020, 2030) For non transport related sectors we apply the MEGAPOLI scenario (based on TIMES Modelling) For the transport sector (road transport, aviation, navigation and railways) has been generated activity data sets from TREMOVE (based on PRIMES Energy modelling) (TML, Griet de Ceuster) The Emission factors have been generated in the TRANSPHORM project by LAT (Zissis Samaras), DLR (Andreas Petzold) and IVL (Jana Moldonova) The emissions have been calculated by IER (incl. Spatial resolution for EU27) The spatially resolved data set for EU27 has been integrated in the TNO grid by TNO
5 Elementar Carbon (EC)Emissions in EU27+NO+CH

6 PM2.5-Emissions in Europe (EU27 + NO + CH)
7 Total Particle Number (PN) Emissions in Europe (EU27+NO+CH)
8 Urban related measures Enhanced use of bicycles in cities Traffic management (Green Wave, improved operation of signalized intersections Low emissions zones Ban of through-traffic of heavy trucks Increase in the cost of motoring (City toll) Increase in the cost of motoring (Parking management) Freight Consolidation Centre Bus fleet with alternative engines (fuel cells, electric engines) Freight transport in pipelines (CargoCap) E-Logistics for commercial vehicles in cities E and I city transport concept
9 Measures with impact to the whole EU Enhanced use of public traffic Speed limit (motorways) Speed limit (rural) Car pooling (Promotion of low emission vehicles (E-cars)) Enhanced use of biofuels Increase in the cost of motoring (Road pricing) Increase in the cost of motoring (Fuel taxes) Further emission limits (EURO 7/8) Abrasion and noise optimised road surfaces and vehicle parts Teleconferencing (ICT); Teleworking; Teleshopping Enhanced use of public traffic
10 Measures related to other traffic modes Differentiation of track access charges for rail transport Further development of emission limits in inland waterway transport Kerosene Tax for aviation Low emission zones for construction equipment Shift from aviation to railway Electric operations in harbours DPF for navigation Low NO x -zones for shipping Differentiation of track access charges for rail transport Further development of emission limits in inland waterway transport Kerosene tax for aviation
11 Matrix for categorizing road transport measures No Measure Rel. for city t/n Spatial scale Time scale Vehicle category EF aff. Stock aff. Traffic volume 1 Enhanced use of bicycles in cities x n urban 2020 PC/MC x x x Modal shift Pollutants AP GHG noise 2 Enhanced use of public traffic x n urban 2020 PC/MC x x x AP GHG 3 Speed limit (motorways) 4 Speed limit (rural) n motor-way 2020 All x GHG (AP) n motorway 2020 All x GHG (AP) 5 Car pooling (Ecars, hybrid vehicles)) x t urban rural 2030 PC x x x AP GHG 6 Traffic management 8 Low emission zones x t urban 2030 All x AP GHG x n urban 2020 All x x x AP GHG


12 Measure based scenario for road transport


13 Measure based scenario for road transport
14 Analysis of policies and measures Traffic management RT 4 Description The aim of this measure is to smooth the traffic flow by avoiding multiple braking and acceleration. This can be done by e.g. optimising and coordinating the traffic light control in an urban area. Abatement potential In a research project in the German city of Ingolstadt, the control of traffic lights was optimised so that a smoother traffic flow was reached. From data on reduced waiting times and reduced number of stops necessary, GEVAS (2008) assumed a 19% reduction in fuel consumption. It is assumed that the degree of implementation will be relatively low (20%) as this measure involves high costs. Implementation Possible to implement: 2030 Costs Costs involve the installation of a traffic management system and personnel costs. The city of Ingolstadt estimates costs of 350,000 for the installation of a traffic management system (Ingolstadt 2008). Further costs for operation, maintenance and human resources are not stated. It is assumed that at minimum one extra personnel of 50,000 per year is needed. On the other hand, there are fuel cost savings due to the improved traffic flow. Synergies/interactions with other environmental objectives (eg climate change) + Reduction of fuel consumption + Reduction of waiting times


15 Methodology and tool for impact assessment The Full Chain Approach
16 Ecosense Approach Estimate the damages to human health caused by the emissions of the city by using the results of the atmospheric modelling and exposure modelling and applying concentration- response as well as exposure-response relationships; Aggregate the different health endpoints into DALY (disability adjusted life years) or QUALY (quality adjusted life years); Convert the aggregated endpoints and the impacts on climate change into a common monetary unit to allow comparisons and cost-benefit analyses. Result: Ranking of single measures based on specific cost efficiency


17 Ecosense Approach Base- Scenario Case- Scenario SR-Matrices Concentrations Emission Delta

18 Pollutant Concentration in µg/m 3 The typically higher pollutant levels in urban areas for most pollutants can be referred as urban increment, i.e., the difference between regional and urban background pollutant concentrations Urban background Rural background
19 where C i urban i C i urban = Urban increment of pollutant i. i A E UE iue u avg E iue = Total emission of pollutant i within the urban entity in tons. A UE = Urban entity area in km 2. Urban increment A model to estimate the urban increment (i.e., the difference between regional and urban background pollutant concentrations) was included in the analysis within MEGAPOLI. The modelling approach is based on a multiple regression analysis with the following components: u avg = Urban entity average wind speed in m/s. C i rural = Rural background concentration of pollutant i in µg/m 3 ω i, φ i, and γ i = Multiple-regression parameters for pollutant i. C i rural Torras Ortiz, S. (2010). "A hybrid dispersion modelling approach for quantifying and assessing air quality in Germany with focus on urban background and kerbside concentrations," submitted Doctoral Thesis, University of Stuttgart, Stuttgart.

20 Exposure modelling


21 Exposure modelling- Outdoor


22 2 ) indoor m-environments Exposure modelling- indoor


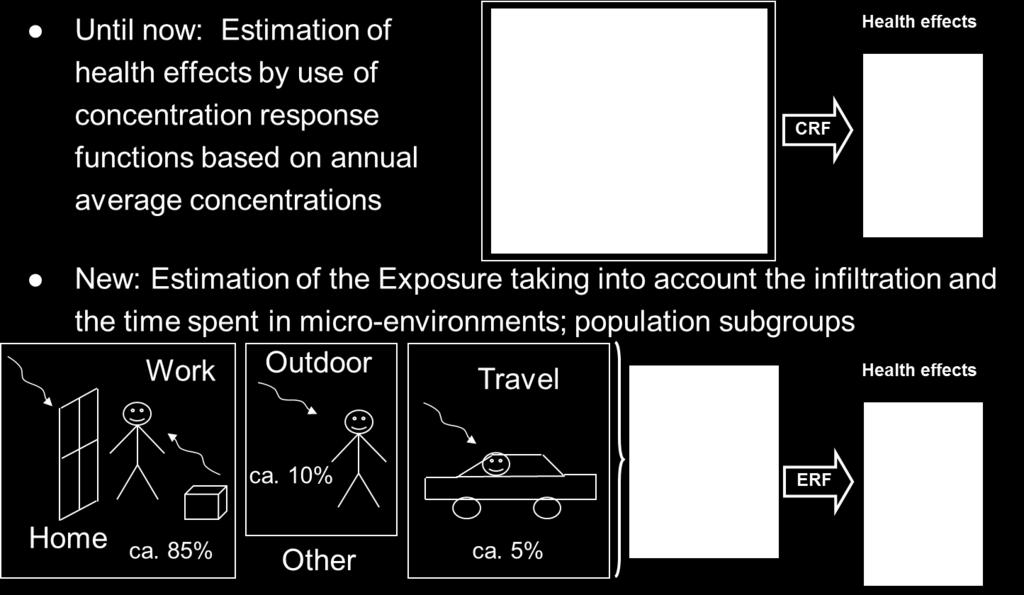
23 Exposure modelling- personal exposure
24 Conclusion An integrated health impact assessment approach for transport policies will be developed in the TRANSPHORM project A full chain approach will be applied (incl. urban increment and exposure modelling) 33 transport related policy options have been identified and will be analysed in the TRANSPHORM project according to their efficiency (costs versus benefits (avoided monetarized human health impacts)) and effectiveness (costs versus avoided DALYs). Other effects e.g. change of noise levels, congestion/time losses and gains and change of number of accidents will be also considered.
25 Thank you for your attention And many thanks for the good cooperation in TRANSPHORM to my colleagues: Christian Schieberle, Ulrike Kugler, Melinda Uzbasich, Sona Orlikova, Markus Blesl, Hugo Denier van der Gon, Antoon Vischedijk, Jeroen Kuenen, Dick van den Hout, Zissis Samaras, Jana Moldonova, Andreas Petzold, Griet de Ceusters and others from the TRANSPHORM team