Energy efficiency networks do they work? Evidence from German plant-level data. Jan Stede EAERE-ETH Winter School,
|
|
|
- Mervin Chambers
- 5 years ago
- Views:
Transcription
1 Energy efficiency networks do they work? Evidence from German plant-level data Jan Stede EAERE-ETH Winter School,
 from 2009-2014 (voluntary); currently >1,200 companies")
 How does participating in an energy efficiency network impact a company s energy efficiency and CO 2")
2 1 Research question Regular, moderated meetings of companies For firms with energy costs > 500,000/a Introductory phase: 30 regional networks (360 companies) from (voluntary); currently >1,200 companies Previous evaluations: Participants improve energy efficiency at double the industry average (e.g. Rohde et al. 2015) How does participating in an energy efficiency network impact a company s energy efficiency and CO 2 emissions? 2

3 1 Research question Statistically significant difference of 5.5 percentage points in the network period but is this causal? 3 Source: FDZ der Statistischen Ämter des Bundes und der Länder, AFiD-Panel Industriebetriebe and AFiD-Modul Energieverwendung, , own calculations.
 Source: Adapted from Köwener et al.")
4 1 How do energy efficiency networks work? (I) Source: Adapted from Köwener et al. (2014) 4
5 1 How do energy efficiency networks work? (II) 1. Reducing transaction costs by sharing experiences (Jochem et al. 2010, Köwener et al. 2011) Importance of trust 2. Reducing information deficits (Dütschke et al. 2018, Jochem and Gruber 2007, Paramonova et al. 2014) Avoid risks and hidden costs 3. Overcoming the little priority given to energy efficiency investments (Köwener et al. 2014, Dütschke et al. 2018) Agenda-setting, motivation, positive peer pressure Focus typically on cross-cutting technologies 5
6 2 Empirical strategy to identify average treatment effect of the treated (ATET) Problem: Self-selection Two identification strategies 1) Difference-in-differences (DiD) estimation Control group: Companies joining networks that started after the treatment period ( exploit difference in timing of the treatment) Main assumption: common trends Treatment group Control group Start of first networks 500 networks initiative
7 2 DiD models (1) Baseline model Treatment dummy Industry fixed effects log y it = β 0 + β 1 Network i + δ Treat it + τ t + γ s + φ st + ε it, E.g. log energy productivity Year fixed effects Industry-year interaction (2) Baseline model with controls (3) Plant-level fixed effects model Controls log y it = δ Treat it + μ i + τ t + φ st + Χ it Ψ + ε it, Plant-level fixed effect 7
8 2 Data and sample AFiD panel of manufacturing production sites, All German manufacturing firms with >20 employees Treatment group: 30 networks, 292 manufacturing firms Control group: 122 networks, 921 manufacturing firms Matched 90% of treatment group, 50% of control group N=709 (259 treated and 450 control firms) Different start years of the networks Start year of the network No. of networks No. of companies in networks
9 3 9 Share of sectors [in %] Economic sector (WZ 2008 classification) Pilot networks Control group Manufacturing sector 5 Mining of coal and lignite Other mining and quarrying Manufacture of food products Manufacture of beverages Manufacture of tobacco products Manufacture of textiles Manufacture of wood [ ] Manufacture of paper and paper products Printing and reproduction of recorded media Manufacture of coke [ ] Manufacture of chemicals basic pharmaceutical products [ ] rubber and plastic products other non-metallic mineral products basic metals fabricated metal products [ ] computer, electronic and optical products electrical equipment machinery and equipment n.e.c motor vehicles, trailers and semi-trailers other transport equipment furniture Other manufacturing Repair and installation of machinery
10 3 Distribution of key variables Variable Median Lower Upper Mean (s.d.) quartile quartile Annual energy consumption [MWh] - Pilot networks 18,716 5,979 50,886 66,237 (158,143) - Control group 13,461 3,868 47,231 75,953 (217,588) - Manufacturing sector ,855 13,367 (92,276) Energy productivity [ /kwh] - Pilot networks (6.58) - Control group (7.85) - Manufacturing sector (62.98) Energy consumption : Much higher for treatment and control than for average industrial firm Energy productivity: Treatment and control well aligned 10 Source: FDZ der Statistischen Ämter des Bundes und der Länder, AFiD-Panel Industriebetriebe and AFiD-Modul Energieverwendung, , own calculations.
11 3 Distribution of key variables Variable Median Lower Upper Mean (s.d.) quartile quartile Annual turnover [million ] - Pilot networks (476.8) - Control group (605.1) - Manufacturing sector (359.6) Number of employees - Pilot networks 3,614 1,576 6,807 7,270 (13,154) - Control group 2,616 1,166 5,418 5,010 (10,829) - Manufacturing sector ,323 1,557 (6,145) Much larger installations in networks than the average manufacturing firm, both in terms of turnover and # of employees 11 Source: FDZ der Statistischen Ämter des Bundes und der Länder, AFiD-Panel Industriebetriebe and AFiD-Modul Energieverwendung, , own calculations.

12 4.1 Energy productivity for treated and control companies 12
13 4.1 Diff-in-Diff: Estimation results for energy efficiency Standard errors are clustered at the network level. Additional control variables include sales intensity (turnover divided by the number of employees), the export share, the share of own electricity production of total consumption, a dummy for investment into environmental protection, as well as a dummy for the basic materials sector. 13

14 4.1 Log CO2 emissions for treated and control companies 14
15 4.1 Estimation results for CO2 emissions Standard errors are clustered at the network level. Additional control variables include sales intensity (turnover divided by the number of employees), the export share, the share of own electricity production of total consumption, a dummy for investment into environmental protection, as well as a dummy for the basic materials sector. 15
16 4.2 Matching estimator Problem: Self-selection Two identification strategies 2) Conditional DiD Matching estimator (Heckman et al. 1997, 1998b, 1998a) Motivation: Differences in observables such as energy consumption remain for DiD treatment and control group 16 Main assumption: common trends conditional on observables Notes: i: treatment group, k: control group, t: post-treatment, t : pre-treatment
17 4.2 Matching estimator NN(1) matching (robustness: NN(3) matching), using entire manufacturing sector Exact matching on two-digit industry classification level Additionally, matching on three continuous variables averages of energy consumption, energy productivity, and sales intensity Treatment effect for 2013, 2014 and joint 2013/2014 Different start years Use only companies where networks started between May 2009 and February 2011 (90% of treated) 17
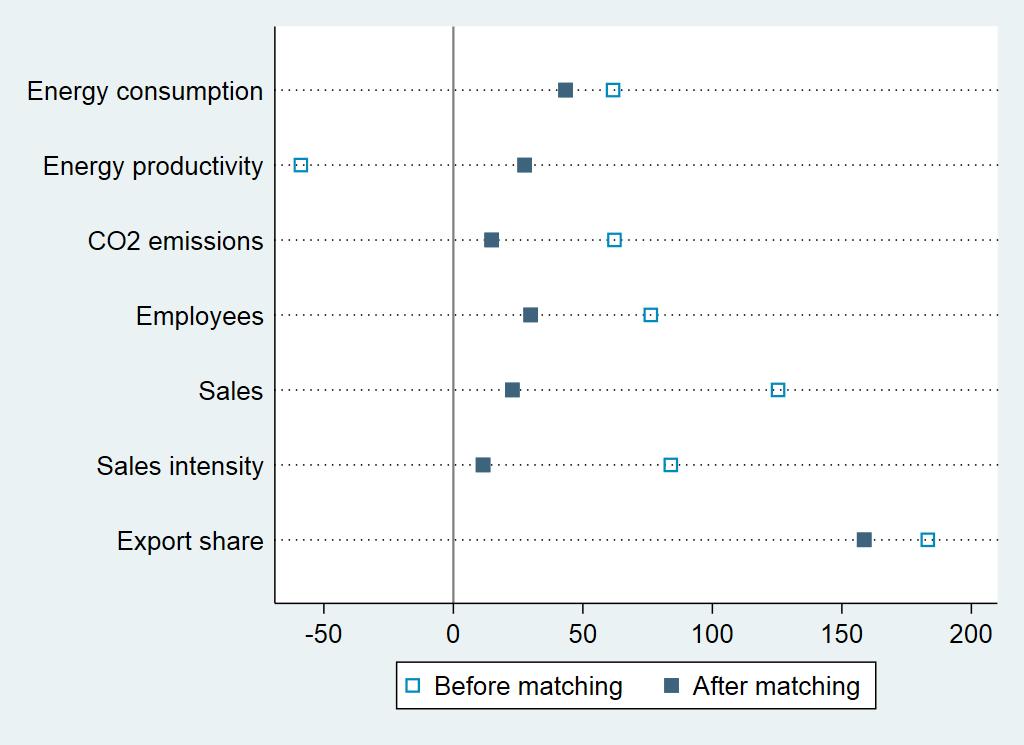
18 4.2 Standardised Bias 18


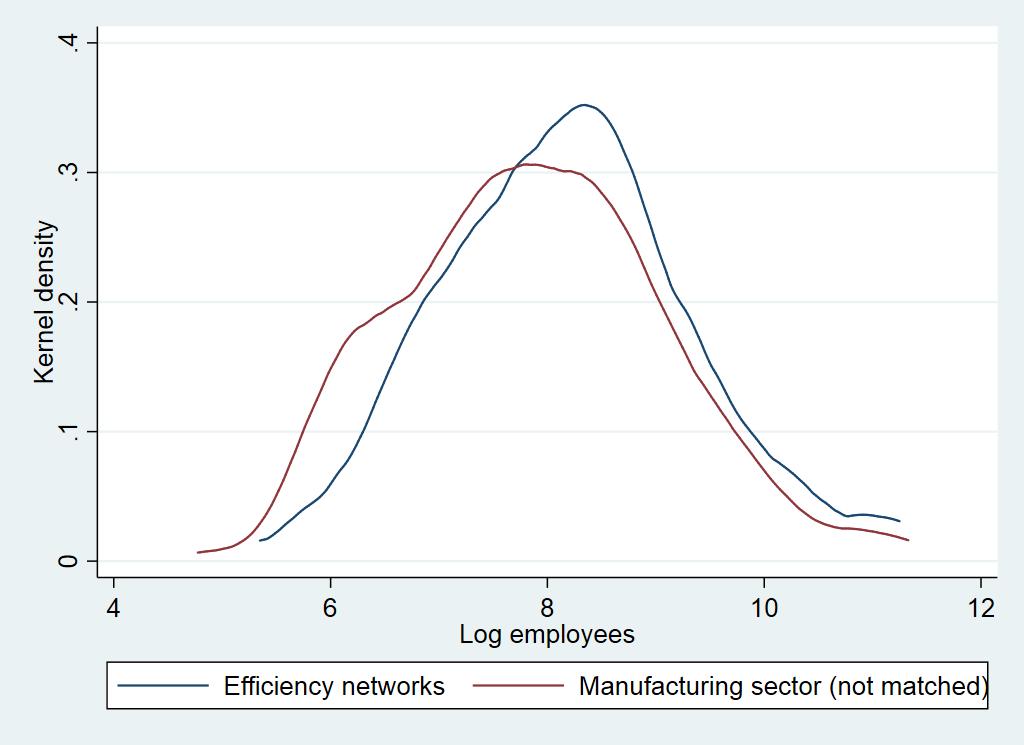
19 4.2 Kernel densities before and after matching 19

20 4.2 QQ plots (after matching) 20
21 4.2 Mean comparison of treatment and matched control Mean(Treat) Mean(Control) Difference Energy consumption [MWh] 71,470 86,787-15,317 Energy productivity [ /kwh] Annual turnover [million ] Number of employees T tests: Difference between treatment and matched control group mostly not significant But: Some difference in average energy consumption (not directly used in matching) remains 21
22 4.2 NN(1) matching estimator: ATET Energy productivity Log energy productivity CO2 emissions (0.299) (0.046) 235 (1210.9) (0.261) (0.045) (1249.2) Combined (0.2) (0.032) (854.3) Log CO2 emissions 0.049* (0.029) 0.108*** (0.034) 0.068*** (0.02) All estimated treatment effects are insignificant, except for log CO 2 emissions (not in expected direction) Results qualitatively the same with NN(3) matching 22

23 4.2 Common trends log CO2 emissions 23

24 5 Treatment effect heterogeneity 24
25 5 Good management within companies Theoretical and empirical literature establishing link between exporting and good management (Bloom & Van Reenen 2010, JEP; Helpman et al. 2004, AER; Sousa et al. 2008) Exporting German manufacturers more energy efficient (Lutz et al. 2017) High export share (>80%) as an indicator for good management leading to higher benefits from network participation 25
26 5 High exporters Variable Median Lower Upper Mean (s.d.) quartile quartile Export share [%] - Pilot networks (30.5) - Control group (29.3) - Manufacturing sector (25.8) 12% of treatment group export >80% 26
27 5 DiD results for high exporters 27
28 5 Matching estimator results for high exporters Energy productivity Log energy productivity (0.793) (0.161) ** (1.337) 0.289** (0.13) CO2 emissions (6997.7) Log CO2 emissions (0.093) (8250.7) (0.103) Large significant estimated 2013 treatment effects for energy productivity but common trends assumption questionable 28

29 5 Trends high exporters energy productivity 29

30 5 Trends high exporters log energy productivity 30
31 6 Overview of significant treatment effects DiD: All treated Matching estimator: All treated DiD: Exporters Matching estimator: Exporters Energy Log energy CO2 Log co2 productivity productivity emissions emissions Model (1) Model (2) + (**) (*) Model (3) (*) (***) Combined + (***) Model (1) (**) Model (2) (*) Model (3) (**) (**) + (**) 31 The table shows the direction and significance level of the average treatment effect on the treated
32 6 Conclusion Members of efficiency networks improve efficiency at more than five percentage points above industry levels during the networking period Statistically (and economically) significant treatment effect with the expected sign for log energy intensity and log CO 2 emissions in the DiD baseline model with covariates But result not robust no significance in the model with plant-level fixed effects Insignificant ATET in matching estimator Estimated CO 2 savings for the German 2020 climate targets questionable (if results hold for other networks) 32
33 Thank you for your attention. DIW Berlin Deutsches Institut für Wirtschaftsforschung e.v. Mohrenstraße 58, Berlin