Measurement of BTX Vapour Intrusion into an Experimental Building
|
|
|
- Caitlin Bates
- 5 years ago
- Views:
Transcription
1 Measurement of BTX Vapour Intrusion into an Experimental Building Ian Hers Golder Associates Ltd. / University of British Columbia August 15, 2000 Sponsored by: Alberta Environmental Protection (AEP) American Petroleum Institute (API) BC Environment (BCE) Canada Mortgage Housing Corporation (CMHC) Canadian Association Petroleum Producers (CAPP) Canadian Petroleum Products Institute (CPPI) Chatterton Petrochemical Corporation (CPC) Dow Chemical Golder Associates Ltd. Ontario Ministry of Environment (OME) 1
2 Presentation Outline Chatterton site research program overview Why measure VOC intrusion? Conceptual models Mathematical models Experimental methods Measured BTX flux and soil gas flow rates Model comparisons Conclusions and research needs 2
3 Research Objectives 1.Conduct field-based project at hydrocarbon (BTX) - contaminated site ( Chatterton research site). 2.Conduct integrated study addressing both vadose zone hydrocarbon transport and building intrusion. 3.Identify key processes & conditions affecting transport. 4.Incorporate results of other case studies including building science, radon & methane research. 5.Validate available screening level models, develop new (numerical) models. 6.Develop new or improved field methods. 7.Develop guidance or protocol addressing framework, model selection and use, and input parameters. 3
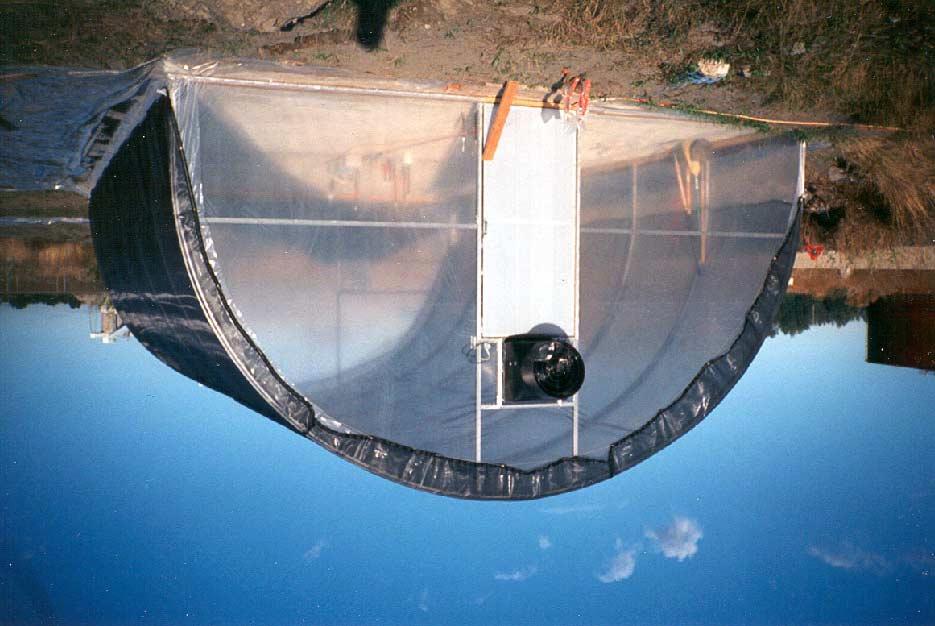
4 Project Scope 4 Comprehensive, multi-year program Construct new building (greenhouse) with controlled building properties, monitor old building Field program: 1. Baseline characterization, lab testing 2. Vadose zone monitoring 3. BTX intrusion measurements Model development (numerical model for transport & intrusion) Model validation Data Types chemical distribution chemical properties environmental/ meteorological soil properties building properties Measurement Techniques soil vapour profiling push-pull diffusion in-situ respiration soil-air permeability continuous P, O 2, T flux chamber tracer tests Data Quality & Quantity uncertainty/statistics analytical seasonal effects transient effects
5 Why Measure VOC Intrusion? Focus for this talk is building foundation and near-surface soils Our understanding of vapour migration through building foundations is poor (more emphasis has been placed on vadose zone transport) Evaluate importance of building depressurization and cracks Research may lead to practical techniques To validate models for this pathway, reduce uncertainty 5
6 Ian Hers Golder Associates / UBC 6
7 ADVECTION 7
8 Advective Processes Driving forces include: temperature difference (stack effect) - probably most significant unbalanced ventilation, heating systems wind, temperature (diurnal), barometric pressure Site-specific factors (construction, soil type, subsurface utilites) and relative permeability of soil and foundation are critical 8
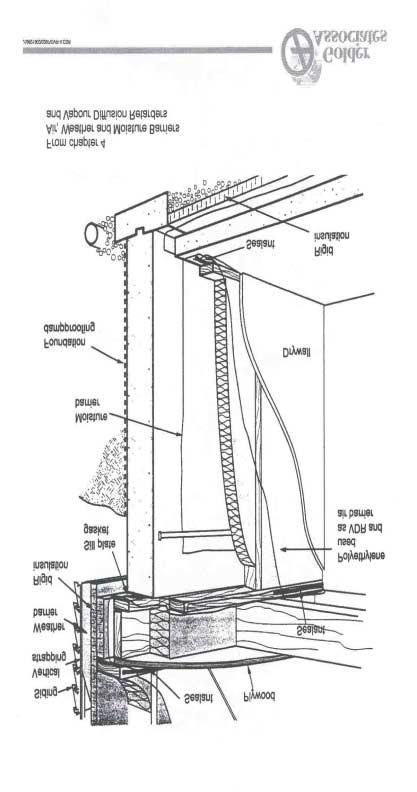
9 Mathematical Models for Soil Gas Advection through Building Foundation 1.Flow to Perimeter Crack Model (analytical sol n steadystate 2-D flow to horizontal drain) (Soil & Foundation) z crack Q = 2πk air Px crack /(µln(2z crack /r crack ) 2.Flow through Foundation Model (Hagan-Pouisselle relationship for laminar flow through parallel plates or tube (Just Foundation) Q = K b w δh /δl K = ρ air gb 2 / (12µ) 3. Numerical model - How to couple flow in soil with flow through small cracks? One possibility is to adapt MODFLOW (ASTM ) 9
10 10
11 Possible Approaches to Estimate VOC Vapour Intrusion 1. Measure VOC concentrations (indoor & outdoor air, groundwater &/or soil vapour, ventilation) vapour attenuation ratio (α) using mass balance approach: Background? VOC mass flux soil gas flow rate (assumes mass flux by advection) 2. Flux chamber measurements (cracks) VOC mass flux soil gas flow rate 3. Tracer test (inject SF 6, use radon) infer VOC flux and soil gas flow rate Sensitivity Scale Up? Boundary conditions? 11
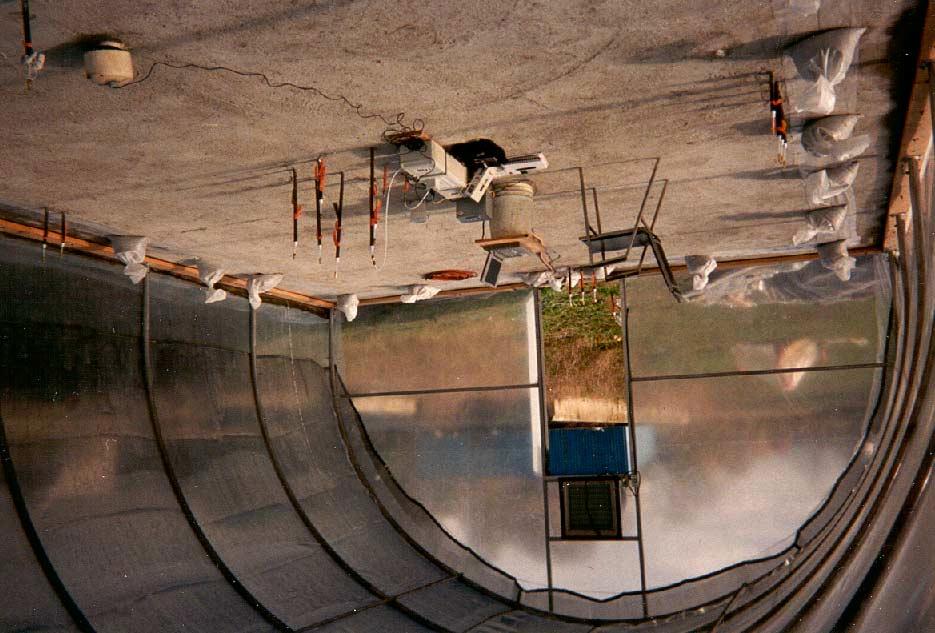
12 Experimental Methods Constructed building with controlled properties Used VOC measurements & flux chamber tests to estimate (i) vapour attenuation ratio, (ii) BTX flux into building & (iii) soil gas flow rate into building. Natural ( Diffusion ) Cases - η = , 2 tests Depressurized ( Advection ) Cases - Fan Induced i) 2.5 Pa, η= ii) 10 Pa, η= iii) 10 Pa, η= iv) 30 Pa, η= Extensive sub-slab monitoring BTX vapour, O 2, pressure, temperature 12

13 13
14 14
15 15
16 16
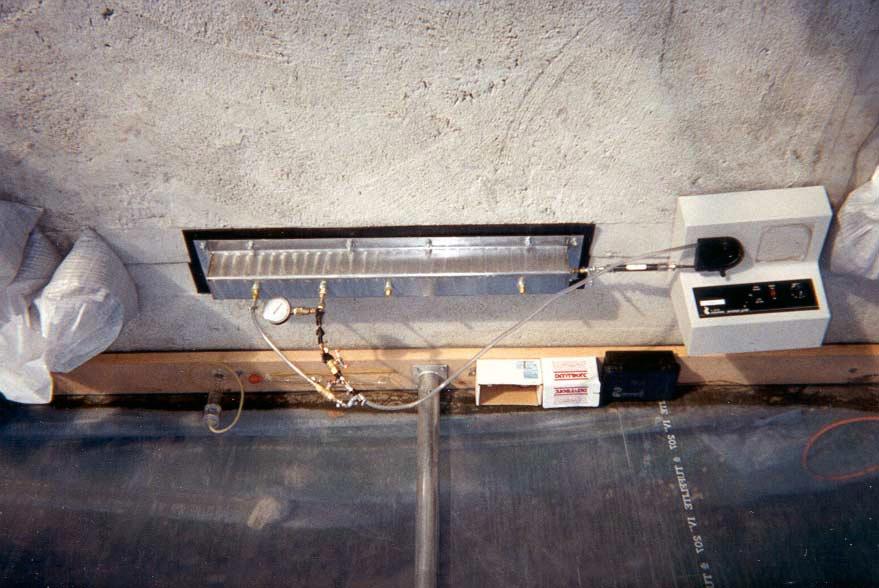
17 Flux Chamber Testing Protocol Test flux chamber blanks - a challenge! Depressurize greenhouse Purge 5 chamber volumes Adjust flux chamber flow rate to equalize pressure in building and chamber (developed Q vs. P curve for various leakage elements to assist in this) Edge Crack - Q on order of Pa (sample without replacement) Hairline Crack - Q on order of Pa (sample with replacement) Collect samples over several hours using sorbant tube (Supelco 300) 17
18 Flux Chamber Design Valve #4 18
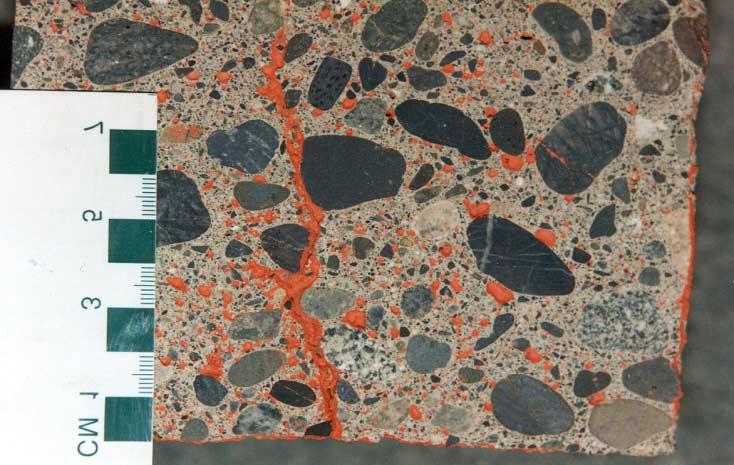
19 Soil Gas Flow Through Edge Crack 19
20 20
21 Soil Gas Flow Through Hairline Crack & Capped Drain Pipe 21
22 BTX Vapour Intrusion Measurement Results - Natural ( Diffusion ) Case no significant difference in indoor & outdoor BTX concentrations no measurable flux by flux chamber BTX vapour concentrations below slab stayed low, O 2 below slab remained elevated 22
23 Benzene Vapour Concentrations Below Centre Building - Natural Conditions Benzene Concentration (mg/l) DL=0.001 to mg/l,dl plotted if BDL Benzene Concentration (mg/l) DL=0.001 to mg/l, DL plotted if BDL Depth from Top of Slab (m) Sept 2/97 Oct 21/97 Nov 14/97 Mar 18/98 June 25/ BELOW BUILDING (SG-BC) Depth (m) SG-BC Mar 11/97 SG-BC May 13&14/97 SG-BC June 24/97 SG-BC July 2/97 SG-BC July 25/97 SG-BR Dec 1/97 SG-BR Mar 18/98 SG-BR Nov/98 SG-BR Feb 19/99 NATURAL SOIL COVER 23
24 Oxygen Concentrations Below Centre Building - Natural Conditions 0 O2 Concentration (%) O2 Concentration (%) Depth (m) Oct 3/97 Oct 17/97 Nov 19/97 Nov 19/97 June 24/98 June 24/98 Mar 9/ BELOW BUILDING (SG-BC) Depth (m) May 15/97 Sept 27/98 Sept 28/98 Nov 17/98 Nov 30&Dec 4/98 Mar 9/ NATURAL SOIL COVER (SG-BR) 24
25 BTX Vapour Intrusion Measurement Results - Depressurized ( Advection ) Case P = 10 & 30 Pa: Sub-slab BTX vapour levels increased, O 2 decreased Indoor BTX concentrations significantly higher than outdoor concentrations High BTX flux through cracks P = 2.5 Pa: increase in BTX vapour and decrease in O 2 only below centre of slab Indoor BTX concentrations only slightly higher outdoor concentrations Low BTX flux through cracks Chatterton site conditions conducive for advective transport of BTX into building (shallow contamination, permeable soil/slab, high P) 25
26 Effect of Depressurization on Soil Gas Benzene Profile - Dynamic Conditions Depth Below Top of Slab (m) Benzene Concentration (mg/l) Sept 2/97 Oct 21/97 Nov 14/97 Mar 18/98 June 25/98 Nov 28/97 Sept 2/98-30 Pa Depressurization -10 Pa Depressurization -2.5 Pa similar to 10 Pa case 26
27 Chatterton Benzene Vapour Concentrations Directly Below Slab Depressurized P=10 Pa, η= Edge Crack Vapour Probe Benzene Conc (ug/l) 27
28 Chatterton Benzene Vapour Concentrations Directly Below Slab Depressurized P=2.5 Pa, η= Edge Crack Vapour Probe Benzene Conc (ug/l) 28
29 29
30 Benzene Flux Through Cracks Measured Using Flux Chamber Average Flux Chamber Flow Rate (ml/min) Average Benzene Flux (mg/min-pa-m) Edge Crack (~2mm) Hairline Crack
31 Soil Gas Flow into Building Measured soil gas flow rates: mass balance approach: ~ 2.7 to 4.2 L/min flux chamber: on order of 2 to 4 L/min Predicted soil gas flow rates: flow to perimeter crack model: 8.2 (10 Pa) to 29 L/min (30 Pa) MODFLOW simulations: 4 to 5 L/min (10 Pa) soil permeability most important over 90 % through open portion of 2 mm edge crack remainder through hairline cracks 31

32 MODFLOW DOMAIN Silt & sand Impermeable boundary Slab New sand k=25 darcy Old sand k = 10 darcy Crack k=1 darcy 32

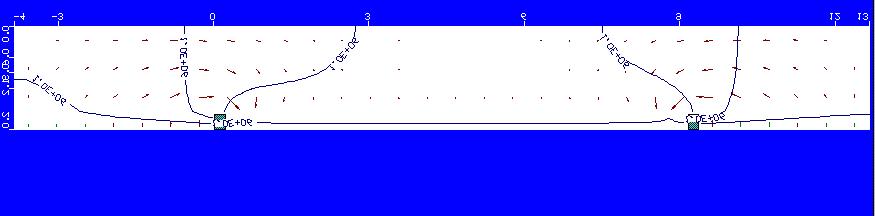
33 MODFLOW RESULTS Equipotentials Flow Lines 33
34 Source α - Direct Measurements TYPE SITE CONDITIONS CHEMICAL α BTEX Chatterton P=0 Pa η= B&T <1.2E-6 P=2.5 Pa η= E-7 P=10 Pa η= E-4 P=10 Pa η= E-5 P=30 Pa η= E-5 Alameda P~3 Pa (wind) benzene <9E-6 Slab-on-grade pentane <9E-7 Paulsboro SFR w\ bsmt P=? benzene <1E-6 CS CDOT HDQ Apartment/SFRs Avg 4 CS 3.0E-5 90 th th % 4 CS 6.5E-5 Redfields SFRs w\ bsmt or cs Avg DCE 7.6E-5 90 th th % DCE 1.2E-4 Lowry AFB Apartments Sept 97 Avg TCE ~ 1E-3?? Apartments/SFRs Avg TCE <1 to 6E-5 CS = chlorinated solvent, SFR = single-family residence 34
35 Subslab α - Tracer Tests & Radon Studies TRACER SITE CONDITIONS α Q soil /(Q b * P) BTEX Chatterton P >= 10 Pa 3E-4 to 6E Slab-on-grade SF 6 Alameda P ~ 3 Pa 2E-4 to 4E-4 ~0.006 Fischer, 96 Slab-on-grade SF 6 Central CA P = 30 Pa ~ Hodgson. 92 SFR w\ bsmt SF 6 Ben Lomand Experimental bsmt N/A 0.04 Garbesi, 93 3 mm edge crack Rn Spokane R. SFR slab-on highly 7.9E-3 to 1.4E-2 N/A Valley Rez- permeable sand & van, 92 gravel, winter Rn Indoor Rn SFRs 1.6E-3 N/A USA Little 92 Implication α generally < ~ for sub-slab vapour source Q b = building ventilation rate, Q soil = soil gas flowrate, A = subsurface foundation area 35
36 Comparison Measured to Predicted (J&E) α 36
37 Conclusions Techniques were developed to measure soil gas & BTX intrusion into building Flux chamber testing challenging Advective processes significant: natural case: while there were diurnal & barometric pumping effects, no measurable intrusion sustained depressurization > 2.5 Pa: high BTX intrusion Advection primarily controlled by P & soil permeability Intrusion through hairline cracks does occur! Good comparison between measured & model-predicted soil gas flow rates into building 37
38 Conclusions J&E model conservative, except for P > 2.5 Pa Building properties and interaction between building and vapour fate and transport is important ( P effects, barometric / temperature pumping) Significant uncertainty associated with this pathway - will be difficult to reduce this uncertainty 38