Permian Basin Production Optimization Conference. Organic Oil Recovery. Houston January Ken Gerbino Founder & Chairman
|
|
|
- Mildred Foster
- 5 years ago
- Views:
Transcription
1 Permian Basin Production Optimization Conference Organic Oil Recovery Houston January Ken Gerbino Founder & Chairman


2 Discussion Points Organic Oil Recovery A New Enhanced Oil Recovery (EOR) Technology What Does it Do How Does It Work Operator Benefits Global Results


3 The Titan Process Addresses Problems in the Oil Patch PRODUCTION DECLINES INCREASING WATER CUTS TRAPPED OIL WELL BORE DAMAGE H2S

4 Micro Oil Droplets
5 What Does The Titan Process Do Creates Micro Oil Droplets Improves Oil Mobility Changes Interfacial Tension of Oil to Rock and Water Changes Wettability Lowers Apparent Viscosity
 Microbes Surround Oil Globules and Physically Deform The Oil Micro Oil Droplets are")
6 The Titan Process Ecology and Biology of Reservoir is Analyzed Field Specific Nutrients are Injected into the Oil Reservoir Only Certain Microbial Species are Targeted Targeted Species Multiply Targeted Species Now Become Hydrophobic (Repel from Water) Microbes Surround Oil Globules and Physically Deform The Oil Micro Oil Droplets are Formed


7 From Lab to Field Five Step Application Process 1. Field Screening Simple Reservoir Questionnaire. 2. Laboratory Analysis The Core of the Process. Water Sampling 3. Field Test An In-Situ one well test process and analysis 4. Pilot Water injection system trial on multiple injectors servicing producing oil wells 5. Full Field Application We administer the process on field wide injection wells, dramatically increasing oil recovery
8 Reservoir Changes Pore Space Displacement is improved Interfacial Tension Between oil and water decreases as the oil interactive resident microbes become hydrophobic and move to the oil/water interface. Improved Oil Mobility Smaller micro droplets can more easily move through the pore matrix and be recovered Wettability Oil droplets are more easily released from the reservoir surfaces Sweep Efficiency is improved Micro Emulsion Formation - can lead to improved diversion of water which in turn can lead to improve displacement of oil from previously upswept regions. Improved Recovery and Water Cut Decrease

9 Field Application Simple and No Capital Expense
10 Field Logistics 4-5 Hours for One Well Application Injector Well Applications 8 Hours No Capital Expense Offshore and Onshore Batch Treated Every 4-6 Months Fast Response Time 7-10 Days
11 Titan Process Sweet Spot Oil gravity from API. Water ph between 6-8. Current Reservoir Temperature Less than 95 C. Formation Water Salinity of Less than 140,000 ppm TDS. Field Pressure History, more than 25% of Original. Reservoir Porosity of more than 20% of formation volume. (higher the better in general) Reservoir Permeability of greater than 7.5 millidarcies. (higher the better in general)
12 Step 1 - Screening Well Understood Geology (mapping). Good Water Injection History, Indicated Response. Current Well Completion Diagrams. Oil and Water Production Records. Chemical Treatment History. Full H2S History. Ideal Data Profile 12
13 Step 2 - Laboratory Analysis Titan Sampling Kit at Well Location. Samples Collected by Customer Personnel. Sample Kits Designed to Maintain & Log Transit Temperature. Samples Currently Shipped to Lab in California. Processed in the Lab to Map Microbial Life Cycle & DNA. Lab Reports are Typically Issued within 4 Weeks. Verifying Reservoir Biology 13
14 Step 3 In-Situ Well Test The nutrient package is blended. Nutrients delivered in a partially filled 1000 liter tote. Blended with 100 barrels of clean production water. Displaced with 150% of the tubing or casing volume. Production well is shut in for 7 days. Well Water Sampling: weekly, monthly Production report is provided with recommendations for next steps. Proving Microbial Response 14

15 Optimum Recovery and Flow Improvement


16 SPE PAPERS Average Production Increase From 24 Wells: 200% + SPE SPE SPE Canada California Texas Available at
17 Operator Benefits Production Increases Water Cut Reduced Trapped Oil Recovered Production Declines Altered Reserves Increase Low Cost - $6-$15 Per Incremental Barrel


18 Customers 18


19 Global Results 48 Commercial Oil Fields Four Continents 300 Well Applications 92% Average Production Increase 98% Success Rate on Injector Treatments
20 18 Canada Shut-In Well Barrels of Oil Per Day Improvement after Titan Strong Response from Shut-in Well. See SPE Paper Husky Energy BOPD Days 20
21 21 21
")


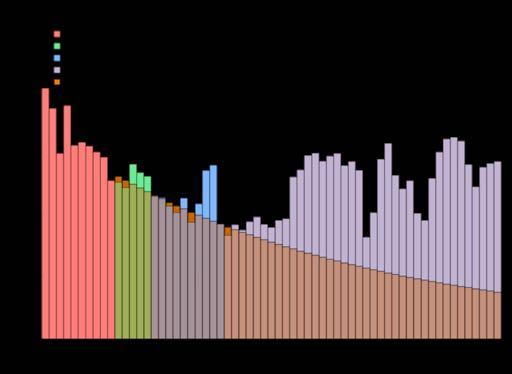
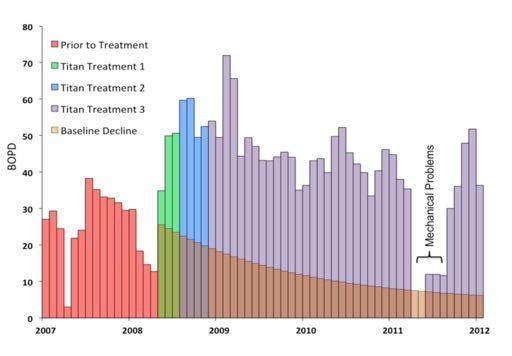
22 50 0S 2 Well BOPD SPE PAPER Dead California Well (Shut-in since 2003) Returned to Production in 2008 With the Titan Process Dead Well Revived. Graph depicts the Table presented in SPE Paper MEOR Success in Southern California. Venoco Inc /9/08 8/9/08 9/9/08 10/9/08 11/9/08 12/9/08 1/9/09 2/9/09 3/9/09 4/9/09 5/9/09 6/9/09 7/9/09 8/9/09 9/9/09 10/9/09 11/9/09 12/9/09 1/9/10 22
23 23 23
24 13 Weak Canadian Wells 62 to 190 BOPD Daily Oil Rate(m^3/d) Dec Oct Aug Jun May Mar Jan-2009 Injector Treatments 23-Oct Aug Jun Apr Feb Feb Dec-2010 Water Cut

25
26 Contact: Kenneth J. Gerbino Titan Oil Recovery, Inc