ULI North Texas Spring Conference May 16, Mike Sims, AICP North Central Texas Council of Governments Transportation Department
|
|
|
- Jeremy Fowler
- 5 years ago
- Views:
Transcription

1 You Think It s Crowded Now? Civic Vision: How Public-Private Partnerships in Land Use, Transportation, and Air Quality Will Shape the Future of Our Region ULI North Texas Spring Conference May 16, 2007 Mike Sims, AICP North Central Texas Council of Governments Transportation Department
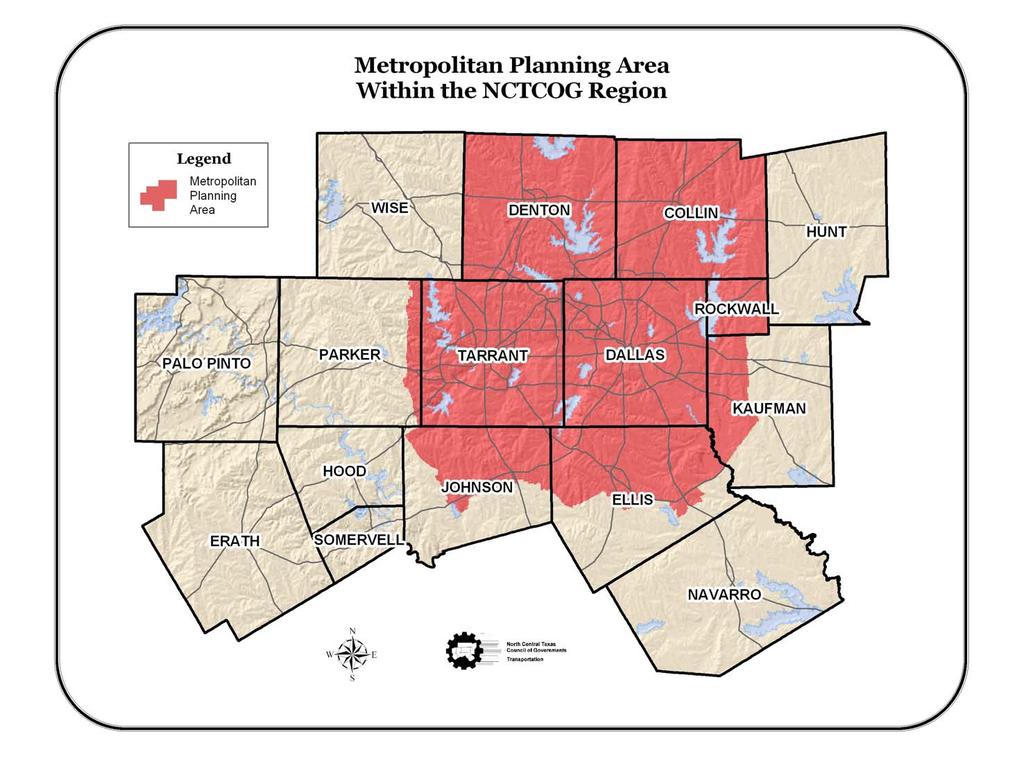
2 NCTCOG s Transportation Department NCTCOG was designated to serve as the Metropolitan Planning Organization (MPO) for the Dallas-Fort Worth (DFW) Metropolitan Area in The Regional Transportation Council (RTC), comprised primarily of local elected officials, is the independent regional transportation policy body associated with NCTCOG. As the MPO and as a nonattainment area, NCTCOG and the RTC are responsible for the planning and implementation of transportation programs and projects aimed at reducing congestion and improving mobility and air quality. The RTC adopts both a fiscally-constrained long-range plan and a needs-based long-range plan.
3

4 City Comparisons Fort Worth = Denver Irving = Orlando Arlington = Pittsburgh Dallas = San Diego
5 5.8 million people Regional Snapshot 1.13 million Hispanic, 112% increase Asian population increase over 100% % renter-occupied housing Mean travel time to work 27.5 minutes 57% of population has some college experience Mobile population: 55% of the population has moved since 1995 Average household income $63,874 48% of the housing stock was built in the last 25 years Average home value $100,000 Source: US Census Bureau, NCTCOG-RIS
6 Gross Metropolitan Area Product National Comparison Rank Metropolitan Area New York, NY Los Angeles, CA Chicago, IL Washington, DC Dallas-Fort Worth, TX Philadelphia, PA Boston, MA Houston, TX San Francisco, CA Atlanta, GA 2004 GMP* *Billions of U.S. Dollars
7 ,000 Dallas-Fort Worth Region Annual Population Growth 160, , , ,000 80,000 60,000 40,000 20, Population added in the last 10 years = New Hampshire Annual Population Growth
8 Major Developments By Type* 100% 93.5% 94.9% 90% 80% 70% 86.9% 85.0% 82.0% 70.2% Auto Oriented 60% Pedestrian Oriented 50% Hybrid 40% 30% 27.6% 20% 10% 0% 5.2% 4.7% 1.3% 0.4% Projects Completed in 2003 Projects Completed in % 14.1% 2.5% 0.9% Projects Completed in 2005 Projects Completed in % 2.6% 2.2% Projects Under Construction in 2006 Projects Announced in 2006 A total of 922 auto-oriented, pedestrian-oriented, and hybrid (a combination of auto and pedestrian-oriented) projects have been completed since 2003 A total of 964 auto-oriented, pedestrian-oriented, and hybrid projects are under construction or announced. * Development Monitoring data is collected for the 16-county NCTCOG region. Project types are defined as follows. Auto-Oriented Projects are projects built to primarily serve vehicular traffic through their design, layout, parking requirements, and access management. Pedestrian-Oriented Projects are projects with the design, configuration, and mix of uses that emphasize pedestrian and/or transit oriented environments. Hybrid Projects are projects with a mix of pedestrian/transit, and auto- oriented development.
9 Major Developments By Site 100% 90% 84% 85% 82% 82% 80% 70% 77% 75% Greenfield 60% Infill 50% Expansion 40% 30% 23% 20% 10% 12% 4% 11% 15% 16% 3% 3% 2% 18% 5% 3% 0% Projects Completed in 2003 Projects Completed in 2004 Projects Completed in 2005 Projects Completed in 2006 Projects Under Construction in 2006 Projects Announced in 2006 A total of 754 greenfield, infill, and expansion projects have been completed since A total of 959 greenfield, infill, and expansion projects are under construction or announced. * Development Monitoring data is collected for the 16-county NCTCOG region. Greenfield projects are those that are built on the land that has never had any development previously. Infill projects are those that are connected to existing urbanism that includes any development, or land that has a sort of development on top of it. Expansion projects are those that are an expansion of an existing development.
10 Highest Average at any Given Monitor (ppb) Hour Ozone Historical Trend (New Standard) DFW Nonattainment Area * Attainment Goal = 85 ppb^ BACKGROUND OZONE Consecutive 3-Year Periods ^Attainment Goal - According to the US EPA National Ambient Air Quality Standards, attainment is reached when, at each monitor, the three-year average of the annual fourth-highest daily maximum 8-hour average ozone concentration is less than 85 ppb. *NOTE: 1997 data is not for a complete ozone season. Source: NCTCOG Transportation Dept October 2005
11
12 System Performance Congestion Levels No Congestion Delay causes up to a 19% increase in Daily Vehicle Hours of Travel. Light Congestion Delay causes a 20% to 34% increase in Daily Vehicle Hours of Travel. Moderate Congestion Delay causes a 35% to 49% increase in Daily Vehicle Hours of Travel. Severe Congestion Delay causes a 50% or greater increase in Daily Vehicle Hours of Travel. Delay = Traffic Signal Delay and Congestion Delay
13 DFW Growth: What Does It Mean? 500 New Schools 570,000 New Homes 28 New Hospitals 11 New Malls 267 New Neighborhood Retail Centers 315,000 New Multi-Family Units $70 + billion of new Transportation Facilities 46 Million SQFT of Class A Office Space 13
14 Identified Funding Needs Dallas-Fort Worth Region (Updated based on Mobility 2030 Funding Levels) Metropolitan Transportation System Components Operation & Maintenance Congestion Mitigation Strategies Bicycle & Pedestrian Facilities and Transportation Enhancements Rail and Bus Transit System HOV and Managed Facilities Freeway and Toll Road System Regional Arterial and Local Thoroughfare System Additional Cost to Purchase Right-of-Way Rehabilitation Costs Goods Movement/Rail Freight Costs (Trans Tx Corridor) Funded Needs (Billions/2006 $) $18.7 $2.1 $1.1 $ $3.3 $26.4 $5.7 $ 2.6 Unfunded Needs (Billions/2006 $) $ $6.0 $1.1 $32.1 $6.7 TOTAL 1 $3.4 billion obtained through Regional Transit Initiative 2 Includes Freeway-to-Freeway Interchanges $70.9 (55 %) $58.6 (45 %) $129.5 Billion Revised: February 28, 2007
15
16
17
18
19 Growth of Revenue-Producing Highway System: 2000 to Miles of Highway System Freeway Tollway + Managed Lanes Year
20
21
22 Long-Term Transportation Performance Statistics Population PERFORMANCE MEASURE Employment Households Vehicle Miles of Travel (VMT) Hourly Capacity (Miles) VMT/Household Vehicle Hours Spent in Delay (Daily) Percent Increase in Travel Time Due to Congestion Annual Cost of Congestion (Billions) Annual Cost of Congestion per Household ,856,432 3,664,954 2,177, ,392,421 30,283, ,026, % $4.17 $1,915 Mobility ,503,146 5,256,667 3,172, ,219,970 43,780, ,697, % $6.62 $2, 087

23 Increased Travel Time and Costs Ground Level Ozone Inadequate Transit Land Use/Transportation Mismatch Decreased Freight Access Transportation Issues Need Increased Safety and Security Since 1980, average Vehicle Miles Traveled per household has increased from 58 to 70.


24 Transportation Issue Regional Freight and Commuter Rail Hubs Tower 55 Carrollton Intermodal Union Station

25 Transportation Issues Air Quality and Transit Operations In 1969, 42% walked In 2001, 16% walked

26 Transportation Issues Maintenance

27 Transportation Issues Peak Period Reliability
28 Transportation Issues Quality of Life

29 Transportation Issues Statewide Transportation Demand
30 Transportation Issues Statewide Transportation Demand 6 Lanes 12 Lanes 20 Lanes I.H. 35 Total Lane Needs by 2020 Right-of-way is not available to meet the demands of future growth. 16 Lanes 16 Lanes 8 Lanes 10 Lanes 14 Lanes 12 Lanes 16 Lanes 16 Lanes 12 Lanes 4 Lanes Source: TxDOT 2003 Study
31 NCTCOG Regional Response Regional Transportation Council Priorities for TTC Meet concurrency requirement for State/Regional planning. 2. Support sustainable development while protecting right-of-way today. 3. Separate modes in urban areas. 4. Route from center of region first. 5. Stage construct roadways, truck facilities, and freight rail bypasses. 6. Use the TTC-35 initiative to pay for improvements in the region including the Outer Loop/Rail Bypass.
32 Trans-Texas Corridor-35 Current Status Tier 1 Enviornmental Analysis: TxDOT is responding to comments made on the document. Environmental Impact Analysis (EIS) will be sent to the Federal Highways Administration (FHWA) in May or June By the end of 2007, TxDOT hopes to have a Record of Decision from the FHWA regarding the EIS. Master Development Plan: The Cintra-Zachary Master Plan has been accepted by TxDOT and is avaliable on the TTC-35 website:
33
34
35 1. Step (Lead) Tier I Environmental (TxDOT) Outer Loop/Rail Bypass Key Steps to Implementation Importance Establishes general study area Statewide Status Submitted, not federally approved 2. Master Development Plan (Cintra-Zachary) Identifies general toll financial feasibility and staging Completed, regularly updated Metropolitan Transportation Plan (RTC) Set regional purpose, need, concept, and policy January 2007 RTC Action 4. Outer Loop/Rail Bypass Corridor Refinement (RTC) Sets logical termini, schedules, modes, refined corridor alignments Pending NCTCOG hiring and NCTCOG/TxDOT MOU 5. Segment RTC Approval Requirement to move to Mobility Plan Update Pending RTC Corridor Refinement Study 6. Final Environmental Study (TxDOT) Required to construct Pending federal approval of Tier I Study 7. Metropolitan Transportation Plan Update (RTC) Required to construct Pending RTC action to approve alignment/concept from final study 8. Segment Financing (Private Sector) Required to construct Pending completion of all steps
36 Outer Loop/Rail Bypass Factors to be Evaluated in the Outer Loop/Rail Bypass Refinement Study Elevation changes and soils Cemeteries and archaeological sites Local parks, schools, and churches Wetlands, lakes, and water resources Economic and business resources Public comment and local government input


37 Outer Loop/Rail Bypass Sample Results of Computerized Alignment Analysis for the RTC s Corridor Refinement Study

38 Outer Loop/Rail Bypass Sample Results of Computerized Alignment Analysis for the RTC s Outer Loop/Rail Bypass Refinement Study
39 Outer Loop/Rail Bypass Freight Oriented Development A major intermodal freight hub means: $100 million private investment in rail intermodal facilities Site selection favored by national and international logistics firms New warehouse, assembly, and distribution facility construction 30,000+ direct new jobs over 10 years Long-term tax base stability and economic development opportunity
40

41 Transportation Issues Historic Street Car Developments and Recent Growth Patterns
42 Transportation Issues Historic Street Car Developments and Recent Growth Patterns Average Home-Based VMT/HH Regional Average Historic Street Car System in McKinney/Denton Historic Street Car System in Fort Worth Historic Street Car System in Dallas Growth Areas in Dallas/Fort Worth


43 NCTCOG Regional Response Target the Land Use Transportation Connection as a Long-term Air Quality Improvement Strategy Can I walk from here to there? Highland Park Village, Courtesy of Scott Polikov

44 NCTCOG Land Use Initiatives RTC Sustainable Development Policy RTC Sustainable Development Calls for Projects Rail System Expansion and Improvement Transit Oriented Development Planning Assistance Vision North Texas Outreach Program Development Monitoring and Demographic Forecasting Transportation Alternative Future Scenarios

 Developing employment nodes in low income areas reduces vehicle")
45 Local Strategy Improve Transportation Access to Infill Developments Cockrell Hill Interchange Example Completion Date: 2001 Project Cost: $16.2 million Increase in Total Value: (Land and Improvements) $4.8 million $193.4 million Cockrell Hill at I-30 (2000) Developing employment nodes in low income areas reduces vehicle miles traveled by older vehicles and improves air quality. Cockrell Hill at I-30 (2004)

46 Dallas Area Rapid Transit Example 1 Local Strategy Expand Rail Access % greater increase in commercial valuations around DART Stations than control areas % greater increase in multifamily residential valuations around DART Stations than control areas % greater increase in office valuations around DART Stations than control areas $3.3 billion in new investment has been announced, broken ground or been planned near DART Stations since Data reported by the University of North Texas
47 The Regional Transportation Council s Sustainable Development Policy Utilize Existing System Capacity Single use area type, non-transit, connected to existing infrastructure Infill rail Infill mixed use with rail access Commuter rail/light rail in single use areas Improve Rail Mobility Infill mixed use Mixed use with rail Promote Mixed Use Stand alone mixed use Improve Access Management Shared drives/parking, spacing of turns/signals


48 NCTCOG Scenario Planning Rail Alternative Future Test Increased Transit Oriented Development and Preservation of Rural Areas Regional Control Total 8.4 million people in the Metropolitan Planning Area in 2030
49 Rail Scenario Demographic Sensitivity Analysis Market Demand for Housing Near Transit * 25% of future households will desire a transit zone.** 7,952,070 total people by 2025 = 1,988,017 total people desiring a transit zone household 140 total stations by 2025 = 57 units/per acre net needed average per station * Market Includes New and Existing Households and Stations. ** National Market Demand Study for 2025, Transit Zone is Defined as the ¼ Mile Radius Around a Rail Station.
50 Demographic Sensitivity Analysis Scenario Statistics Data of Interest Rail Scenario Infill Scenario RCCT Scenario VNT Scenario Forward Dallas! MPA Average Trip Length -8% -3% % % -2.9% MPA Rail Transit Boardings + 52% + 9% + 8% % + 7.4% MPA Non-Rail Transit Boardings + 29% + 11% + 5% % + 11% MPA Vehicle Miles Traveled -6% -5% -1.2% % -2.2% MPA Vehicle Hours Traveled -9% -7% -1.7% % -5.7%
51 Demographic Sensitivity Analysis Scenario Statistics Data of Interest Rail Scenario Infill Scenario RCCT Scenario VNT Scenario Forward Dallas! Total Vehicle Hours of Delay - 24% - 19% -4% % % Lane Mile Needs - 13% - 10% % % % Financial Needs (billions) - $9.5 - $6.7 - $2.9 - $ $7.0 Roadway Pavement Needs sq. mi sq. mi sq. mi sq. mi sq. mi. NOx Emissions -4.1% -3.9% -1.2% % -2.4% (Nitrogen Oxides) VOC Emissions -5.3% -5.2% -1.5% % -3.0% (Volatile Organic Compounds)
52 Sample Local Land Use Policies with Transportation Benefit Expand direct access to freight rail for truck dependent businesses. Promote multiple intense development centers. Increase population and employment at rail stations. Encourage central city and southern sector growth. Address mobility needs around rail stations to mitigate localized congestion. Limit residential densities away from rail service and existing employment centers. Preserve large lots/small farms in rural/suburban areas.
53 2001 Land Use/Transportation Joint Venture Program October 2001, RTC Approval 19 Land Use/Transportation Joint Venture Projects 1 Rail Corridor Study of 10 Corridors 1 Outreach Program $40.8 Million in Federal Funds (CMAQ and STP-MM)


54 Photos courtesy of DART 2001 Land Use/Transportation Joint Venture Program Downtown Plano Description: Located in historic downtown Plano around a DART light rail station this project included the creation of a pedestrian district, sidewalks, landscaping, utility relocation, and street reconstruction. Funding: $2,612,021 Total $2,089,616 Federal $522,404 Local Match Status: Completed


55 2001 Land Use/Transportation Joint Venture Program Description: Mix of uses, including residential, office, and retail uses on a pedestrian-friendly street system. Variety of housing options, including lofts, apartments, and townhomes. Pocket parks, bicycle, and pedestrian facilities located throughout development. Example of Transit-Oriented Development without the transit Funding: $1,404,000 Total $826,574 Federal $577,426 Local Match Status: Completed Austin Ranch
56 Sustainable Development Funding Program April 2006, RTC Approval Center of Development Excellence 28 Infrastructure Projects 8 Planning Projects 4 Landbanking Projects 52 Transit Oriented Development Projects $40.16 Million in Local Funds
 Center of Development Excellence Local Sustainable Development Planning Programs Funding Goals: Expand Rail Service Accessibility Support Transit-Oriented Developments Support Local Infill")
57 Sustainable Development Call for Projects Screening/Project Selection Process Funding For: Transportation Infrastructure Land Banking (not to exceed 20% of total sustainable development funds) Center of Development Excellence Local Sustainable Development Planning Programs Funding Goals: Expand Rail Service Accessibility Support Transit-Oriented Developments Support Local Infill Developments Minimum Criteria For Transportation Infrastructure: Consistent With Areas of Interest Correct Zoning In Place Public/Private Partnership Incentives For: Housing-Income Match Workforce Housing Near Transit Areas with High Emitting Vehicles Density/Walkability Mix of Residential and Non-Residential Uses Job Creation In High Unemployment Areas Public sector action to un-bank previously banked land
58 Sustainable Development Call for Projects Areas of Interest Sustainable Development Areas of Interest Legend Denton Collin Sustainable Development Focus Areas Major Roadways Mobility 2025 Rail System Dallas-Fort Worth Nine County Nonattainment Area Major Lakes Rockwall Parker Tarrant Dallas Kaufman Focus Areas Rail: Walking Distance to Current or Potential Future Station Location Infill: Developed Area With a Concentration of Unemployed Persons, High Emitting Vehicles, or Low Income Households Johnson Ellis Infill: Historic Downtowns With Multiple Contiguous Street Block Frontage of Pedestrian-Oriented Developments North Central Texas Council of Governments Transportation Department

59 Sustainable Development Funding Program South Dallas Logistics District Grade Separation Needs Wintergreen Road crossing currently closed due to safety concerns TxDOT to improve Fulghum Road Federal earmark funds focused on Pleasant Run RTC Funded Wintergreen road and Pleasant Run road local match

60 Sustainable Development Funding Program Dallas Design District TIF Walking and Bicycling Description: Funding will be used to improve more than 3-miles of sidewalk connections along Hi-Line Drive, Turtle Creek Boulevard, Oak Lawn Avenue, Slocum, and Edison Streets in the Dallas Design District. Includes an estimated 31,753 SF of new or replacement sidewalks and crosswalks with shade trees, pedestrian scale lighting, benches, bike racks, and trash receptacles. Funding: $1,037,236 Total $829,789 RTC Local $207,447 Local Match Improvements Status: Waiting to execute Interlocal Agreement. DART LRT & TRE Commuter Rail 2025 MASTER PLAN DALLAS DESIGN DISTRICT TIF DISTRICT Public Sponsor: City of Dallas Private Sponsor: Dallas Design District TIF District/Trinity Association
 Conceptual Site Plan Public Sponsor: City of Dallas Private Sponsor: Dallas Design District TIF District/Trinity")
61 Sustainable Development Funding Program Dallas Design District TIF Walking and Bicycling Improvements (cont.) Conceptual Site Plan Public Sponsor: City of Dallas Private Sponsor: Dallas Design District TIF District/Trinity Association


62 Sustainable Development Funding Program Trinity Bluff Description: Trinity Bluff is a two-phased, professionally planned, urban redevelopment project located in downtown Fort Worth approximately one-half mile northeast of the Tarrant County Courthouse. The proposed Trinity Bluff Streetscape Project has been designed to be pedestrian friendly and to encourage an active neighborhood. Plans for Trinity Bluff include wide sidewalks and easy access to nearby recreation areas including bicycle paths, jogging trails and the Trinity River corridor and proposed Town Lake. Funding: $1,313,625 Total $1,050,900 RTC Local $262,725 Local Match Status: Interlocal Agreement executed; Notice to Proceed issued. Public Sponsor: City of Fort Worth Private Sponsor: Trinity Bluff Development, Ltd.
 Public Sponsor: City of Fort Worth Private Sponsor: Trinity Bluff")
63 Sustainable Development Program Trinity Bluff (cont.) Public Sponsor: City of Fort Worth Private Sponsor: Trinity Bluff Development, Ltd.
64 MOBILITY 2030 Alternative Future Policy Program Policy Program Steps 1. RTC approves Alternative Future Policy Program in Mobility Plan. 2. Staff/local governments develop draft ordinances. 3. RTC approves alternative future model ordinances. 4. Local government adopts alternative future model ordinances. Sustainable Development Policy Topics Infill Transit Oriented Development Freight Oriented Development Rural Preservation Mixed Use Development Access Management Redevelop South Dallas/Southeast Fort Worth Bicycle/Pedestrian Tied to Land Use
65 Context Sensitive Solutions (CSS) Core Principles Balance safety, mobility, community, and environmental goals in all projects. Involve the public and stakeholders early and continuously throughout the planning and project development process. Use an interdisciplinary team tailored to project needs. Address all modes of travel. Incorporate aesthetics as an integral part of good design.

66 Context Sensitive Solutions (CSS) Design Examples Illustration of the elements of a context sensitive thoroughfare Source: ITE CSS Recommended Practice, pg. 56

67 TOD and Form-Based Codes Rural to Urban Transect Increasing Land Use Mix Decreasing VMT/HH

 6")


68 Name Regional Examples TOD and Form-Based Codes The Transect in North Central Texas Edge Suburban Suburban Center Urban Center Urban Core Illinois Station Hurst/Bell Station Parker Road Station CentrePort Station Kiest Station Downtown Plano Addison Circle Mockingbird Station Cityplace Station Downtown Dallas Downtown Fort Worth Building Height Surface Parking to Single Story 2 Stories 4 Stories 11 Stories 18+ Stories Residential Density (units/acre) Office Employment (employees/acre) Retail Employment (employees/acre) Uses sf residential, some retail, office, light to heavy industrial sf residential, mf residential, retail, office, light to heavy industrial sf residential, mf residential, retail, office, light industrial sf residential, mf residential, highdensity retail, office, entertainment mf residential, highdensity retail, office, entertainment Smart Code ID T3 T4 T5 T5.5 T6


69 TOD and Form-Based Codes Form-Based Code Basics What is Form-Based Code? A method of regulating development to achieve a specific urban form Creates a predictable public realm by controlling physical form primarily, instead of land use. Helps to achieve a community vision based on time-tested forms of urbanism. Source: Form-Based Codes Institute


70 TOD and Form-Based Codes Mockingbird Station Private Investment: $150 million Public Investment: $2.4 million CMAQ Funds for Katy Trail improvements Rail Investment: about $50 million for station construction Mockingbird Station has created an urban environment that offers living, shopping, and dining directly accessible by DART light rail.
71 The City of Addison has invested $10.7 million in the Addison Circle project. Initial land value: $23.7 million TOD and Form-Based Codes Addison Circle Current property values in the Addison Circle District total $213.2 million, a 20:1 investment ratio. Annual property tax revenue from the assessed values, at the current tax rate, would provide over $1 million in revenue.
72 Sustainable Development Upcoming Events Designing Streets for Pedestrian Safety Course May 17 & 18, 2007 Context Sensitive Solutions Information Session June 13, 2007 Sustainable Development Call for Projects $40 million Brownfields Call for Projects $3 million

73 Transportation Issue Civic Vision For more information: Mike Sims, AICP