High efficiency non-residential buildings: concepts, implementations and experiences from the UK
|
|
|
- Norma Riley
- 5 years ago
- Views:
Transcription
1 High efficiency non-residential buildings: concepts, implementations and experiences from the UK Kevin J. Lomas Department of Civil and Building Engineering, Loughborough University, UK.
2 Structure of talk Global warming UK energy and CO 2 policy Advanced natural ventilation ANV in a temperature climate ANV hybrid in a severe climate Resilience of ANV to UK climate change Conclusions 2

3 Central England Temperature since 1659: Evidence of Global warming? Highest recorded temperature in UK 10 August 2003: 38.5 o C warmest year on record. July - warmest month ever. Warmest September ever Average 10-year running mean Dickens years The winter of 66 The seven hottest years in 20th century recorded between 1990 and 2000 The worlds longest available instrumental temperature record 3
4 Impact of Global Warming: Ice Caps North West passage open for first time since records began BBC, Friday, 14 September 2007, 21:19 GMT UK 4
5 Impact of Global Warming: 2003 Heat Wave Hottest in France for 50 years. Heat wave lasted two weeks UK: 2,045 additional deaths France: 14,802 additional deaths Germany: 7,000 additional deaths Europe: 35,000 additional deaths The old especially, and the very young suffer. 5 In France 91% of victims were over 65.
6 UK Targets to Curtail Global Warming Kyoto target - CO 2 levels to 12.5% below 1990 level by (met). Aspire to reduce UK CO 2 to 20% below 1990 level by 2010 (not be met) Climate Change Act cut UK CO 2 by 80% of 1990 level by Generate 10% of UK energy from renewables by 2010 (not met). 6
7 UK Energy & CO 2 emissions Energy, 2001 CO 2 emissions, 2001 Transport 27% Domestic 27% Transport 34% Domestic 30% Other end users 17% Industry 29% Services 14% Industry 22% 7 Source: DTI 2002 Source: DEFRA 2002 Commercial and public buildings 15% of UK emissions.


8 8 The CO 2 emissions from 20 buildings
9 Temperatures London and Stuttgart 23 o C 24 o C 9

10 Simple natural ventilation (SNV) Deep plan Security / urban protection Occupant control Draught control Ventilation assistance Mechanical cooling Energy recovery No Poor Yes Poor No No No Source: CIBSE Guide AM10 10
11 Stack driven flow p = s ρ o Q = C d ght o 2 P A ρ 1 T ext 1 T int Outside air temperature = 24 C 1.2m 1.2m 0.5m 6m 3m 2m 0.5m Inside temperature = 27 C 2.5m Set NPL midway between upper-most opening and outlet Q = C d A 2ghT o 1 T ext 1 T int 1.2m 0.5m Opening Distance from NPL (m) Required flow rate (m 3 /s) Stack pressure (Pa) C d A (m 2 ) C d (-) A (m 2 ) outlet
, Guidebook No 12, Federation of European Heating and Air-conditioning Associates, 2000,")
12 Displacement ventilation principles 30% 70% T a + 7 K Extract air temperature T a ( C) Supply air temperature T a + 2 K Air temperature at floor 12 Source: REHVA, Displacement ventilation in non-industrial premises, in: H Skistad (Ed), Guidebook No 12, Federation of European Heating and Air-conditioning Associates, 2000, 95pp


13 13 CFD animation: stack-driven ventilation


14 The stack effect the self-rectifying ventilation system Queens Building De Montfort U. 14
15 Different forms of stack ventilation Edge-in, Centre-out (E-C) Centre-in, Edge-out (C-E) Edge-in, Edge-out (E-E) Centre-in, Centre-out (C-C) 15
16 The lightwells HAWL, Illinois 16


17 Stacks SSEES, London HAWL, Illinois 17

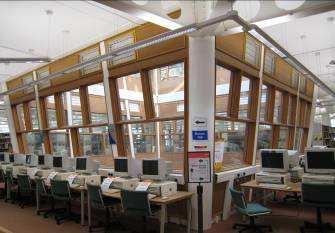
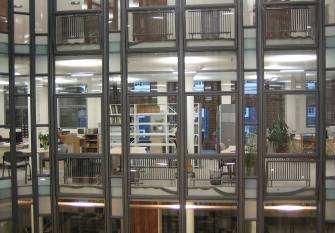
18 Frederick Lanchester Library: Coventry University Central UK location City centre site Strong architecture Advanced natural ventilation Night venting and exposed thermal mass Daylight CHP 18
19 Centre-in edge-out stack ventilation Deep plan Security / urban protection Edge-in, Centre-out (E-C) Yes Good Centre-in, Edge-out (C-E) Occupant control Draught control Ventilation assistance Mechanical cooling Edge-in, Edge-out (E-E) No Good Yes Yes Centre-in, Centre-out (C-C) Energy recovery No * * Possible in mixed-mode variant, eg Judson 19


20 Typical Floor Layout stair well, wc Floor plate 50mx50m 20 seminar room
21 Environmental Control: Air Supply U roof =


22 22 Coventry: Air Supply
23 Tried and tested energy saving techniques IESD, De Montfort University 23
24 Environmental Control: Air Exhaust U wall = m U window =


25 25 Coventry: Air Exhaust
26 UK design guidance : overheating criterion for free running buildings (CIBSE Guide A) Need to analyse risk of overheating and minimise length and severity of discomfort Limit expected occurrence of operative temperatures over 28 C [82 F] to 1% of annual occupied period 1 Overheating criteria to be assessed using the CIBSE design summer year (DSY) 1 Criterion for offices, schools and dwelling areas 26
.")

27 Internal and external temperatures during the monitoring period (June 2004 June 2005). 86 o F 72 o F Source: Krausse B, Cook M & Lomas K (2007) Environmental performance of a naturally ventilated city centre library, Energy and Buildings 27
28 Average floor temperatures during a hot spell Range 27 o F Throughout the entire year there were no occurrences of internal temperatures in excess of 28 o C. 28 Temperature [ C] 31/07/ :00 31/07/ :00 01/08/ :00 01/08/ :00 02/08/ :00 02/08/ :00 03/08/ :00 03/08/ :00 04/08/ :00 04/08/ :00 05/08/ :00 05/08/ :00 06/08/ :00 06/08/ :00 07/08/ :00 07/08/ :00 08/08/ :00 08/08/ :00 Ground Floor 1st Floor 2nd Floor 3rd Floor ambient Source: Krausse B, Cook M & Lomas K (2007) Environmental performance of a naturally ventilated city centre library, Energy and Buildings
29 Temperatures and CO 2 levels on the second floor: 30 May 12 June Temperature [ C] 30/05/ /05/ /06/ /06/ /06/ /06/ /06/ /06/ /06/ /06/ /06/ /06/ /06/ /06/2005 CO 2 [ppm] A_temp B_temp C_temp D_temp A_CO2_mod C_CO2_mod D_CO2
30 Comparison of measured annual energy consumption in 2004 with benchmark values Lanchester Library Heating Cooling Electricity Air-conditioned standard typical (ECON 19) Air-conditioned standard GP (ECON 19) Naturally ventilated open-plan typical (ECON 19) Naturally ventilated open-plan GP (ECON 19) annual energy use [kwh/m 2 /h] 30
31 How resilient is ANV to projected future climate of the UK How will a warmer climate influence the energy demand of ANV buildings? Will ANV buildings maintain thermal comfort in the UK climate of the future? If not - What will the internal temperatures be in ANV buildings at various UK locations? Does ANV perform better than SNV in a warmer climate? In which areas of the country might ANV fail to meet thermal comfort criteria? At what date in the future will thermal comfort criteria be exceeded? 31
32 Past and projected global surface temperatures A2 Scenario, Growth broadly as at present. Source: Intergovernmental panel on climate change 32
33 Typical temperatures in the London and Projected Temperatures for 2080 (A2 scenario) London TRY London 2080 A2TRY 37 o C o C Dry-Bulb Temperature C Day 33
34 Occurrence of warm temperatures: London 2005, 2020, 2050, L - TRY05 L - TRY20 L - TRY50 L - TRY Hours over 28 o C Number of hours [28 C] Dry-Bulb Temperature ( o C) 34
35 London temperatures in 2080 In 2080 London could be as warm as the following places are today: Tanger Toulouse Tenerife and Thessaloniki but there will be more frequent and more intense heat waves. 35

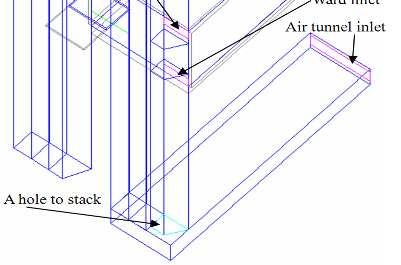
36 Hospital ward with ANV: section, elevation and plan Stack - tunnel to inlet: 3m Window: 1.4m x 1.6m 7.2m x 3.6m x 3.6m high Stack - outlet to exhaust: 9.5m 36


37 The ANV geometry studied 1m window shading 37
38 Comfort perception in future climates - European Standard EN15215 High level of expectation for spaces occupied by very sensitive and fragile persons special requirements like handicapped, sick, very young children and elderly persons. Normal level of expectation used for new buildings and renovations. Only apply when spaces regulated by occupants Spaces must have operable windows opening to outdoors No mechanical cooling in the space Weather data to use not stated Limiting hours-over not stated. 38
39 The EN15251 adaptive criteria: current London DSY data 30 HTM03-01 criterion, 28 C Temperatrue eratrue (C) EN15251 adaptive criterion Days Daily Mean Running Mean Category I Upper limit 39
40 Life expectancy of naturally ventilated wards in a warming UK climate. Vent Type Therm Mass Win area m 2 Vent as % FA Or Glazng Heat Gains W/m 2 day/night SNV LW N Low-e 21/4 S.C. 21/4 SNV LW S Low-e 21/4 S.C 21/4 ANV LW S Low-e 21/4 21/4 ANV HW S Low-e 31/14 41/24 51/34 21/4 ANV HW S Low-e 31/14 41/24 51/34 40
41 Predicted energy use and CO 2 emissions: ANV and mechanically ventilated (MV) ward Case and Year 1a 2005 Space Conditioning ANV Winter 40-50l/s ventilation 2b MV, 6ach -1 Heat exch % efficient. 1a 2080 ANV Winter 40-50l/s ventilation Parameters [1] [2] [3] [4] [5] [6] [7] Delivered Emissions Demanded MWh MWh GJ GJ/100m 3 Tonnes kgc/m 3 C kgco Carbon 2 /m 2 Heating Ventilation Light and Appl Total Heating Ventilation Light and Appl Total Heating Ventilation Light and Appl Total Both meet new build 35-55W/100m 3 target and refurb. target of 55-65W/100m 3. MV is very sensitive to heat recovery efficiency. 41
42 Conclusions natural ventilation Simple natural ventilation, even with solar control glazing, is unlikely to prevent overheating in the London area even in today s climate. ANV can, at present, prevent overheating in all UK locations except London area 1. The life expectancy of naturally ventilated buildings depends on location, internal heat gains, ventilation areas, and thermal mass in this order. ANV offers much greater resilience to climate change than simple natural ventilation. ANV can reduce the CO 2 emissions by 50% compared to mechanically ventilation. ANV has potential in many area of Europe. 1 Unless heat gains are very low. 42


43 43